
Abstract
Background:
Reduced muscle strength is an acknowledged symptom of Graves' disease, but the knowledge on severity is sparse. This study aimed to investigate muscle strength, balance, and muscle function in patients with Graves' disease compared to age- and sex-matched healthy controls.
Methods:
Using a cross-sectional design, 55 patients newly diagnosed with Graves' disease were compared to 55 euthyroid controls, matched on sex, age, and menopausal status. Isometric muscle strength (N) and maximum force production (N/s) were measured across different muscles groups using a dynamometer chair and postural stability (balance) in different positions using a stadiometer. Muscle function was assessed using the Timed-Up-and-Go test and the Repeated Chair Stand test.
Results:
Patients and controls were well matched. Handgrip maximum muscle strength as well as strength at elbow and knee flexion and extension were significantly impaired in patients compared to controls. Maximum force production was only significantly reduced at elbow flexion. Patients performed the Timed-Up-and-Go and the Repeated Chair Stand test significantly slower than controls, and postural stability was significantly reduced in patients compared to controls in all positions. Free triiodothyronine correlated with reduced muscle strength and postural stability.
Conclusions:
At the time of diagnosis, Graves' disease is associated with impaired maximum muscle strength, performance, and balance, whereas maximum force production is overall comparable to euthyroid controls.
Introduction
Graves' disease is an autoimmune disease in which thyroid receptor autoantibodies (TRAb) target the thyrotropin receptor and induce hyperthyroidism. Palpitations, weight loss, and heat intolerance are frequent symptoms, but every organ is affected. In Denmark, hyperthyroidism is diagnosed in approximately 5000 patients per year among whom 40% have Graves' disease (1).
Since 1835, reduced muscle strength has been acknowledged as a symptom of Graves' disease (2). However, the knowledge on the frequency, severity, and course of the muscle symptoms is sparse. A number of studies (3 –8) have demonstrated apparently reduced muscle strength in hyperthyroid patients, with each of the studies including 7–54 patients. All but three (5,6,8) of these studies lacked a control group for comparison, and large studies on patients specifically suffering from Graves' disease are lacking. Most studies only investigated muscle strength in two or three different positions, and the interest was on muscle force and not on the maximum force production.
The present study aimed to investigate muscle strength and function, including postural stability, in patients newly diagnosed with Graves' disease compared to euthyroid population-based healthy controls. Furthermore, associations between muscle strength/function and biomarkers of Graves' disease, as well as plasma levels of 25-hydroxyvitamin D (25OHD) and ionized calcium, were studied.
Methods
Study population
Patients referred to hospitals in the Central Denmark Region for diagnostic work-up or treatment of newly diagnosed hyperthyroidism were considered for inclusion. Inclusion criteria were: (i) newly diagnosed Graves' disease with thyrotropin (TSH) levels below the lower limit of the reference interval (<0.3 × 10³ IU) and free thyroid hormones (triiodothyronine [T3] and/or thyroxine [T4]) above the upper limit of normal (ULN), as well as plasma levels of thyroid receptor antibody (TRAb) above the ULN (>1.75 IU/L); (ii) aged ≥18 years; and (iii) planned or started (<2 weeks) medical antithyroid treatment.
Euthyroid controls were recruited through direct mailing to a random sample from the general population, announcement on social media, and posters at public spaces. Each patient was matched with a control according to age (±2 years), sex, and, for women, menopausal status.
Exclusion criteria were: (i) previously diagnosed with hyperthyroidism; (ii) chronic granulomatous disease; (iii) significant hypercalcemia (plasma ionized calcium >1.40 mmol/L); (iv) renal insufficiency (estimated glomerular filtration rate <45 mL/min); (v) regular intake of immunomodulatory drugs; (vi) current malignant disease; (vii) drug or alcohol abuse; and (viii) pregnancy.
Visits were conducted from March 2015 to July 2016. Each participant gave informed consent, and the study was conducted according to the Declaration of Helsinki II. The Danish Data Protection Agency was notified about the study (2007-58-0010), and it was approved by the Central Denmark Region Committees on Health Research Ethics.
Muscle strength
The maximum voluntary isometric muscle strength (N) and maximum force production (N/s) were measured at the upper and lower extremity with an adjustable dynamometer chair connected to a computer (Good Strength; Metitur Ltd., Jyväskylä. Finland) (9). The device has demonstrated high reliability coefficients for both upper and lower extremities (0.88–0.96) (10). Recording time of each measurement was five seconds. Upper extremity strength was assessed by hand grip and elbow flexion and extension with the elbow in 90° flexion from neutral position and the wrist attached by a belt to a measurement system. Lower extremity strength was assessed by knee flexion and extension at 60° and 90° angles from the fully extended leg. All measurements were performed while sitting in a chair with the trunk supported by three belts to minimize transfer of strength from other sites, as well as belts over the active ankle, thigh, and wrist. The excises were performed on the dominant hand's side and repeated three times with a 30-second break between the recordings. The best performance was chosen for further analysis.
Postural stability
Postural stability was assessed by using a stadiometer (Good Performance Platform System; Metitur Ltd.) to measure body sway. The stadiometer is a triangular platform used to convert shifts in weight to digital data to obtain an assessment of maintenance of balance. The platform reports length (mm) and speed (mm/s) of the sway in the medial-lateral and anterior-posterior direction. The intraclass correlation coefficients were 0.87–0.96 (11).
Postural stability was measured under four settings: Normal standing, eyes open (EO). The participant was placed with the feet next to each other 20 cm apart; the arms were in relaxed position hanging freely at each side and with a fixed gaze on a marked spot at eye level. Normal standing, eyes closed (EC). The participant was placed in the same position as the previous exercise but with their eyes closed. Semi-tandem. The heel of the foot on the non-dominant hand side was placed alongside the big toe on the dominant hand's side. Arms and gaze were in accordance with the first measure. Tandem. The non-dominant foot was placed in front of the dominant hand's foot. Arms and gaze were in accordance with the first measure.
The exercises were performed barefooted. The duration of each exercise was 20 seconds, and the exercise was repeated three times. Data are presented as the velocity moment (VM mm2/s), which was calculated as 90% of the product of the actual distance of movement in the medial-lateral and anterior-posterior direction from the center of pressure per second. The best measure for each exercise (i.e., the lowest VM) was chosen for further analysis
Muscle function tests
For the Timed-Up-and-Go (TUG) test, the participants were placed in a chair with their arms crossed over their chest, asked to stand up, walk three meters in a straight line, turn around, walk back, and return to their seat (12). This process was timed and repeated twice or multiple times until recordings of two attempts were less than one second apart. The fastest (best) performance was used for analyses.
In the Repeated Chair Stand (RCS) test, participants were placed in a chair with their arms crossed over their chest and their feet flat on the floor. The participants were asked to rise and sit 10 times in a row as fast as possible without using their hands (13). The test was performed twice or more until two attempts were less than one second apart. The fastest (best) performance was used for analyses.
Physical activity
Physical activity was measured using a Danish version of the Physical Activity Scale (PAS) questionnaire consisting of nine levels of physical activities, ranging from sleep to intense workout. Every level was depicted with a drawing and a description of activities related to each level. Participants had to fill out how many out of 24 hours they spent on each activity on average during the week prior to the examination date (14).
Each level of activity corresponded to a known metabolic equivalent (MET; 1 kcl/kg/h): sleep (0.9 MET), TV viewing/reading (1.0 MET), sitting/working (1.5 METs), standing (2.0 METs), light activity (3.0 METs), light to moderate activity (4.0 METs), moderate activity (5.0 METs), moderate to high activity (6.0 METs), and high activity (7.0 METs). A total physical activity (MET) score was calculated by the hours spent on the activities multiplied by the corresponding MET values and summed up.
Biochemical measurements
Blood samples were collected in the morning in a fasting state. Plasma levels of ionized calcium, intact parathyroid hormone (PTH), TSH, free T3, free T4, and TRAb were measured by standard methods on an automated analyzer (Cobas 6000; Roche Diagnostics GmbH, Mannheim, Germany). Plasma 25OHD levels were determined by isotope dilution liquid chromatography tandem mass spectrometry, as previously reported (15).
Statistical analyses
According to the sample size calculation, 53 participants in each study group would be required to show a 20% difference between groups in maximum voluntary strength at knee extension (90°) with a statistical power of 80% at a significance level of 0.05. This was based on a previous study of adults, where the mean maximum voluntary force at 90% knee extension was 463 N with a standard deviation of 170 N (16).
The differences between groups were assessed using the Mann–Whitney U-test for continuous variables and the chi-square test for proportions. Associations were quantified by nonparametric correlation (Spearman's ρ). A general linear model was used to investigate the main effect of free T3, 25OHD, and ionized calcium on muscle strength, balance function, and functionality tests. IBM SPSS Statistics for Windows v24.0 (IBM Corp., Armonk, NY) was used for statistical analyses.
Results
In total, 55 patients newly diagnosed with Graves' disease were matched with 55 euthyroid controls. Descriptive data are shown in Table 1. Each group consisted of 10 men and 45 women. Patients were examined a median of 15 days (min–max: 3–78 days) after diagnosis and a median of 8 days (min–max: −2 to 34 days) after the start of antithyroid treatment. Self-reported median time range of symptoms prior to examination was 75 days (min–max: 18–827 days). There was no difference between the two groups in terms of age, body mass index (BMI), height, or weight. In general, there were no significant differences in premorbid diagnoses between groups (patients vs. controls: 27.3% vs 12.7%; p = 0.06). The most frequent reported diagnoses were hypertension (n = 9 Graves' disease patients and n = 6 controls; p = 0.405) and asthma/allergy (n = 4 Grave's disease patients and n = 1 control; p = 0.17). All other diagnoses were only reported in one or two patients in each group (data not shown).
Descriptive Data and Biochemistry in Patients with Graves' Disease and Euthyroid Controls
Data shown are median (interquartile range), unless otherwise specified. Significant differences between the groups are highlighted in bold.
N = 44.
BMI, body mass index; MET, metabolic equivalent; TSH, thyrotropin; TRAb, thyroid receptor autoantibodies; fT3, free triiodothyronine; fT4, free thyroxine; 25OHD, 25-hydroxyvitamin D, PTH, parathyroid hormone; SD, standard deviation.
At the time of investigation, patients were less active than controls measured by MET score (40 vs. 45 kcl/kg/h). As expected, there was a significant difference in the markers of thyroid function reflecting ongoing hyperthyroidism in the patients (low TSH, high free T3, free T4, and elevated TRAb). All control subjects had normal thyroid function.
Total 25OHD and PTH differed significantly between groups, with lower levels in the patients. However, median levels of 25OHD and PTH were within the reference range for both groups. Ionized calcium was significantly higher in patients (1.29 mmol/L) compared to controls (1.24 mmol/L).
Muscle strength
Muscle strength was significantly lower in patients compared to controls in all tested muscle groups except knee flexion at 60° (Table 2). Compared to controls, muscle strength was lowered in patients by 15% at hand grip, 31% at elbow extension, 23% at elbow flexion, 22% at knee extension at 90°, 16% at knee flexion at 90° and knee extension at 60°, and 13% at knee flexion at 60°. Overall, including both patients and controls, free T3 correlated significantly and inversely with muscle strength in all muscle groups except knee flexion at 60° (Table 3). When investigating the patients and controls separately, the only thyroid biomarker that significantly correlated with muscle strength was TRAb in patients (knee extension and flexion at 90° and knee extension at 60°; ρ = −0.3, p < 0.05; data not shown). Decreased physical activity (MET) score at diagnosis was significantly associated with reduced muscle strength at all sites except for knee extension and flexion at 60° (data not shown).
Muscle Function Measured as Maximum Voluntary Muscle Strength (N) and Maximum Force Production (N/s) in Patients with Graves' Disease and Euthyroid Controls
Data shown are median (interquartile range). Significant differences between the groups are highlighted in bold.
N = 52.
Bivariate Correlation Analyses (Spearman's Rho) Between fT3, Plasma Levels of 25OHD and Ionized Calcium, Muscle Strength, Postural Stability, Timed-Up-and-Go Test, and Repeated Chair Stand Test
Significant correlations are highlighted in bold.
N = 104.
In the patient group, an inverse correlation was found between time since first symptom and maximum muscle strength in all investigated muscle groups (ρ = −0.3 to −0.5, p < 0.05). No associations with time since diagnosis were seen (data not shown).
In all participants, the inverse correlation between free T3 and muscle strength remained significant at elbow extension and flexion and knee extension at 90° after adjustment for plasma levels of ionized calcium and 25OHD (Table 4).
General Linear Model Analyses on Predictors of Studied Indexes of Muscle Strength, Balance, and Functionality Tests
Mutually adjusted for effects of studied biochemical indices (plasma levels of free T3, 25OHD, and ionized calcium). Significance is highlighted in bold.
N = 104.
CI, confidence interval.
Plasma levels of ionized calcium correlated inversely with strength at knee extension and flexion at 90° and borderline significantly with handgrip strength and strength at elbow flexion (Table 3). No correlations were found in either the patient or control group on their own. However, in the patient group, a positive relationship between total 25OHD and hand grip strength remained (ρ = 0.35, p < 0.01).
Maximum force production
Maximum force production was only significantly reduced at elbow flexion (by 27%) and borderline significantly reduced at knee flexion at 90° (by 17%) in patients compared to controls (Table 2). No relationship was found between maximum force production in any of the investigated muscle groups and plasma levels of free T3, 25OHD, or ionized calcium (data not shown).
Postural stability
Figure 1 shows the results of the postural stability measurements. Patients had a significantly higher velocity moment than controls in all four positions, meaning a worse balance function.
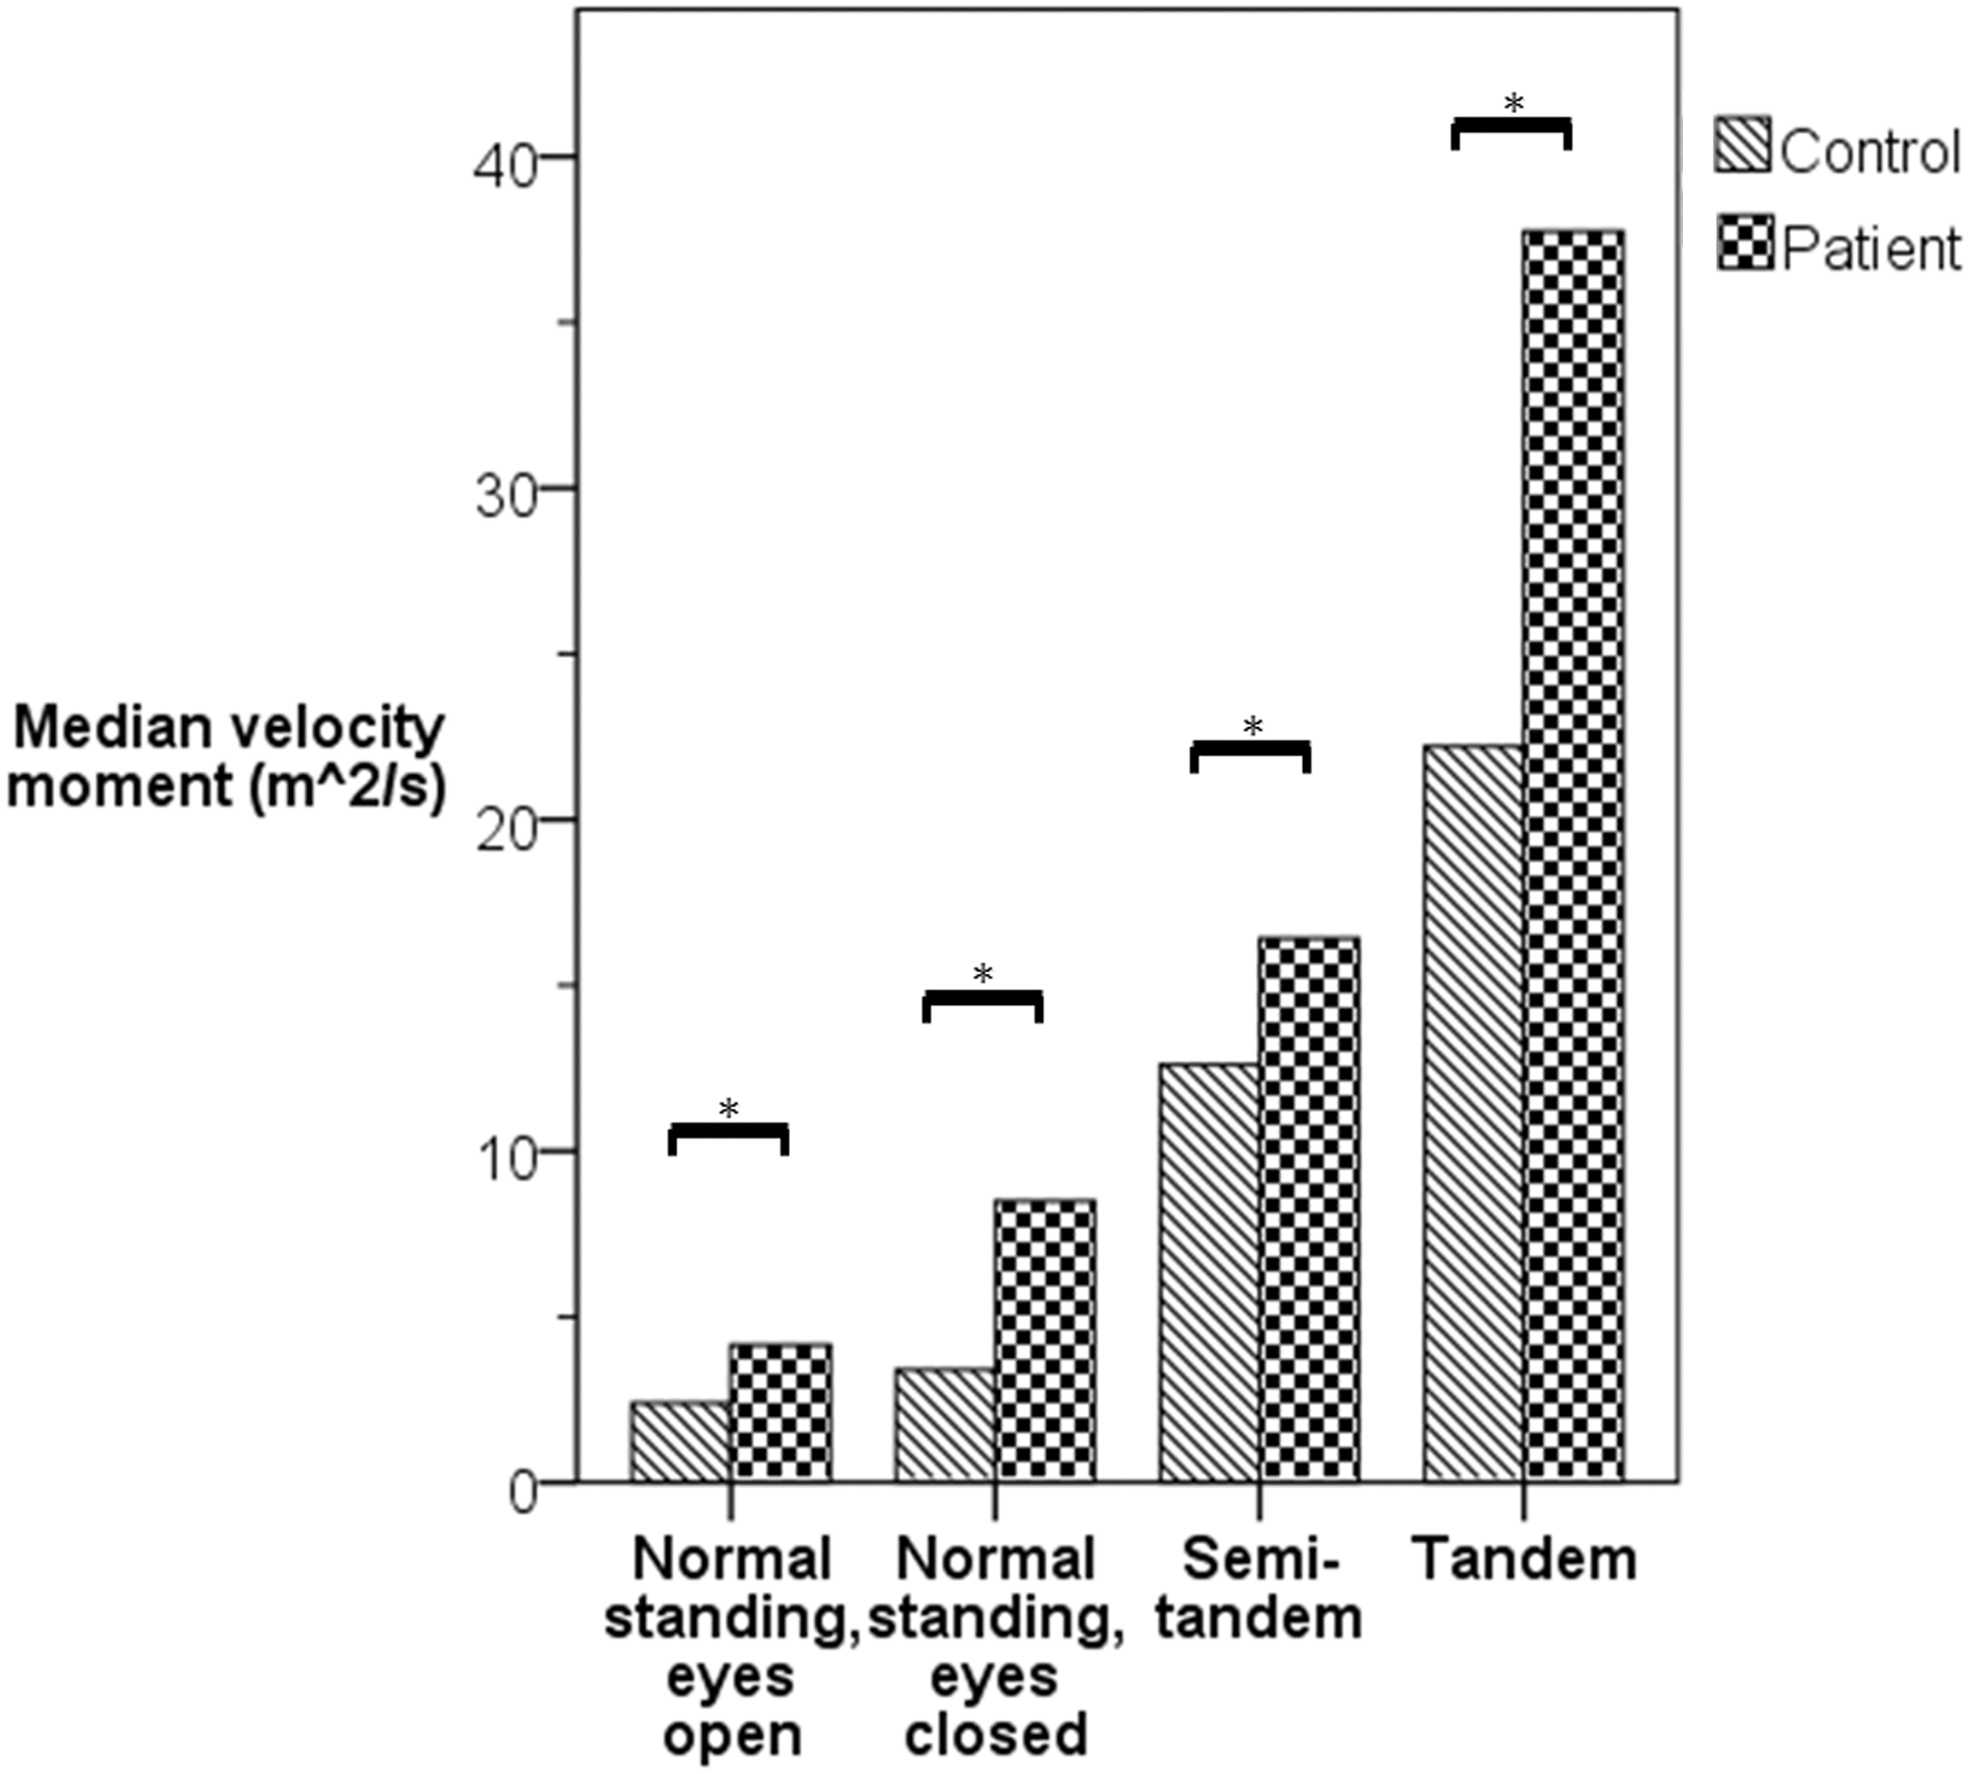
Balance function measured as velocity moment (m2/s) in patients versus controls. *p < 0.01.
Free T3 and ionized calcium correlated significantly with velocity moment at all positions, while 25OHD only correlated inversely and borderline inverse significantly with velocity moment at the position normal standing with eyes open (Table 3). After adjustments, only free T3 showed a significant correlation with postural stability at the normal standing with eyes open and at the semi-tandem position (Table 4). Physical activity score was not associated with postural stability.
Separating patients and controls, a positive correlation between free T3 and both normal standing with eyes open and closed was present in patients (ρ = 0.35, p < 0.01 and ρ = 0.33, p = 0.014, respectively) and controls (ρ = 0.47, p < 0.001 and ρ = 0.32, p = 0.016, respectively). TSH and the semi-tandem position correlated in controls (ρ = 0.27, p < 0.05). Patients also showed a positive correlation between ionized calcium and normal standing with eyes open and the tandem standing position (ρ = 0.27, p < 0.05).
The duration of symptoms did not correlate with balance function in any position, and time since diagnosis only correlated with velocity moment at semi-tandem standing (ρ = −0.3, p < 0.05; data not shown).
Muscle function tests
Patients performed both TUG and RCS tests slower than controls (Fig. 2). Plasma levels of free T3 and ionized calcium were significantly associated with the time spent on performing the TUG test, and free T3 levels correlated significantly with time spent on the RCS test (Table 3). The physical activity score was inversely associated with the TUG and RCS tests (ρ = −0.2, p < 0.05). Correlation analysis on patients and controls separately only showed a significant correlation between ionized calcium and the TUG test in controls (ρ = −0.3, p < 0.05). However, after mutual adjustment for plasma levels of free T3, ionized calcium, and 25OHD, none of the biochemical indices were significant predictors of findings from the two tests.
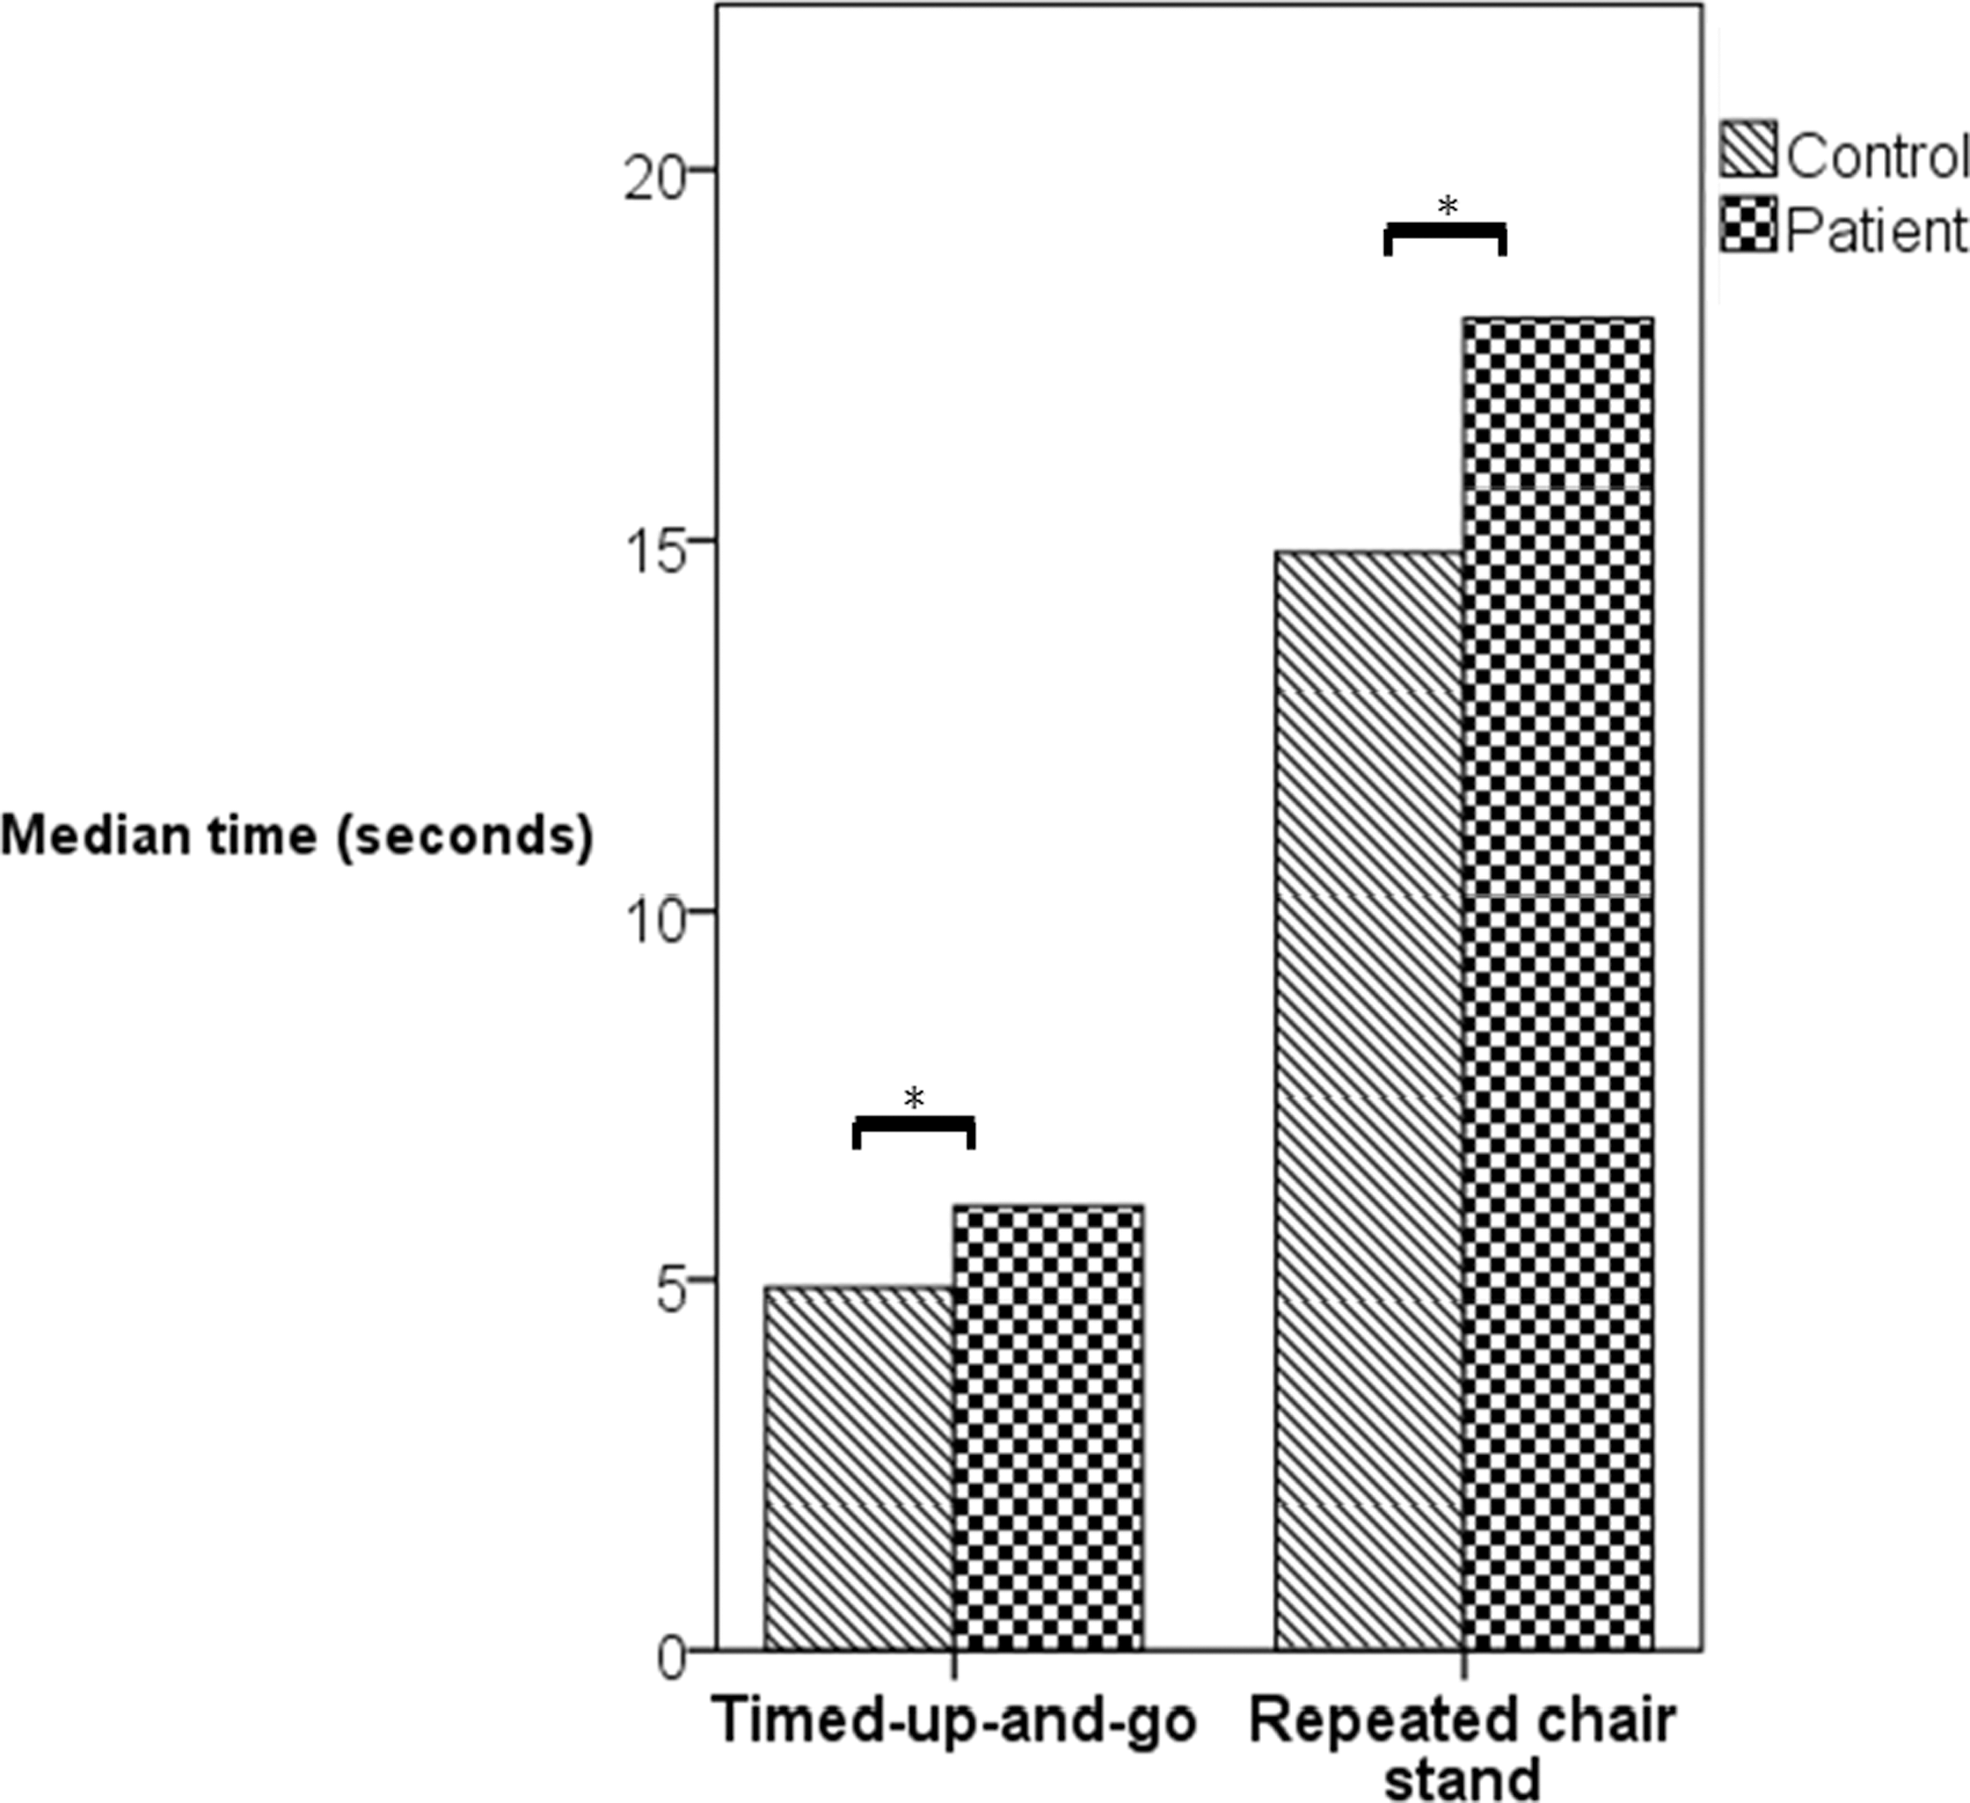
Median time for performing Timed-Up-and-Go and Repeated Chair Stand (s) tests in patients versus controls. *p < 0.01.
Discussion
This study shows that patients newly diagnosed with Graves' disease have significantly decreased muscle strength, with a reduction ranging from 13% to 31% compared to controls. In addition, patients with Graves' disease suffer from impaired balance and muscle function determined by muscle function tests. However, maximum force production did not differ between groups, suggesting that Graves' disease does not affect muscle responsiveness. The findings appear to be closely associated with plasma levels of free T3.
Brennan et al. (6) compared 30 patients with overt hyperthyroidism, 24 patients with subclinical hyperthyroidism, and 48 euthyroid controls. They found that both patient groups had decreased isometric and isotonic muscle strength at knee extension and knee flexion at both 60°/s and 180°/s. Moreover, the mid-thigh cross-sectional area as assessed by single-cut computed tomography was significantly reduced in both patients groups compared to euthyroid controls, suggesting a reduced muscle mass in patients with hyperthyroidism. Olson et al. (5) investigated 10 patients with Graves' disease and five euthyroid controls. They found that strength and endurance in hand grip and shoulder were significantly reduced in patients compared to controls. However, the euthyroid controls had a mean age of 25 years, while the mean age of the patients was 35.5 years, which could influence muscle strength and endurance. Riis et al. (8) found decreased muscle strength at the right arm and left thigh in seven patients with Graves' disease compared to the same patients in euthyroid state and to age- and sex-matched controls.
The present findings suggest a significant reduction in muscle strength in handgrip, flexion and extension over the elbow, and flexion and extension over the knee at 90°, as well as in knee extension at 60° in patients with Graves' disease compared to euthyroid controls. Moreover, TUG and RCS tests were performed significantly slower in Graves' disease patients, which could be due to decreased muscle strength in the thigh muscles. In a larger sample size, with matched controls and more extensive function tests, the study confirms these previous findings and gives an estimate of the impact of muscle impairments.
Not surprisingly, at time of investigation, patients were less active than controls, which may be due to their symptoms as well as advice from physicians. Therefore, a reduced MET score could be perceived as a marker of more severe disease. In line with this assumption, decreased physical activity was associated with decreased muscle strength at testing of the handgrip, in flexion and extension over the elbow, and in flexion and extension over the knee at 90°. Furthermore, it was associated with time spent on the TUG and RCS tests, whereas balance was not affected.
Increased free T3 correlated with reduced muscle strength and increased performance time in both TUG and RCS tests. The biochemical severity of hyperthyroidism is therefore a strong indicator of muscle performance. Excess thyroid hormones exert catabolic effects, and the duration of untreated hyperthyroidism is expected to cause muscle function to deteriorate. Though the onset of disease may be difficult to establish, an association was found between self-reported onset of symptoms and degree of muscle strength. The interpretation of time since diagnosis and association/lack of association with muscle performance is less straightforward, since time since diagnosis is in fact a mixture of effect of treatment and duration of disease.
No difference was found in maximum force production between the patients and controls except at elbow flexion. This indicates that patients can achieve their maximum muscle strength as fast as controls, even though the maximum force is reduced. In rats with induced hyperthyroidism, thyroid hormones can upregulate the fast switch myosin heavy chain IIA (MYH2) gene in slow-twitch muscles such as the soleus muscle (17). This could explain why there is no difference in the maximum force production between patients and controls in this study. The ability to react is the same in patients and controls. Thus, the impaired balance function may be the factor that increases the risk of falls and thereby potential fractures. Riis et al. (18) also found an increased amount of Ca2+-ATPase in the skeletal muscles of 11 hyperthyroid patients compared to their euthyroid state and compared to control subjects. Simultaneously, the slow type I muscle fibers transitioned to the fast type II muscle fibers, which could explain how the hyperthyroid muscles can achieve the same maximum force production as the euthyroid muscles but will be exhausted faster.
To the best of the authors' knowledge, this study is the first to investigate postural stability in patients with Graves' disease compared to controls. Significantly worse postural stability was found in the patient group compared to the euthyroid control group. As seen in muscle strength and functionality tests, increased T3 levels led to an increased velocity moment and thereby worse postural stability.
This study confirms the previously reported low plasma levels of 25OHD in Graves' disease compared to controls. No relationship was found between 25OHD and any measured muscle or balance performance. This is probably explained by the high median level of 25OHD (>50 nmol/L) considered to be a sufficient level. None of the studied subjects suffered from severe vitamin D deficiency.
Weight loss is a known symptom of Graves' disease. Surprisingly, no difference in body weight or BMI was found between patients and controls. This could be due to the short disease duration of included patients, as well as the age of the patients. Weight loss has been reported to be more predominant in the elderly compared to younger patients (19). Since the patients included in this study were relatively young (median age 39 years) weight loss might not be a very common symptom for this group of patients, leading to no difference between patients and controls. One study found that patients <20 years of age tended to have a body weight higher than the mean value of the general population (20). This may be due to an increased dietary intake during the onset of disease to compensate for increased requirements, as suggested by Conway et al. (19).
Strengths and limitations
To the best of the authors' knowledge, this is the largest study so far on muscle strength and postural stability comparing patients with Graves' disease to euthyroid controls. Each patient was carefully matched with euthyroid controls based on age and sex, which are indexes known to influence muscle strength and postural stability. Previous studies on this topic have had inhomogeneous patient cohorts or a lack of control groups.
The patients and controls were in general in good health, except that patients were suffering from Graves' disease. There was no significant difference in premorbid health conditions between groups (27.3% vs 12.7%; p = 0.06). Accordingly, it is not believed that the findings are explained by differences in health status prior to the study. Height, weight, or BMI were not matched, which also could have influenced the results. However, as body weight and BMI did not differ between patients and controls, it is not thought that the findings are attributable to such parameters. Finally, physical activity levels prior to the onset of Graves' disease and at an equivalent time point for controls were not assessed. Accordingly, it cannot be fully excluded that the findings (at least in part) may be attributable to differences in habitual levels of physical activity.
Conclusions and Future Studies
In conclusion, this study suggests that newly diagnosed hyperthyroidism caused by Graves' disease is associated with a 13–31% reduction in muscle strength, with poor postural stability, and reduced performance of functionality tests, but that muscle force reaction is unchanged.
These findings are clinically important and can be used as information to patients on limitations and risks in the early stage of the disease as impaired balance and decreased muscle strength may affect risk of falling.
Footnotes
Acknowledgments
This study received financial support from the Novo Nordic foundation.
Author Disclosure Statement
S.M. received a grant from the Lundbeck Foundation Clinical Research Fellowship for another project. B.J.B. is on the advisory board of Sanofi Denmark. No competing financial interests exist for the remaining authors.