
Abstract
Background:
Ultrasound (US) examination is helpful in the differential diagnosis of thyroid nodules (malignant vs. benign), but its accuracy relies heavily on examiner experience. Therefore, the aim of this study was to develop a less subjective diagnostic model aided by machine learning.
Methods:
A total of 2064 thyroid nodules (2032 patients, 695 male; M age = 45.25 ± 13.49 years) met all of the following inclusion criteria: (i) hemi- or total thyroidectomy, (ii) maximum nodule diameter 2.5 cm, (iii) examination by conventional US and real-time elastography within one month before surgery, and (iv) no previous thyroid surgery or percutaneous thermotherapy. Models were developed using 60% of randomly selected samples based on nine commonly used algorithms, and validated using the remaining 40% of cases. All models function with a validation data set that has a pretest probability of malignancy of 10%. The models were refined with machine learning that consisted of 1000 repetitions of derivatization and validation, and compared to diagnosis by an experienced radiologist. Sensitivity, specificity, accuracy, and area under the curve (AUC) were calculated.
Results:
A random forest algorithm led to the best diagnostic model, which performed better than radiologist diagnosis based on conventional US only (AUC = 0.924 [confidence interval (CI) 0.895–0.953] vs. 0.834 [CI 0.815–0.853]) and based on both conventional US and real-time elastography (AUC = 0.938 [CI 0.914–0.961] vs. 0.843 [CI 0.829–0.857]).
Conclusions:
Machine-learning algorithms based on US examinations, particularly the random forest classifier, may diagnose malignant thyroid nodules better than radiologists.
Introduction
The incidence of thyroid cancer has increased rapidly in recent years due to the more frequent use of imaging methods such as ultrasound (US) of the neck and fine-needle aspiration (FNA) of thyroid nodules (1,2). Approximately 20–67% of the general population is estimated to have thyroid nodules that cannot be detected by palpation (3). By 2030, thyroid cancer may become the second leading cancer diagnosis in women and ninth leading cancer diagnosis in men (4). Nevertheless, only 5–15% of thyroid nodules are malignant (5). Therefore, the major clinical challenge is to differentiate reliably those nodules that are malignant and need to be treated surgically from the majority of nodules that are benign and do not require surgery. This highlights the importance of diagnostic methods that can differentiate benign and malignant nodules.
Conventional US is the preferred imaging method for diagnosing thyroid diseases because it is noninvasive, convenient, and inexpensive, and it does not expose the patient to damaging radiation. However, US features show diagnostic sensitivity of only 27–63% for detecting nodule malignancy (6). This is due to the complex structure of thyroid nodules and the many features common to benign and malignant nodules. As a result, US for diagnosing malignant nodules remains highly subjective and strongly dependent on clinician experience. Efforts have been made to supplement US with assessment of nodule hardness using shear wave elastography (SWE) or real-time elastography (RTE) (7), but the added value of these techniques is controversial.
Among the possibilities available, US-guided FNA biopsy remains the most effective and practical test to determine whether a nodule is malignant or whether surgery is required for definitive diagnosis (8). However, FNA biopsy is ineffective in absolute terms. Its sensitivity ranges from 54% to 90%, its specificity ranges from 60% to 98% (9), and it fails to provide definitive diagnosis in 20–30% of patients whose cancer risk can be as high 75% (10), with repeat FNA yielding indeterminate results in 20–28% of cases (11,12). In addition, biopsying all patients with thyroid nodules is too burdensome. Improved diagnostic methods are needed for identifying malignant thyroid nodules that would be less subjective and more robust than conventional US and that would reduce the need for biopsy or diagnostic surgery.
It may be possible to develop a superior noninvasive diagnostic method by taking advantage of the ability of artificial intelligence to “learn” from clinical data sets and predict diagnoses, in some cases more accurately than human experts (13). Here, a machine learning classifier was developed and validated for identifying thyroid nodules that are likely to be malignant and that should therefore be biopsied. This system may reduce the risk of unnecessary diagnostic hemithyroidectomy for benign conditions, benefit further management of patients, and reduce health-care costs as well as psychological burden and risk for patients.
Methods
Ethics
This retrospective study was approved by the Ethics Committee of the First Affiliated Hospital of Jinan University, which waived the requirement for informed patient consent because data for all subjects were anonymized.
Patients and nodules
A total of 4765 consecutive patients with 4989 thyroid nodules who underwent hemi- or total thyroidectomy at the authors' institution between April 2011 and June 2016 were screened for inclusion in this retrospective study. Patients were included if they met the following inclusion criteria: (i) greatest nodule diameter ≤2.5 cm, (ii) no previous surgery or US-guided percutaneous thermotherapy, and (iii) conventional US examination and RTE within one month before thyroidectomy. RTE is typically not performed at Guangdong Provincial People's Hospital if the nodules are close to the trachea, if the nodules protrude above the surface of the thyroid gland, or if the RTE pressure indicator shows <3 or >4. Patients were excluded from the study if (i) they had coalescent thyroid lesions that were not clearly distinguishable or (ii) pathology provided ambiguous diagnostic findings for their nodules. In addition, duplicate nodules, defined as those sharing the same features by US and RTE, were removed from the data set to satisfy the requirement for machine learning that all observations be independent of one another (14).
Conventional US assessment of thyroid nodules
All nodules were assessed using HI Vision 900, HI Vision Ascendus, and HI Vision Preirus color US units from Hitachi (Tokyo, Japan) equipped with 6–13 MHz linear probes. All patients were examined in the supine position, with the neck extended and a small pillow under the shoulders for better exposure of the lower thyroid margins. Scans of both thyroid lobes and isthmus were obtained in both transverse and longitudinal planes. Longitudinal and transverse images of the thyroid were obtained according to American College of Radiology accreditation standards, and images were recorded on PACS workstations (Landwind Healthcare, Shenhen, China). Thyroid radiologists with more than eight years of clinical experience performed and evaluated the US thyroid data. The following features were measured for each nodule: size, margin, shape, aspect ratio, capsule, hypoechoic halo, internal composition, echogenicity, presence of calcifications, vascularity on color Doppler, and cervical lymph node status. Static US features were reviewed by an independent radiologist with 17 years of experience in thyroid imaging. Nodule length corresponded to the long-axis measurement on a longitudinal scan, while width and thickness corresponded to the short-axis measurements on a transverse scan. Nodule size was divided into four categories according to maximum diameter in cm (≤0.5, 0.5–1.0, 1.0–2.0, 2.0–2.5). Shape was classified as regular or irregular. The aspect ratio (height divided by width on transverse views) was classified as ≤1 or >1. Internal composition was categorized in terms of the ratio of the cystic portion to the solid portion as solid (≤10% of the cystic portion), mixed (>10% and ≤90% of the cystic portion), or cystic (>90% of the cystic portion). Margins were classified as well-defined (smooth, microlobulated or spiculated) or ill-defined. Nodules were categorized as an-, iso-, hypo-, or hyperechoic based on healthy thyroid tissue as reference. The calcification pattern was categorized as microcalcification, which was defined as punctate echogenic foci of ≤2 mm with or without acoustic shadowing, and/or as macro-calcification, which was defined as a hyperechoic structure of >2 mm with acoustic shadowing. Vascularity was assessed as the presence or absence of blood flow on color Doppler. Hypoechoic halo was categorized as usual or unusual. In the latter case, the lesion was surrounded by an irregular or thick hypoechoic halo. Thyroid capsule was categorized as complete or incomplete. In the latter case, tumoral tissue extends beyond the contours of the thyroid gland and invades into adjacent structures. Cervical lymph node status was assigned as normal or abnormal based on US findings of calcification or cystic changes. Cervical lymph nodes (both central and lateral nodes) were considered enlarged when the aspect ratio was >0.5 without calcifications or cystic changes.
RTE assessment of thyroid nodules
RTE was usually performed by the same radiologists who performed conventional US, and RTE results were retrospectively reviewed by a radiologist with 17 years of experience. RTE results were considered to be reliable when they were obtained in the following way (15): (i) light compression was repeatedly applied at the skin above the targeted thyroid nodule; (ii) a square region of interest was defined with the targeted nodule in the center, the superior margin was set to include subcutaneous fat, and the inferior margin was set to include the longus colli muscle; and (iii) the pressure release index on the RTE instrument was maintained at 3–4. Elastic images that clearly reflected the hardness of tissues in each layer were considered of sufficient quality, and elastic images were captured during 3–5 seconds. Images were displayed in split-screen mode, with the conventional images on the right and the translucent color-scale RTE images superimposed on the conventional image on the left.
Each pixel of the elasticity image was colored on a 256-color scale according to the extent of strain. The scale ranged from red, indicating greatest strain (softest tissue), to blue, indicating no strain (hardest tissue). Lesion hardness was then assigned to one of five grades based on the Asteria criteria (16): grade 0, the lesion contained blue, green, and red areas, indicating predominantly cystic composition with a typical “mosaic” sign; grade I, the lesion area was uniformly green; grade II, >50% of the lesion area was green; grade III, 50–90% of the lesion area was blue; or grade IV, >90% of the lesion area was blue. Nodules assigned to grades 0–II were considered benign; those assigned to grades III–IV were considered malignant.
Machine-learning training
For each nodule, data were collected concerning 11 features in conventional US and one feature in RTE (Fig. 1). The ground truth was labeled at lesion level. Note that since the number of features in the data set is much smaller than the number of observations, the variable selection step was not considered, which is commonly used in high-dimensional data analysis for subsequent statistical analysis. Data set 1 covered the 11 US features; data set 2 covered these features as well as the RTE feature. The two data sets were entered into nine machine-learning algorithms: L2-logistic regression, linear discriminant analysis, random forest, kernel support vector machines, adaptive boosting, k-nearest neighborhood, neural network, naive Bayesian, and convolutional neural network (see Supplementary Methods for detailed descriptions). Using each of these algorithms, data were analyzed 1000 times after randomly dividing the entire sample of 2064 nodules into a training set and a validation set in a 3:2 ratio. Note that the performance of all the aforementioned methods relies on the choice of tuning parameters. The methods are trained via 10-fold cross-validation by using the training set and are evaluated by using the validation set. For example, the tuning parameter in k-SVM is determined by 10-fold cross-validation via a grid search, where the grid is set as {0.1 + 0.1 s: s = 0, …, 20}. For the RF method, the “tuneRF” function in R package “randomForest” was used, with the number of trees set to 500, and the number of variables randomly sampled was tuned as candidates at each split. For the k-NN method, the “trainControl” function in R package “caret” was used via a 10-fold cross-validation to choose the best k and so on. None of the authors have any affiliation with the artificial intelligence machine-learning algorithms tested.
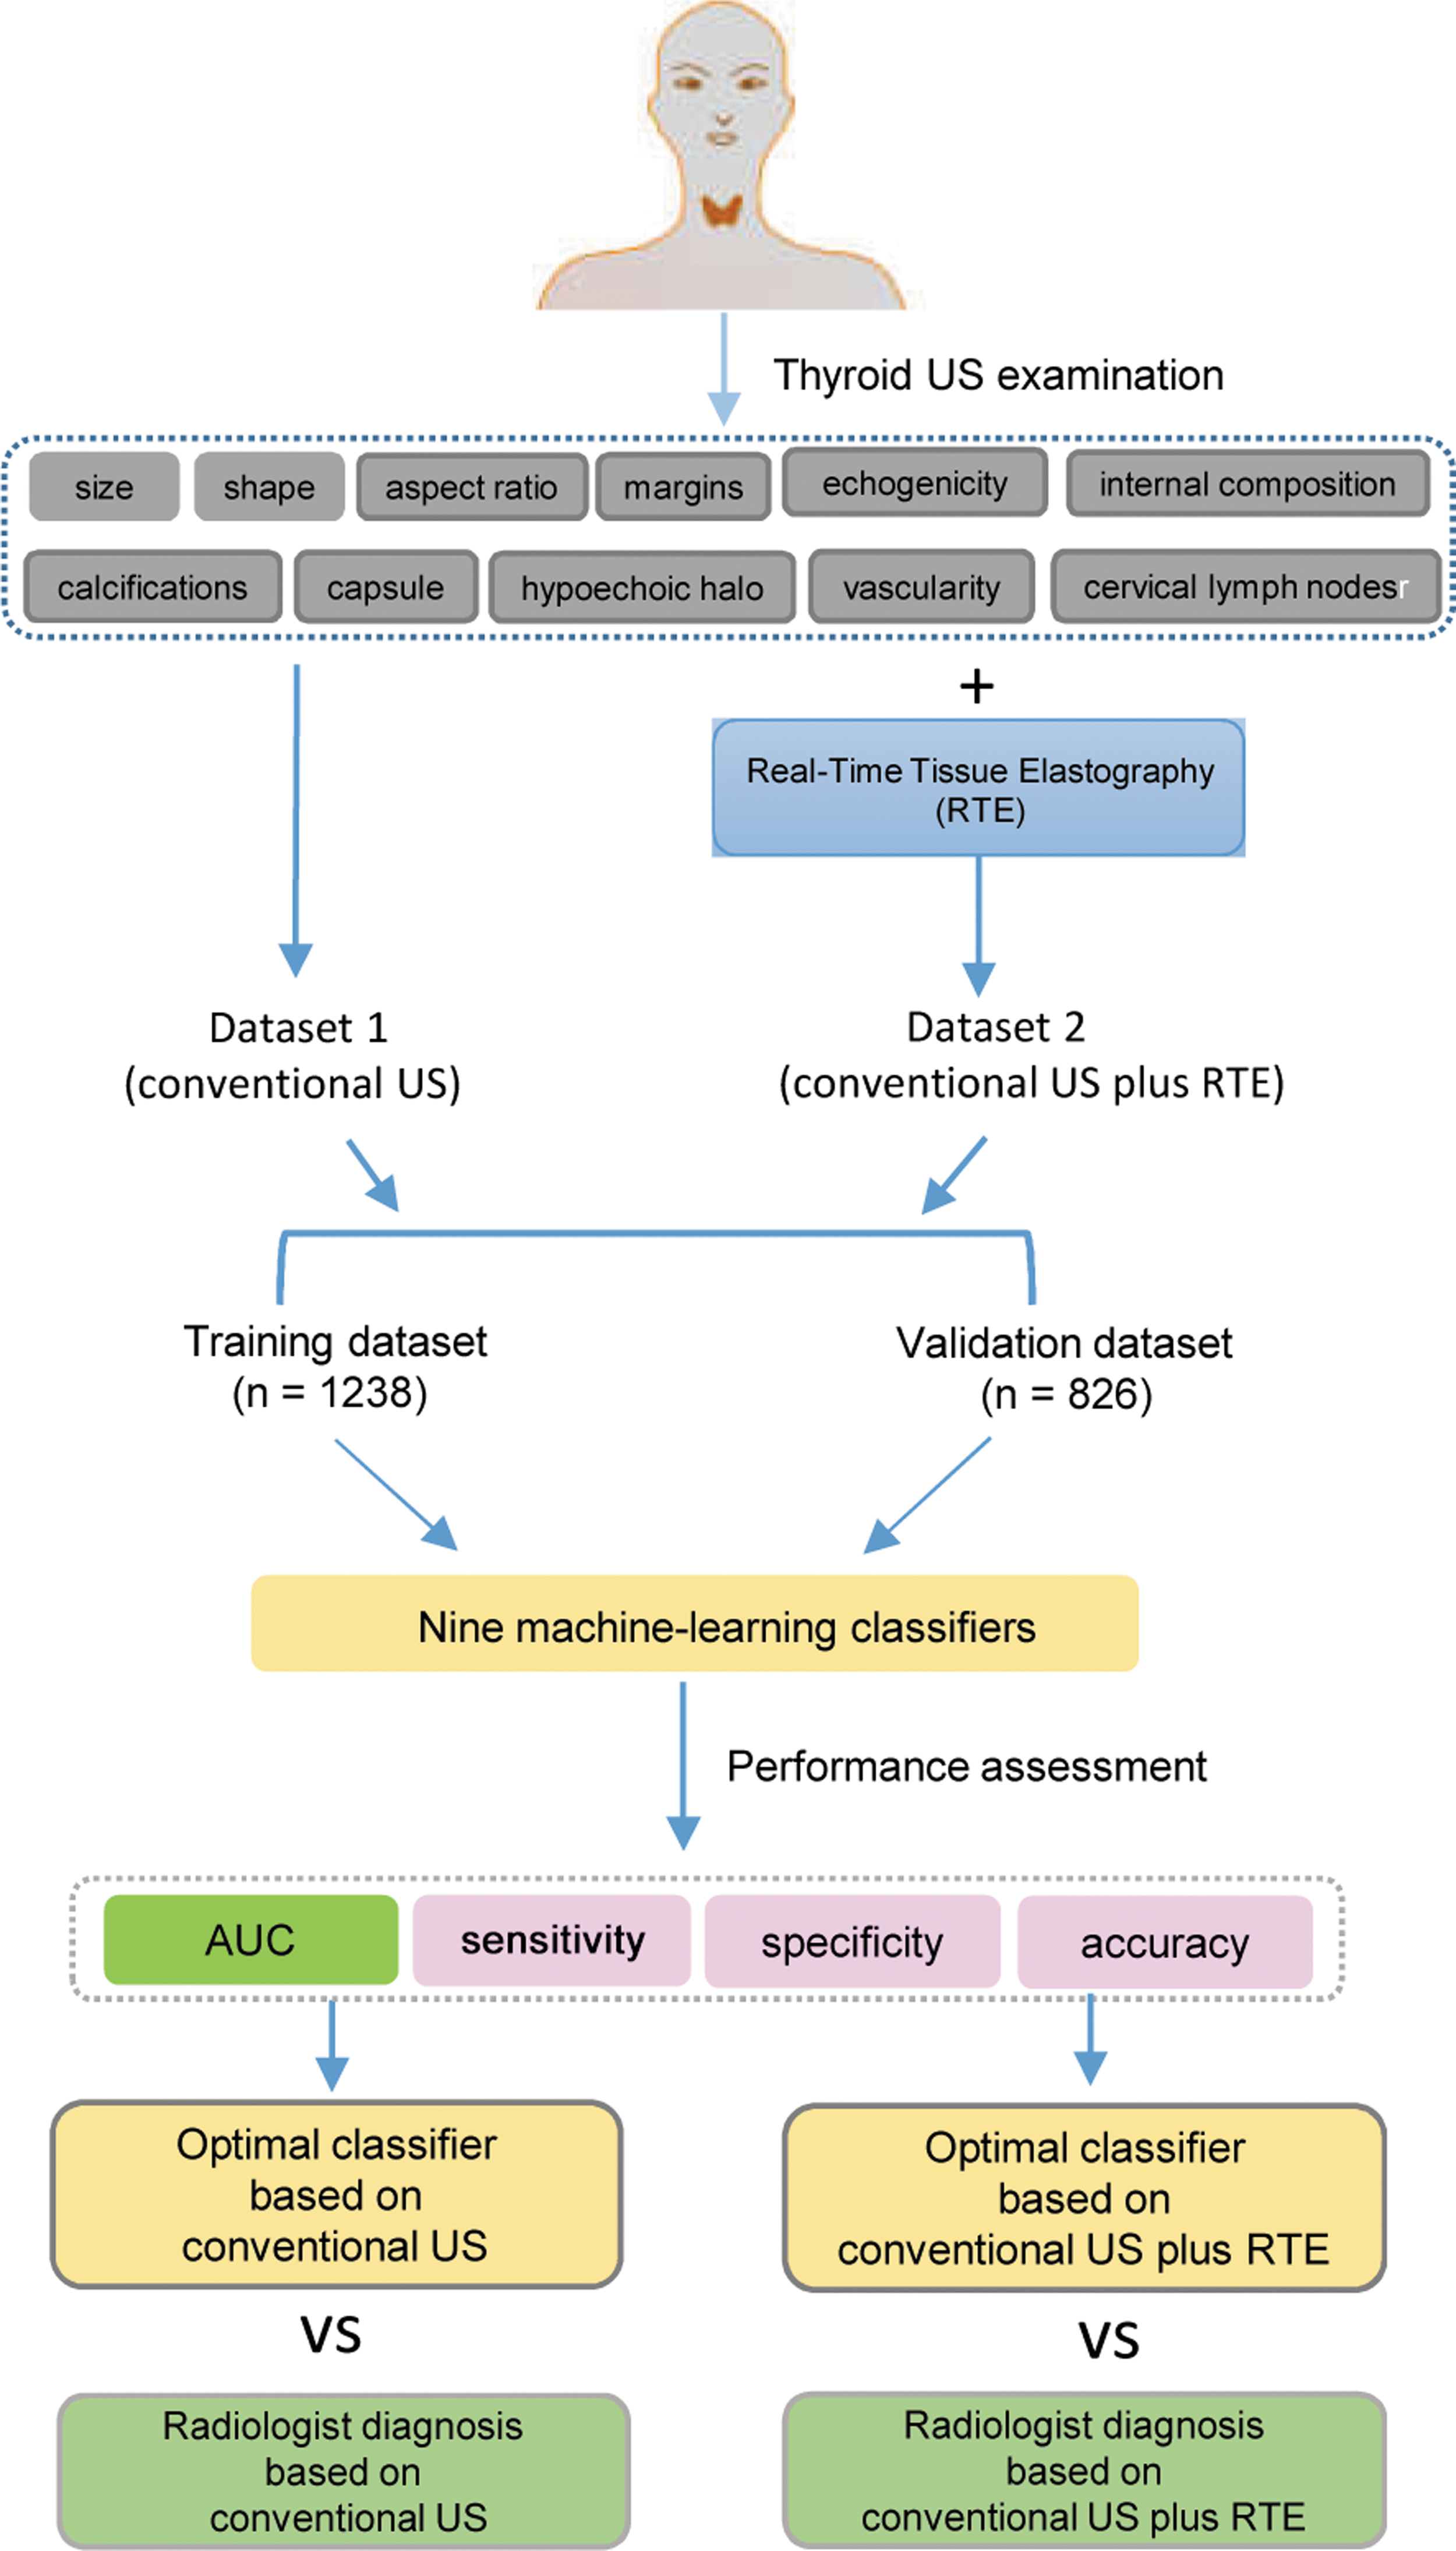
Study work flow.
Machine-learning validation and benchmarking
The nine machine-learning algorithms function with a validation data set that has a pretest probability of malignancy of 10%. The ability of the algorithms to diagnose thyroid nodules correctly as malignant or benign (based on pathology diagnosis as the reference standard) was compared in terms of area under the curve (AUC; Fig. 1). The best-performing algorithm was then compared to diagnosis by an independent radiologist as follows. Using a fixed random number seed to generate a subset of the data for this validation (model vs. radiologist) (17), the diagnostic performance of the best machine-learning algorithm was compared to diagnosis by a blinded radiologist based on (i) US features only or (ii) US and RTE features.
Statistical analysis
Data were analyzed using R v3.2.3 (R Foundation for Statistical Computing, Vienna, Austria), and the following R packages were used for each machine-learning algorithm (18): LibLineaR for L2-logistic regression, MASS for linear discriminant analysis, randomForest for random forest, e1071 for kernel support vector machines, adabag for adaptive boosting, knn for k-nearest neighborhood, nnet for neural network, e1071 for naive Bayesian, and mxnet for convolutional neural network. Differences in conventional US and RTE features between benign and malignant thyroid nodules were assessed for significance using the chi-square test. The significance level was set at p < 0.05 with Bonferroni correction.
Results
Nodule characteristics
A total of 2064 nodules from 2032 patients (695 men) with a mean age of 45.25 ± 13.49 year (range 9–86 years) were included in the data analysis (Fig. 2). Of the 2064 nodules, 750 (36.3%) were found by pathology to be malignant and 1314 (63.7%) were found to be benign. Features of these nodules in conventional US and RTE are summarized in Table 1.
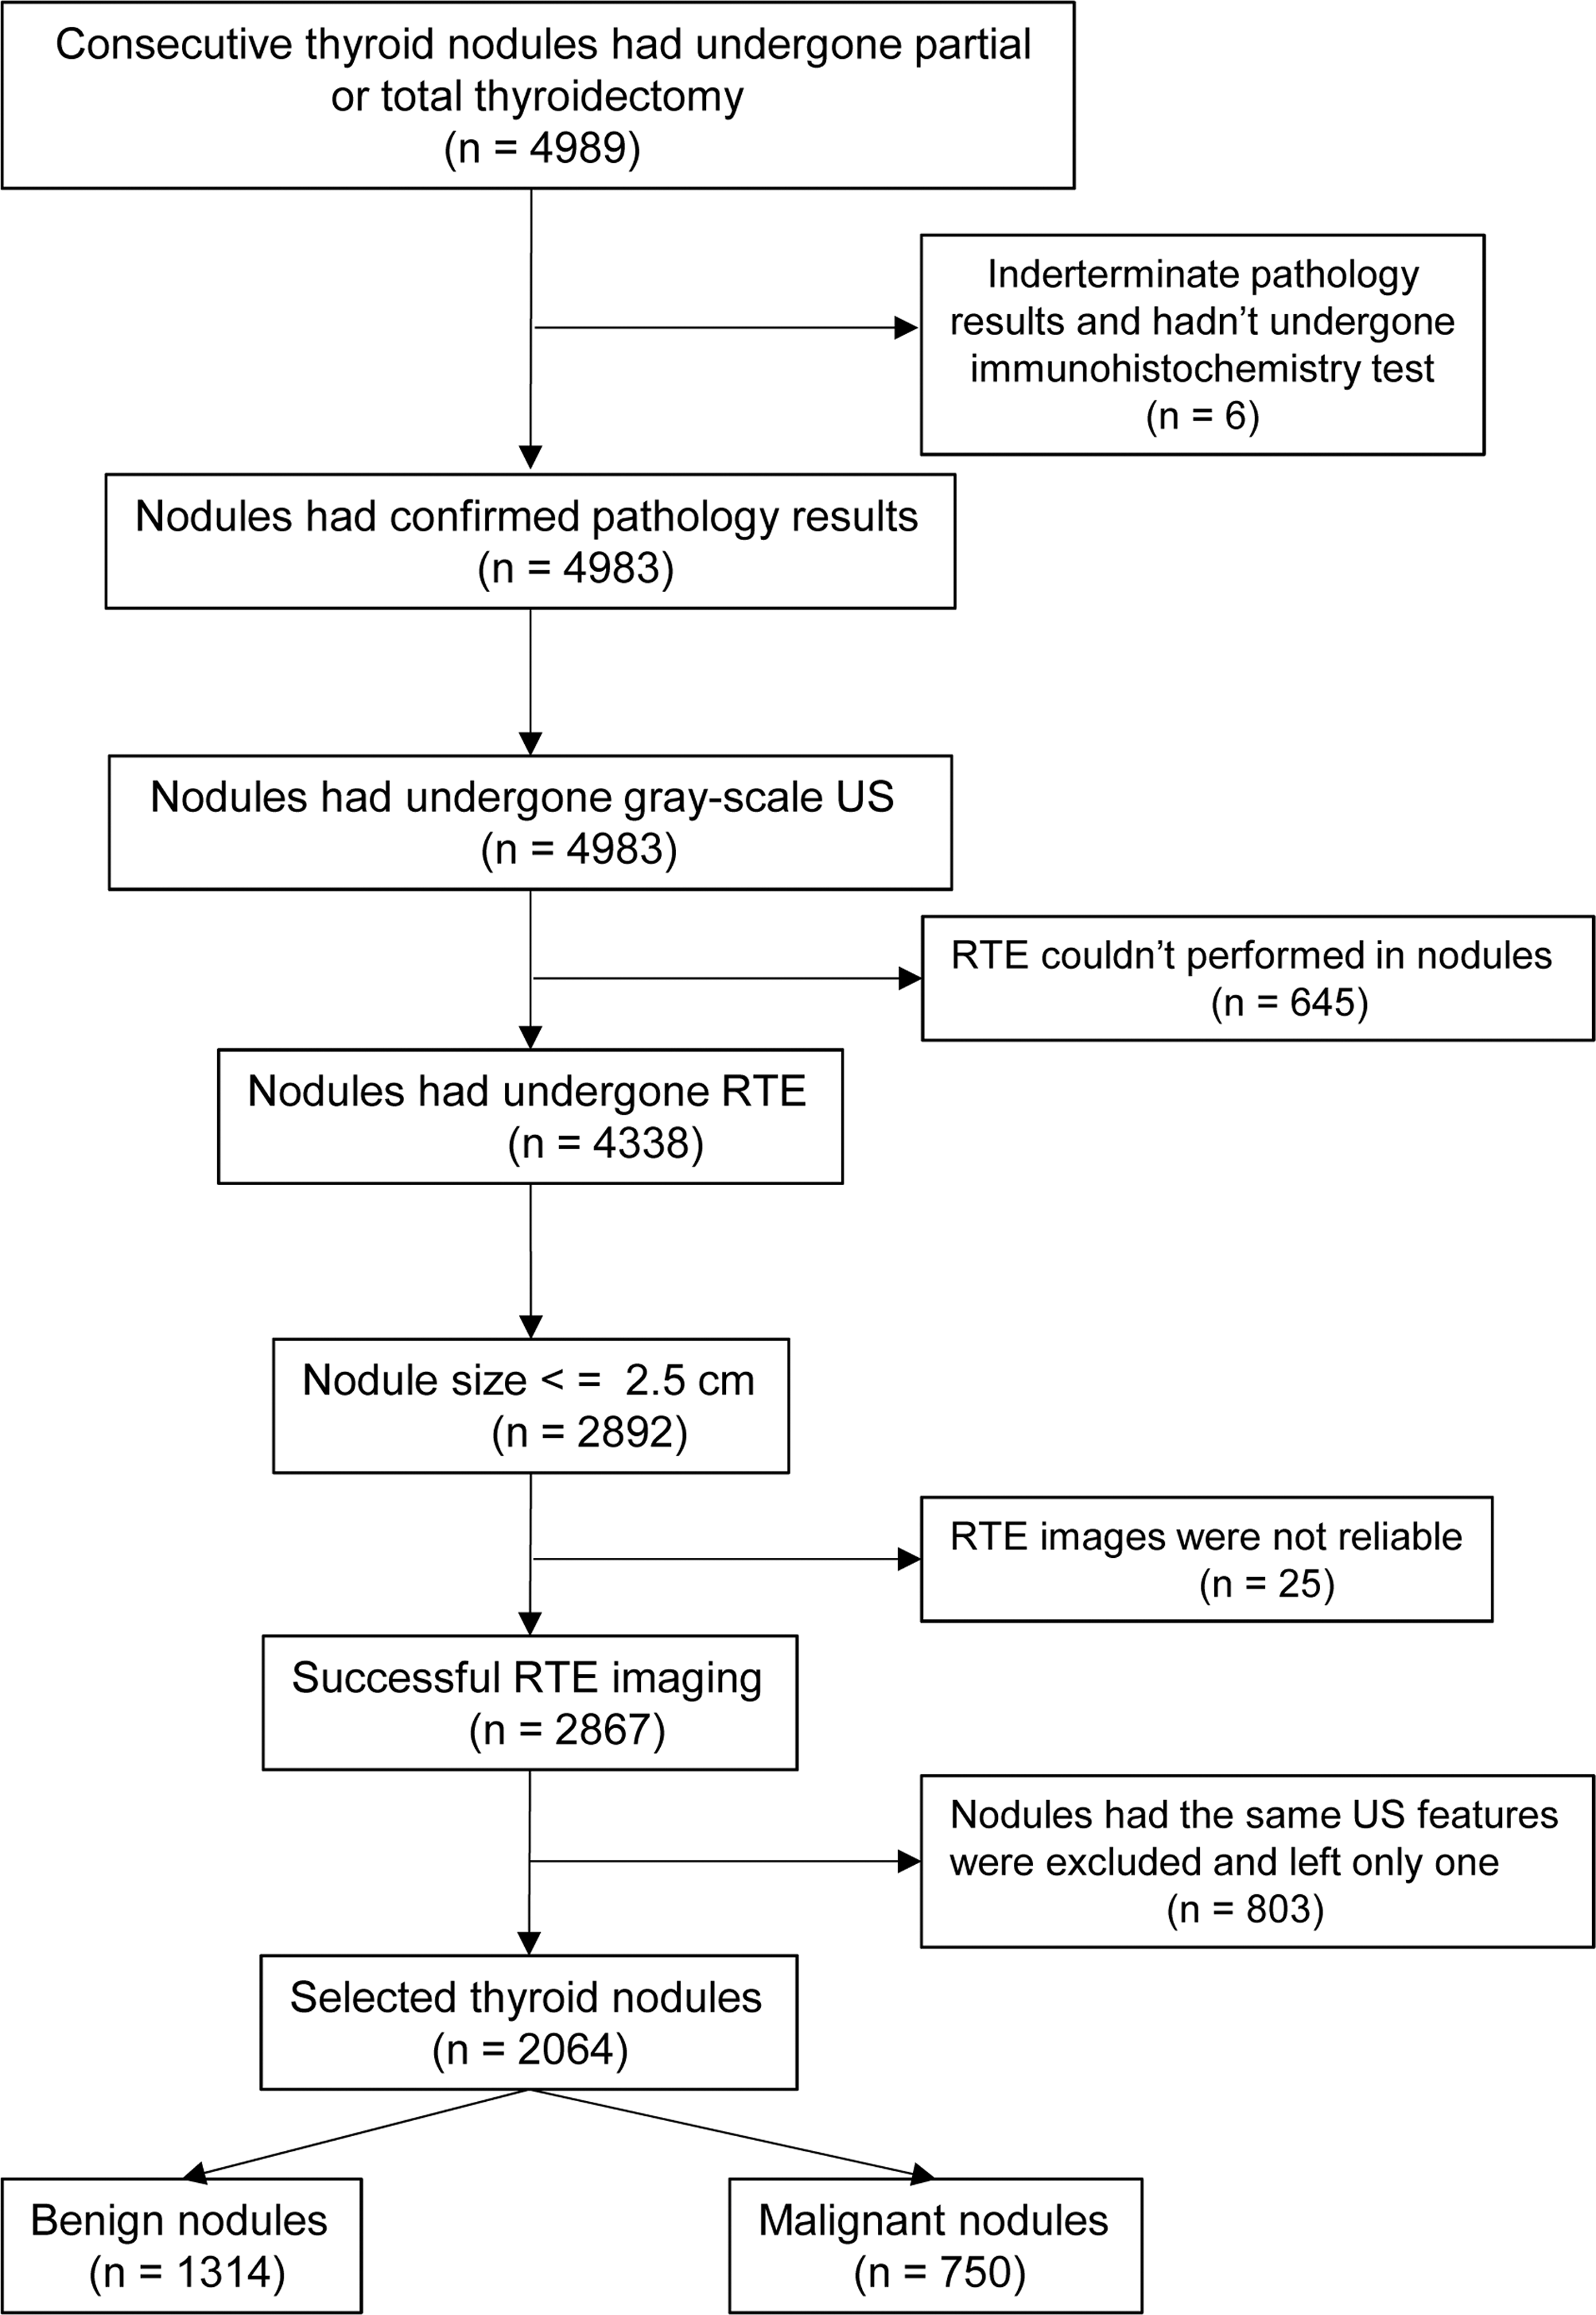
Flow diagram summarizing inclusion of thyroid nodules.
Comparison of Ultrasound and RTE Features of Benign and Malignant Thyroid Nodules
RTE, real-time elastography.
Selection of machine-learning model
The diagnostic performance of the nine machine-learning algorithms based solely on US features (data set 1) is shown in Table 2. In the validation data set, the random forest classifier demonstrated the highest values for AUC (0.924 [confidence interval (CI) 0.895–0.953]), sensitivity (88.1% [CI 81.3–95.0%]), specificity (84.2% [CI 80.9–87.5%]), and accuracy (84.6% [CI 81.6–87.5%]). Similarly, the random forest algorithm showed the best performance when the diagnosis was based on US and RTE features (data set 2, Table 3), showing the highest values for AUC (0.938 [CI 0.914–0.961]) and accuracy (85.7% [CI 83.6–87.8%]). The random forest classifier was second in sensitivity (89.1% [CI 82.5–95.8%]) to k-SVM (91.4% [CI 85.2–97.5%]) and also second in specificity (85.3% [CI 83.0–87.6%]) after AdaBoost (85.8% [CI 78.0–93.5%]). Therefore, the random forest algorithm was chosen as the best and compared to diagnosis by an experienced radiologist.
Comparison of the Performance of Nine Classifiers Based on Ultrasound Features Assuming a Pretest Probability of Malignancy of 10% in the Validation Data Set
Results are the mean [confidence interval] calculated relative to the pathology-determined diagnosis as the reference.
AUC, area under the curve; US, ultrasound; L2-LOG, L2-logistic regression; LDA, linear discriminant analysis, RF, random forest; k-SVM, kernel support vector machines; AdaBoost, adaptive boosting; Nnet, neural network; k-NN, k-nearest neighborhood; NB, naive Bayesian; CNN, convolutional neural network.
Comparison of the Performance of Nine Classifiers Based on Ultrasound and RTE Features Assuming a Pretest Probability of Malignancy of 10% in the Validation Data Set
Results are the mean [confidence interval] calculated relative to the pathology-determined diagnosis as the reference.
Factors affecting diagnostic performance of the random forest algorithm
The diagnostic performance of the random forest machine-learning algorithm based only on conventional US depended to the greatest extent on the following features: calcification pattern, hypoechoic halo, cervical lymph node status, shape, and vascularity on color Doppler (Fig. 3A). All these features together with the RTE feature were the most important factors in the diagnostic performance of the random forest algorithm based on the combination of US and RTE data (Fig. 3B).
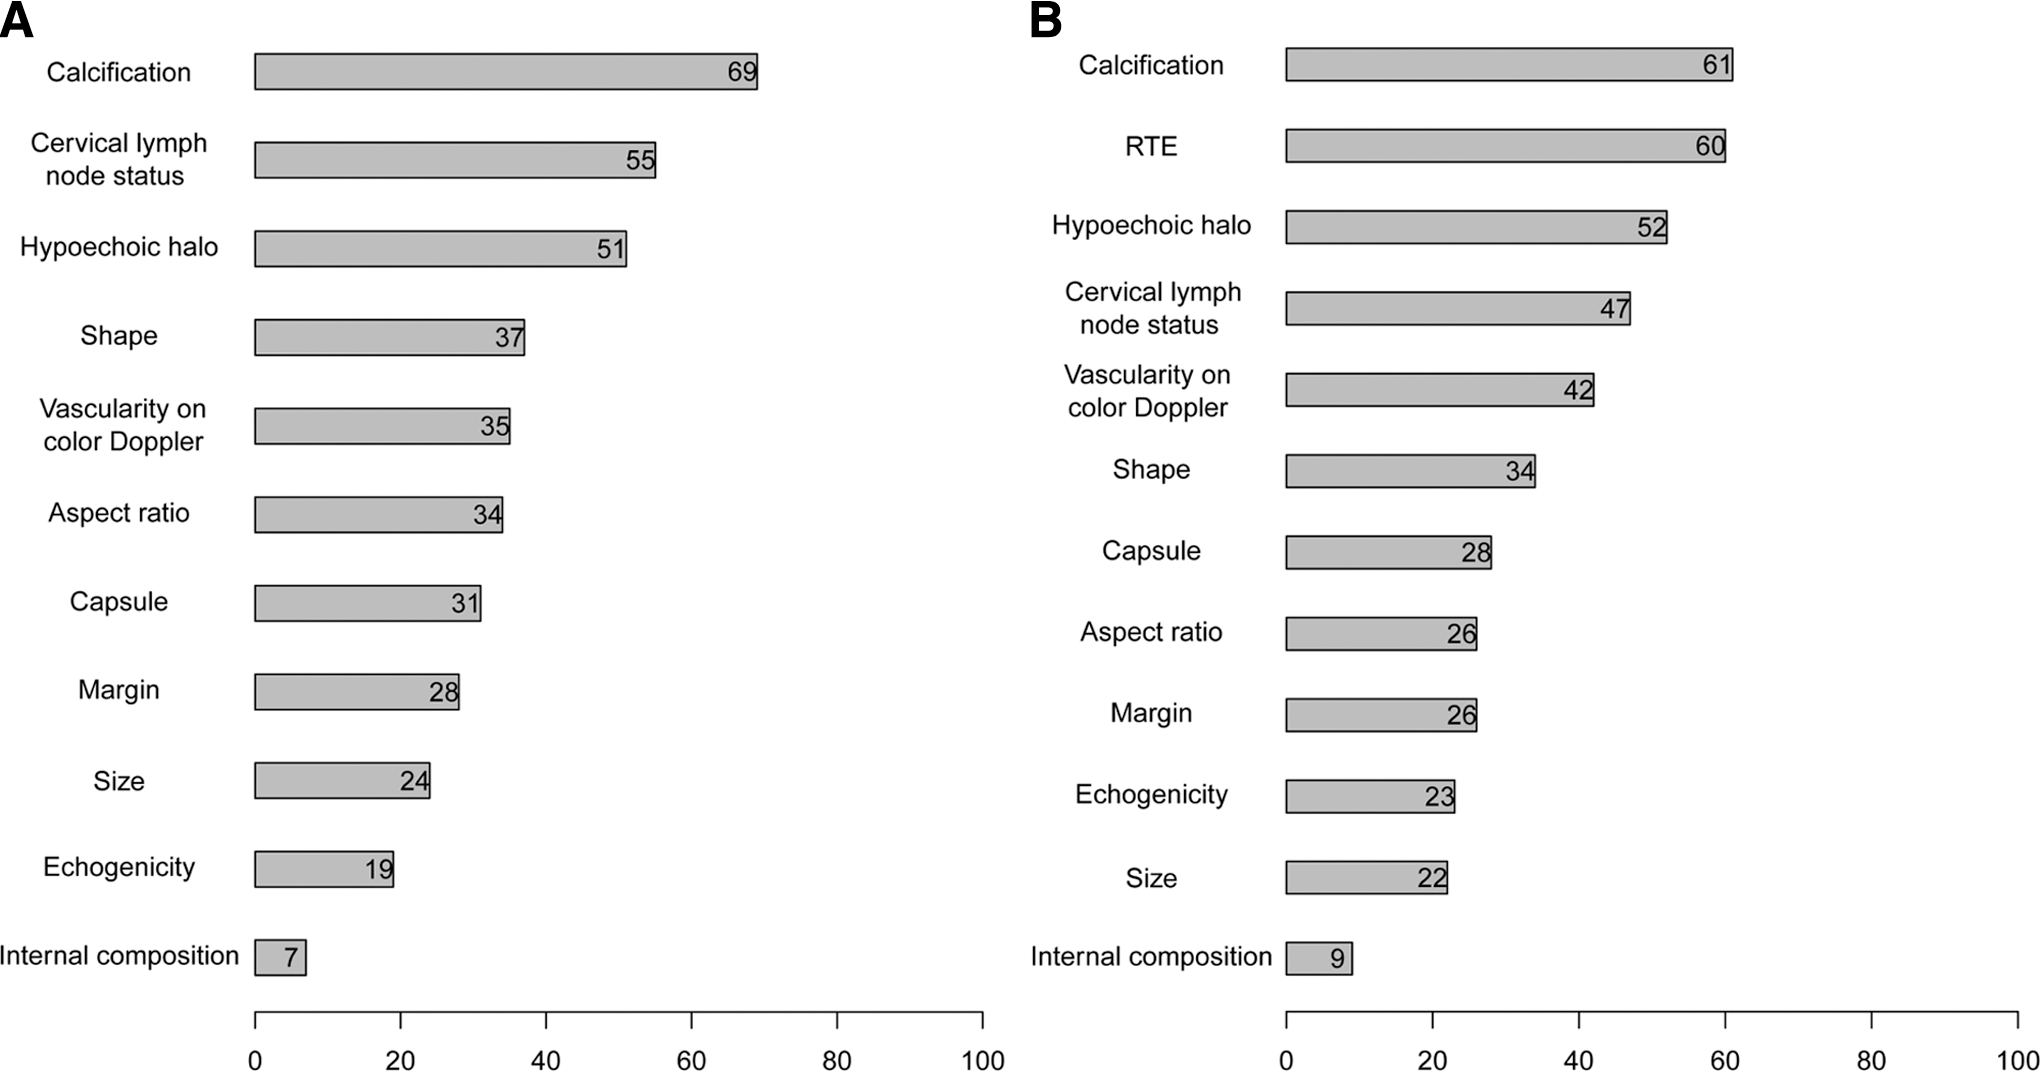
Relative importance of each input feature for the diagnostic performance of the random forest model. (
Added value of RTE for diagnosis based on the random forest algorithm or a radiologist
Adding RTE to conventional US resulted in better differentiation of malignant and benign thyroid nodules than conventional US alone (Table 4). This was true for diagnosis performed by a radiologist, as measured in terms of AUC (0.843 [CI 0.829–0.857] vs. 0.834 [CI 0.815–0.853]), sensitivity (85.0% [CI 83.0–87.0%] vs. 83.5% [CI 80.0–86.6%]), specificity (83.6% [CI 81.8–85.4%] vs. 83.2% [CI 80.9–85.5%]), and accuracy (84.1% [CI 82.7–85.5%] vs. 83.3% [CI 81.5–85.2%]). It was also true for diagnosis performed by the random forest algorithm, as measured in terms of AUC (0.938 [CI 0.914–0.961] vs. 0.924 [CI 0.895–0.953]), sensitivity (89.1% [CI 82.5–95.8%] vs. 88.1% [CI 81.3–95.0%]), specificity (85.3% [CI 83.0–87.6%] vs. 84.2% [CI 80.9–87.5%]), and accuracy (85.7% [CI 83.6–87.8%] vs. 84.6% [CI 81.6–87.5%]).
Comparison of the Performance of the Random Forest Classifier with Diagnosis by an Experienced Radiologist
Results are the mean [confidence interval] calculated relative to the pathology-determined diagnosis as the reference.
Online diagnostic system for differentiating malignant and benign thyroid nodules
The random forest diagnostic model described here is freely available online.
Comparison of diagnostic performance by the random forest algorithm and a radiologist
When the diagnosis was based only on conventional US, the random forest classifier performed better than an experienced radiologist (Table 4), as measured in terms of AUC (0.924 [CI 0.895–0.953] vs. 0.834 [CI 0.815–0.853]), sensitivity (88.1% [CI 81.3–95.0%] vs. 83.5% [CI 80.0–86.6%]), specificity (84.2% [CI 80.9–87.5%] vs. 83.2% [CI 80.9–85.5%]), and accuracy (84.6% [CI 81.6–87.5%] vs. 83.3% [CI 81.5–85.2%]).
When diagnosis was based on the combination of conventional US and RTE features, the random forest algorithm again outperformed diagnosis by a radiologist, as measured in terms of AUC (0.938 [CI 0.914–0.961] vs. 0.843 [CI 0.829–0.857]), sensitivity (89.1% [CI 82.5–95.8%] vs. 85.0% [CI 83.0–87.0%]), specificity (85.3% [CI 83.0–87.6%] vs. 83.6% [CI 81.8–85.4]), and accuracy (85.7% [CI 83.6–87.8%] vs. 84.1% [CI 82.7–85.5%]).
Discussion
Clinical and pathology data on 2064 thyroid nodules were retrospectively analyzed, and the data were used to train nine popular artificial intelligence-based machine-learning classifiers in an effort to identify which one would best differentiate between malignant and benign nodules. It was found that the random forest algorithm performed best and, in fact, outperformed diagnosis by a radiologist based on US alone and a combination of US and RTE. It is further shown that adding an RTE feature to conventional US features improved the diagnostic performance of the random forest classifier and the radiologist. These results demonstrate the feasibility of strengthening diagnosis of malignant thyroid nodules using machine learning. They also led to an online diagnostic tool being created that can guide diagnosis and clinical decision making.
Conventional US has proven quite useful for detecting clinically significant nodules that escape detection by physical examination. In fact, several studies recommend thyroid US for patients with suspected thyroid nodules. At the same time, this imaging approach is far from perfect. Although several conventional US features have been associated with increased risk of malignancies, no single US feature on its own can reliably differentiate malignant nodules from benign ones. A meta-analysis has shown that the sensitivity of most US features to thyroid nodule malignancy ranges from 27% to 63% (6). Four features—microcalcifications, central vascularization, irregular margins, and taller-than-wide shape—showed higher specificities of 78.0–96.6% (19). The 2015 American Thyroid Association management guidelines indicate that features with the highest specificities (median >90%) for thyroid cancer include microcalcifications, irregular margins, and an aspect ratio >1 (20). Central vascularization may not be an important feature for the diagnosis of malignancy. Up to 55% of benign nodules are hypoechoic compared to the thyroid parenchyma, making nodule hypoechogenicity less specific (20). In fact, most benign nodules with a size <1 cm usually appear hypoechoic (20). In this study, echogenicity played a relatively minor role because 39.0% of the benign nodules were also hypoechoic. Searching for such patterns is difficult for humans and dependent on their experience, leading several groups to apply machine-learning approaches such as extreme machine learning, deep convolutional neural networks, and artificial neural networks to thyroid nodule diagnosis (21,22). Two previous studies did not systematically explore which machine-learning classifier algorithms work the best (21,22). In the present study, comparison of nine algorithms identified the random forest classifier as the best. This classifier includes many decision trees, avoids high variance or bias in prediction, and is quite simple to implement efficiently and accurately.
RTE can differentiate malignant from benign thyroid nodules because malignant nodules are harder than the surrounding adjacent parenchyma (23 –27). Several meta-analyses suggest that RTE is superior to SWE for this purpose (28,29). Some studies, most of which involve small case series and few US features, have reported that RTE can complement US to improve diagnostic accuracy (30,31), whereas one study of 703 thyroid nodules found that using RTE led to lower diagnostic accuracy than using US alone (15). As a result, the added value with RTE remains under debate (32). The present much larger study provides strong evidence that RTE improves the performance of not only the experienced radiologist but also the random forest machine-learning algorithm.
The present work possesses advantages over several studies that have attempted to differentiate malignant and benign thyroid nodules using computer-aided diagnosis (CAD) systems on the basis of conventional US features (33 –35). Those CAD systems classify US features differently from the way radiologists do, whereas the present system examines the same features as radiologists. The present system examines a larger array of US features than previous CAD studies, and it incorporates complementary information from RTE. The machine learning–based tool for diagnosis of thyroid nodules described in this study was trained using what appears to be the largest data set so far.
Despite these strengths, the present study also has limitations. First, 705/750 (94%) thyroid malignancies in the data set were classical papillary thyroid carcinomas, which differ in US features from follicular carcinoma, medullary carcinoma, and lymphoma. This highlights the need to verify and extend the diagnostic model by incorporating more training data from various types of thyroid malignancies. Second, only nodules for which definitive pathology findings of malignant or benign were available were included. As a result, the diagnostic model still needs to be validated for nodules giving indeterminate cytology results and therefore characterized as “atypia of undetermined significance” or “follicular lesion of undetermined significance.” Third, thyroid radiologists reviewed static US images instead of dynamic images. Reviewing images dynamically or in real time, the reported US features would be more objective and reliable. At the Guangdong Provincial People's Hospital, radiologists with more than eight years of clinical experience in thyroid imaging performed the US in real time and described the key US features in the reports. To reduce potential bias of retrospective nature, the radiologists also checked the US reports. Fourth, we could not evaluate and compare the performance of machine-learning algorithms for each cancer subtype because most malignant nodules were papillary carcinomas. However, other subtypes such as follicular, Hürthle cell, or anaplastic carcinomas also have some different US features compared to benign thyroid lesions, and the algorithm was effective in the differentiation of these entities from benign thyroid lesions. Nevertheless, the diagnostic performance of the algorithm may be less efficient when applied to medullary carcinoma than other subtypes because it shares more US features with benign thyroid lesions. Finally, the data in the study came from a single center, which means that the system needs to be validated in other clinical settings.
In summary, the present results demonstrate that machine learning can lead to more reliable differentiation of benign and malignant nodules than what can be achieved by radiologists on the basis of US alone or combined with RTE.
Footnotes
Acknowledgments
This research was supported by a grant of the National Scientific Foundation of China (81571664, 81871323, 81801665), the Science and Technology Planning Project of Guangdong Province (2014A020212244, 2016A020216020), the Scientific Research General Project of Guangzhou Science Technology and Innovation Commission (201605110912158), the China Postdoctoral Science Foundation (2016M600145), and the Guangdong Grand Science and Technology Special Project (2015B010106008).
Author Disclosure Statement
No competing financial interests exist.
Supplementary Material
Supplementary Methods
Supplementary Figure S1