




Abstract
Background:
Energy metabolism is described to be deregulated in cancer, and the Warburg effect is considered to be a major hallmark. Recently, cellular heterogeneity in tumors and the tumor microenvironment has been recognized to play an important role in several metabolic pathways in cancer. However, its contribution to papillary thyroid cancer (PTC) development and metabolism is still poorly understood.
Methods:
A proteomic analysis of five PTC was performed, and the cellular distribution of several upregulated metabolic proteins was investigated in the cancerous and stromal cells of these tumors.
Results:
Tandem mass spectrometry analysis revealed the upregulation of many metabolism-related proteins, among them pyruvate carboxylase (PC). PC knockdown in thyroid cell lines alters their proliferative and motility capacities, and measurements of oxygen consumption rates show that this enzyme is involved in the replenishment of the tricarboxylic acid cycle. Immunostainings of several upregulated metabolic proteins show that thyroid cancer cells have an increased mitochondrial oxidative metabolism compared to stromal cells.
Conclusions:
PTC has a very active tricarboxylic acid cycle, continuously replenished by a PC-mediated anaplerosis. This is specifically observed in the tumor cells.
Introduction
Deregulated energy metabolism is one of the hallmarks of cancer, playing a crucial role in tumor development (1 –3). Tumor cells have high energy requirements to support many biosynthesis pathways and promote cell growth. The Warburg effect has for a long time been considered to be the major metabolic reprogramming in cancer. In this scheme, glucose uptake is increased, metabolized to pyruvate, and then transformed into lactate instead of entering the tricarboxylic acid (TCA) cycle, even when the level of oxygen is normal in the tumor microenvironment (4). This allows the oxidation of reduced nicotinamide adenine dinucleotide (NADH) produced by glycolysis into an oxidized nicotinamide adenine dinucleotide (NAD+) sustaining glycolytic flux (4,5).
For a few years, another concept has been emerging: the TCA cycle can maintain its functions and participate in the synthesis of energy and biosynthetic intermediates as metabolic precursors out of the mitochondria (6). In addition, the metabolism of cancer cells is influenced by the metabolic microenvironment of the tumor. Indeed, several studies have for example described the important role of cancer-associated fibroblasts (CAFs) in the majority of tumors (7). They contribute to tumor proliferation by exchanging cytokines, growth factors, or pro-angiogenic factors (8,9), but it is still unclear how they are involved in tumor metabolism. Recent studies showed that CAFs carry out aerobic glycolysis and release lactate in the tumor microenvironment (10), which then become available for oxidative mitochondrial metabolism sustaining the cancer cells (11). This model, named the “reverse Warburg effect,” allows resources to be exchanged between cells within tumors and defines CAFs as feeders of lactate, which is then transformed into pyruvate by oxidative tumor cells in order to replenish the TCA cycle.
The TCA cycle intermediate replenishment, or anaplerosis, is known to be carried out by two major pathways: (i) glutaminolysis, which consists of using glutamine, metabolized to glutamate by glutaminase (GLS), itself converted into α-ketoglutarate by glutamate dehydrogenase (GDH); and (ii) the carboxylation of pyruvate to oxaloacetate via adenosine triphosphate (ATP)-dependent pyruvate carboxylase (PC). In cancers, a compensatory relationship between GLS and PC has been demonstrated when cells deprived of glutamine switch to a glucose-dependent anaplerosis via pyruvate (12), and vice versa, intracellular lactate signaling promotes glutamine uptake that becomes the major substrate (13).
Thyroid cancer is the most frequent endocrine cancer in humans, and papillary thyroid carcinoma (PTC) represents up to 85% of all malignant thyroid tumors. PTC is usually biologically indolent and has an overall 5- to 10-year survival rate of 80–95%. Typical therapy consists of thyroidectomy followed by radioiodine treatment. Dedifferentiated PTC can display resistance to therapy. Several cancers have been metabolically characterized to define new therapeutic approaches using inhibitors against metabolic enzymes. For instance, Doherty et al. developed inhibitors against the lactate dehydrogenase (LDH) proteins, such as gossypol or galloflavin (14). Accordingly, characterizing the energy metabolism of PTC could offer an opportunity to treat more aggressive forms. For now, thyroid tumor metabolism has been poorly described but appears to vary according to histological subtype (15). An increased level of labeled glucose consumption by poorly differentiated thyroid tumors compared to differentiated tumors has been reported, with a strong correlation with the presence of BRAF mutations (16). Enhanced glucose metabolism was validated by the demonstration of overexpression of glucose transporters 1 and 3 (GLUT1 and GLUT3) and hexokinase 2 (HK2) in BRAF-mutated PTC (17,18). The expression levels of GLS and of GDH were also increased in BRAF-mutated PTC, suggesting an overall increase in glutamine metabolism (15).
On the other hand, the role of the tumor microenvironment is now recognized to play a major metabolic role in numerous cancers (19,20). However, its contribution to thyroid tumor development is still poorly described. The cellular heterogeneity of PTC resulting in part from the presence of CAFs has been characterized and revealed a positive correlation with tumor aggressiveness (21). Another study showed respective overexpression of monocarboxylate transporters 1 and 4 (MCT1 and MCT4) in cancer and stromal cells, each one being responsible of lactate transport across the plasma membrane (22).
In this study, a proteomic analysis of PTC was performed, which revealed an upregulation of a high number of metabolism-related proteins. First, the study focused on PC whose expression and functional role were studied in thyroid tumors and in thyroid cell lines. Then, the study was extended by investigating the expression and cellular localization of other metabolic enzymes. The data show that PTC has a very active TCA cycle, continuously replenished by a PC-mediated anaplerosis. This is specifically observed in the tumor cells.
Methods
Cell culture
The human thyroid cancer cell lines TPC1 (RET/PTC1 rearranged) and 8505C (BRAFV600E and TP53 mutated) (23), and HTori-3 (SV40-immortalized human thyrocytes) (24) were cultured in RPMI 1640 (+ L-glutamine +25 mM Hepes; Life Technologies, Carlsbad, CA) supplemented with 10% fetal bovine serum (FBS), 2% streptomycin/penicillin, and 1% amphotericin B (Life Technologies). The cells were grown at 37°C in a humidified atmosphere with 5% CO2 and 20% O2. Short tandem repeat (STR) analyses performed previously for TPC1 and 8505C cells (25) showed that they were identical to those published by Schweppe et al. (26). STR analysis of HTori-3 cells is provided in Supplementary Figure S1. Their genotype is identical to the STR profile of Nthy-ori 3-1, a subclone of HTori-3 (European Collection of Cell Culture-ECACC 90011609), except a heterozygosity detected for THO1. Moreover, these cells express TTF1 and PAX8, suggesting that they are of thyroid origin.
Thyroid tissue samples
Paired samples of normal and tumor thyroid tissues were obtained from patients undergoing surgery for PTC (n = 28). All the tissues were provided by the Anatomical Pathology Department of the J. Bordet Institute (Brussels, Belgium) where the diagnoses were made by pathologists. Five paired samples, containing at least 70% of tumor cells, were selected for tandem mass spectrometry (MS/MS) and transcriptomic analyses, and the remaining samples were used for validation. Tissue samples were embedded in OCT and directly stored at −80°C until processing. Paraffin sections were used for immunostaining (n = 6). Protocols were approved by the Ethics Committee of the J. Bordet Institute.
MS/MS analysis
Five PTC (classical variant) and their normal adjacent tissues were analyzed by mass spectrometry. All of them carried the BRAFV600E mutation, the most common mutation in PTC (relevant clinical data are provided in Supplementary Table S1). Protein extraction and analysis were performed at the proteomic platform of Professor Ruddy Wattiez (University of Mons), with the TripleTOF mass spectrometer (ESI sources). Proteins were identified with the UniProt database.
RNA purification
Total RNA was extracted from thyroid samples or from thyroid cell lines using a TRIzol Reagent kit (Invitrogen Carlsbad, CA) followed by purification on RNeasy columns (Qiagen, Hilden, Germany). RNA concentrations were spectrophotometrically quantified, and their integrity was verified using an automated electrophoresis system (Experion; Bio-Rad, Hercules, CA).
Affymetrix microarray hybridization
The five samples analyzed by mass spectrometry and three additional samples for which no proteins were available were analyzed by Affymetrix microarrays. RNA amplification, cDNA synthesis, and labeling were performed according to the manufacturer's instructions (Affymetrix, Santa Clara, CA). RNA (100 ng for each sample) from eight PTC and their normal, non-neoplastic adjacent thyroid tissues were hybridized on Affymetrix Human Genome U133 Plus 2.0 arrays. CEL file data were normalized by GCRMA (GenePattern). For each spot, data were expressed as the log2 ratio of fluorescence intensities from tumor and normal tissues.
Quantitative reverse transcription polymerase chain reaction for PC mRNA expression
RNA extraction from tissue samples and cell lines was carried out according to the manufacturer's instructions (Invitrogen, Carlsbad, CA). RNA samples were treated by “DNase I amplification Grade” and subjected to reverse transcription using “Superscript II RNase H Reverse Transcriptase.” PC mRNA expression was quantified on an Applied Biosystems 7500 Fast Real Time PCR with SyberGreen (Eurogentec, Liège, Belgium) using oligonucleotides designed with Primer Blast (forward sequence: 5′-GGC GAC GGC GAG GAG ATA G-3′, reverse sequence: 5′-GAG TAG ATG GCT ACG GTG CG-3′). NEDD8 and TTC1 mRNA expressions were used for normalization (27).
Protein extraction
Thyroid tissues or cells were lysed in Laemmli lysis buffer, supplemented by phosphatase and protease inhibitors (NaF, Vanadate, Pefabloc, Leupeptin and Tablet Roche Inhibitor 25 × ; Roche Applied Science, Penzberg, Germany). Protein extracts were denatured at 100°C for three minutes and then quantified by the PAR/IDCR method (Thermo Fisher Scientific, Waltham, MA).
Western blotting
Proteins samples (30 μg/well) were loaded on a 7.5% acrylamide gel and run for 90 minutes at 20 mA/gel. The proteins were transferred to a nitrocellulose membrane at 80 V for 90 min. The membrane was first blocked for one hour at room temperature in Odyssey/phosphate-buffered saline (PBS; v/v) and then incubated overnight at 4°C with the primary antibody (1:200 anti-PCB rabbit polyclonal antibody, sc-6702; Santa Cruz Biotechnology, Inc., Dallas, TX); 1:100 anti-PDHE1α mouse monoclonal antibody, sc-377092, Santa Cruz Biotechnology, Inc.; 1:5000 anti-GLS rabbit monoclonal antibody, ab156876; Abcam, Cambridge, United Kingdom) in the solution (Odyssey/PBS [v/v] + Tween 0.1%). After incubation for one hour in the dark at room temperature with the secondary antibody solution (Odyssey/PBS [v/v] + Tween 0.1% + SDS 0.001%), images were acquired using the Azure Biosystems C500.
Immunostainings
Immunohistochemical analyses were performed on 10 μm thick sections prepared from paraffin-embedded tissues. Expression of smooth-muscle actin was analyzed by pathologists from the J. Bordet Institute to distinguish CAFs from cancer cells. The sections were deparaffinized, rehydrated, treated with citrate buffer (10 mM, pH 6, 95°C, 1 hour) for antigen retrieval, and their endogenous peroxidase activity was blocked. The sections were then incubated with the primary antibody (anti-PCB; sc-67021; Santa Cruz Biotechnology, Inc.), anti-PDK (sc-28783; Santa Cruz Biotechnology, Inc.), anti-PCCB (ab96729; Abcam), anti-ECH1 (ab153720; Abcam), anti-GLS (ab156876; Abcam), anti-LDHA (ab47010; Abcam), anti-LDHB (sc100775; Santa Cruz Biotechnology, Inc.), anti-MCT1 (sc365501; Santa Cruz Biotechnology, Inc.), anti-MCT4 (Santa Cruz; sc50329), anti-PCK2 (Abcam; ab137580), and the detection was performed with the peroxidase AEC substrate (K3464, Dako, Glostrup, Denmark). The primary antibody (anti-PDHα1; sc-377092; Santa Cruz Biotechnologies, Inc.) was revealed by immunofluorescence using Alexa Fluor (594 nm). As negative controls, immunostainings were carried out in the absence of primary antibodies.
siRNA transfection
For transient gene knockdown, a PC-specific siRNA (siPC) sequence (s10089; Ambion, Inc., Foster City, CA) was transfected into different thyroid cell lines (TPC1, HTori-3, and 8505C) using lipofectamine RNAiMAX reagent according to manufacturer's instructions (Life Technologies). An unrelated, non-targeting, siRNA (siCTRL) sequence (4390843; Ambion, Inc.) was used as a negative control. Cells (2 × 10⁵/well) were seeded on six-well plates and transfected 24 hours later with 25 pmol siRNA. RNA and protein samples were prepared 48 and 72 hours post transfection, respectively.
Proliferation assays
The cell proliferation rate was assessed using the Click-It® Plus EdU Flow Cytometry Assay Kit (Thermo Fisher Scientific) according to the manufacturer's instructions. Briefly, cells (75,000 cells/well) were seeded onto 12-well plates 24 hours post transfection. After 48 hours, they were incubated for six hours with 10 μM 5,5-ethynyl-2′-deoxyuridine (EDU). After a final incubation with Alexa Fluor 488-containing buffer, EDU incorporation was analyzed by flow cytometry on the BD LSRFortessa™ cell analyzer.
Migration/invasion tests
Forty-eight hours post transfection, cells were incubated in a serum-free medium for 24 hours. They were plated in migration or invasion chambers (20,000 cells/chamber, 8 μm pore size; Corning Biocoat™ Matrigel Invasion Chamber Kit; Corning, Corning, NY), with 10% FBS in the lower chamber as a chemoattractant, and then incubated for 22 hours. Cells were removed from the upper part with a cotton swab, and cells that had crossed the membrane were stained with the Diff-Quick Stain Kit (Polysciences, Hirschberg, Germany), and five fields were counted on the ZOE cell imager.
Metabolic profiling
The oxygen-consumption rate (OCR) was measured using the Seahorse XF96 plate reader (Agilent Technologies, Santa Clara, CA). As mentioned above, the cells were routinely cultured in RPMI 1640. This medium contains 11.11 mM D-glucose. For respirometry experiments, cells (5000 cells/well on 96-well plates) were transfected as described above and then incubated (24 hours post transfection) in substrate-free Dulbecco's modified Eagle's medium (DMEM D5030; Sigma–Aldrich, St. Louis, MO) for 24 hours before OCR measurements. The following metabolic substrates were given to the cells at 10 mM per well one hour before measurements: glucose, lactate, pyruvate, or glucose + glutamine. Where indicated, cells were treated with 10 μM Bis-2-(5-phenylacetamido-1,2,4-thiadiazol-2-yl) ethyl sulfide (BPTES) to inhibit GLS activity. Substrate-induced OCR was evaluated by calculating the difference of OCR values before and after substrate addition in each experimental condition.
Statistical analyses
Results are expressed as the mean ± standard deviation with statistical parametric t-tests for in vitro experiments, and as the median ± quartiles with statistical nonparametric Mann–Whitney tests for in vivo experiments, of at least three independent experiments, unless otherwise noted. All statistical analyses were performed with GraphPad Prism v6.01 (GraphPad Software, Inc., La Jolla, CA). Sample sizes (n) are reported in the corresponding figure legends.
Results
MS/MS analysis reveals numerous metabolism-related proteins with deregulated expression
Five BRAF-mutated PTC and their normal adjacent tissue were analyzed by mass spectrometry. The clinical data, mutational status, and patient information are given in Supplementary Table S1. The analysis identified about 1100 proteins in paired tumor and normal tissues. Each protein was quantified by calculating the expression ratio in log2 (tumor/normal) and was selected if this ratio was ≥|1|. A total of 85 proteins showed deregulated expression in the five PTCs (Supplementary Table S2), SH3BP4 being the only one downregulated in all of them. Eighty-four proteins were upregulated, among which were several proteins involved in cellular energy metabolism. Proteins involved in the TCA cycle (SUGLG2, PDHA1, CS, and PC), in fatty acid β-oxidation (ACADVL, HADH2, DECR1, DCI, PCCA, and ECH1), in amino-acid degradation (AK2, LONP1, IVD, HIBADH, and HIBCH), in ATP production and oxidative stress protection (ATP5B, ATP5L, PRDX3, and SOD2), and mitochondrial membrane proteins (CH3CH3, VDAC1, and VDAC2) were identified.
The discovery of the upregulation of PC in PTC, implicated in the oxidative mitochondrial metabolism through its anaplerotic role in replenishing the TCA cycle, led to the exploration of the expression of other metabolic proteins in PTC (Fig. 1). Most of them showed increased protein levels. This was particularly striking for the TCA cycle enzymes. PTC-c appeared to be the most active in terms of metabolism. Indeed, all the investigated proteins were overexpressed at least twice in this sample. PGK1 was downregulated, but this was not verified in the four other PTC. PTC-a appeared as the less metabolically altered tumor, with a smaller number of deregulated proteins, especially for the glycolysis pathway. PTC-e was mainly altered in TCA cycle enzymes and in the “others” metabolic protein category, while glycolysis enzymes showed only a few deregulations. Although the low number of samples does not allow for sufficient statistical power, the data suggest there might be a correlation between the metabolic profiles and the TNM staging for each one of the PTC examined. For example, PTC-c, which is the most metabolically deregulated tumor, presented a TNM stage of pT4aN1a, while PTC-a was classified as pT1bN0 (Supplementary Table S1). Of course, this trend should be confirmed with a higher number of samples.
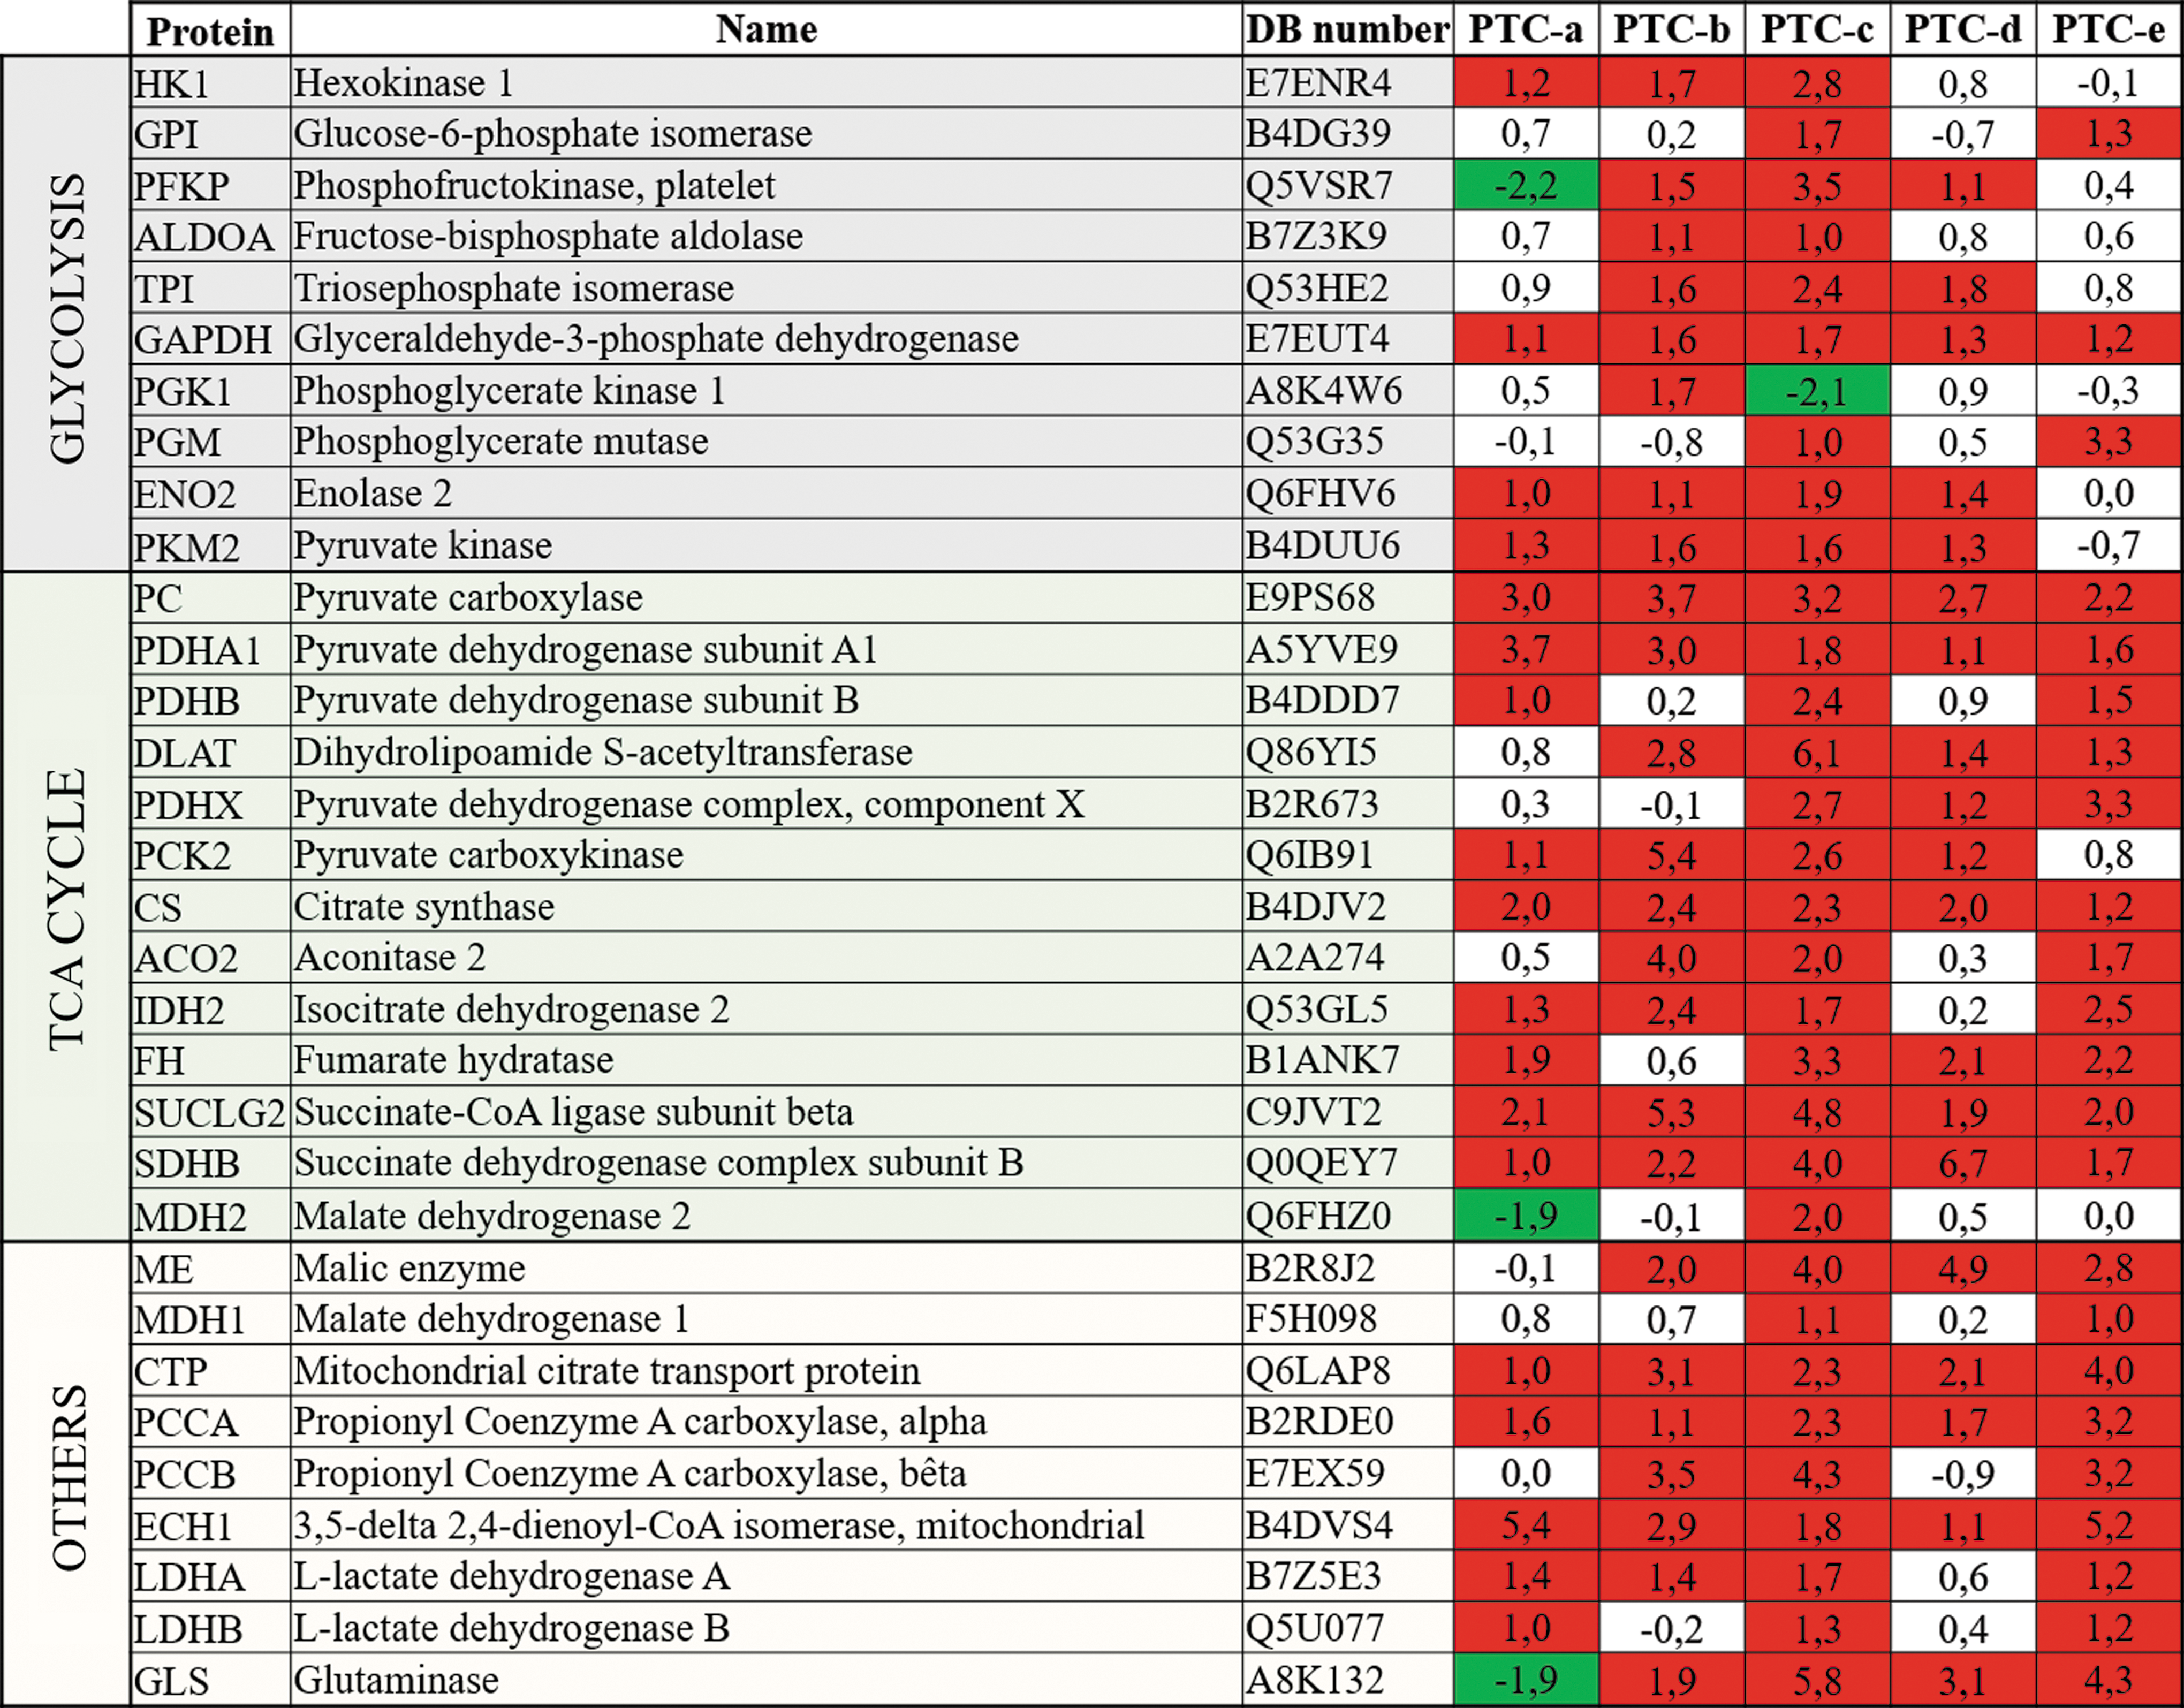
Protein expression levels of metabolic enzymes or proteins measured by tandem mass spectrometry (MS/MS) analysis, and presented in log2 of expression ratios (tumor/normal). DB number = accession number in Uniprot database. Cutoff of the expression ratios in log2 is 1 (red, expression level ≥1; green, expression level ≤–1). Color images are available online.
As a complementary approach to evaluate the expression pattern of metabolic proteins in PTC, Affymetrix gene expression analyses were performed on the same five PTC analyzed by mass spectrometry and on three additional PTC. A heat map of the mRNA levels for different metabolic proteins following Affymetrix microarray analysis is presented in Figure 2. There was no correlation between proteomic and transcriptomic expression levels. An overall increase in mRNA expression of genes encoding proteins involved in glycolysis and inversely an overall decrease in mRNA expression of genes encoding proteins of the TCA cycle were noticed, with some exceptions. For instance, PC mRNA was strongly overexpressed in the tumors and was even the most overexpressed mRNA among all the investigated genes. The mRNA of the enzymes from the “others” metabolic pathway category showed variable deregulated expression patterns, depending on the gene considered. This lack of correlation has already been reported and reflects different levels of regulation during protein synthesis, for example post-transcriptional, translational, or post-translational regulation (28).
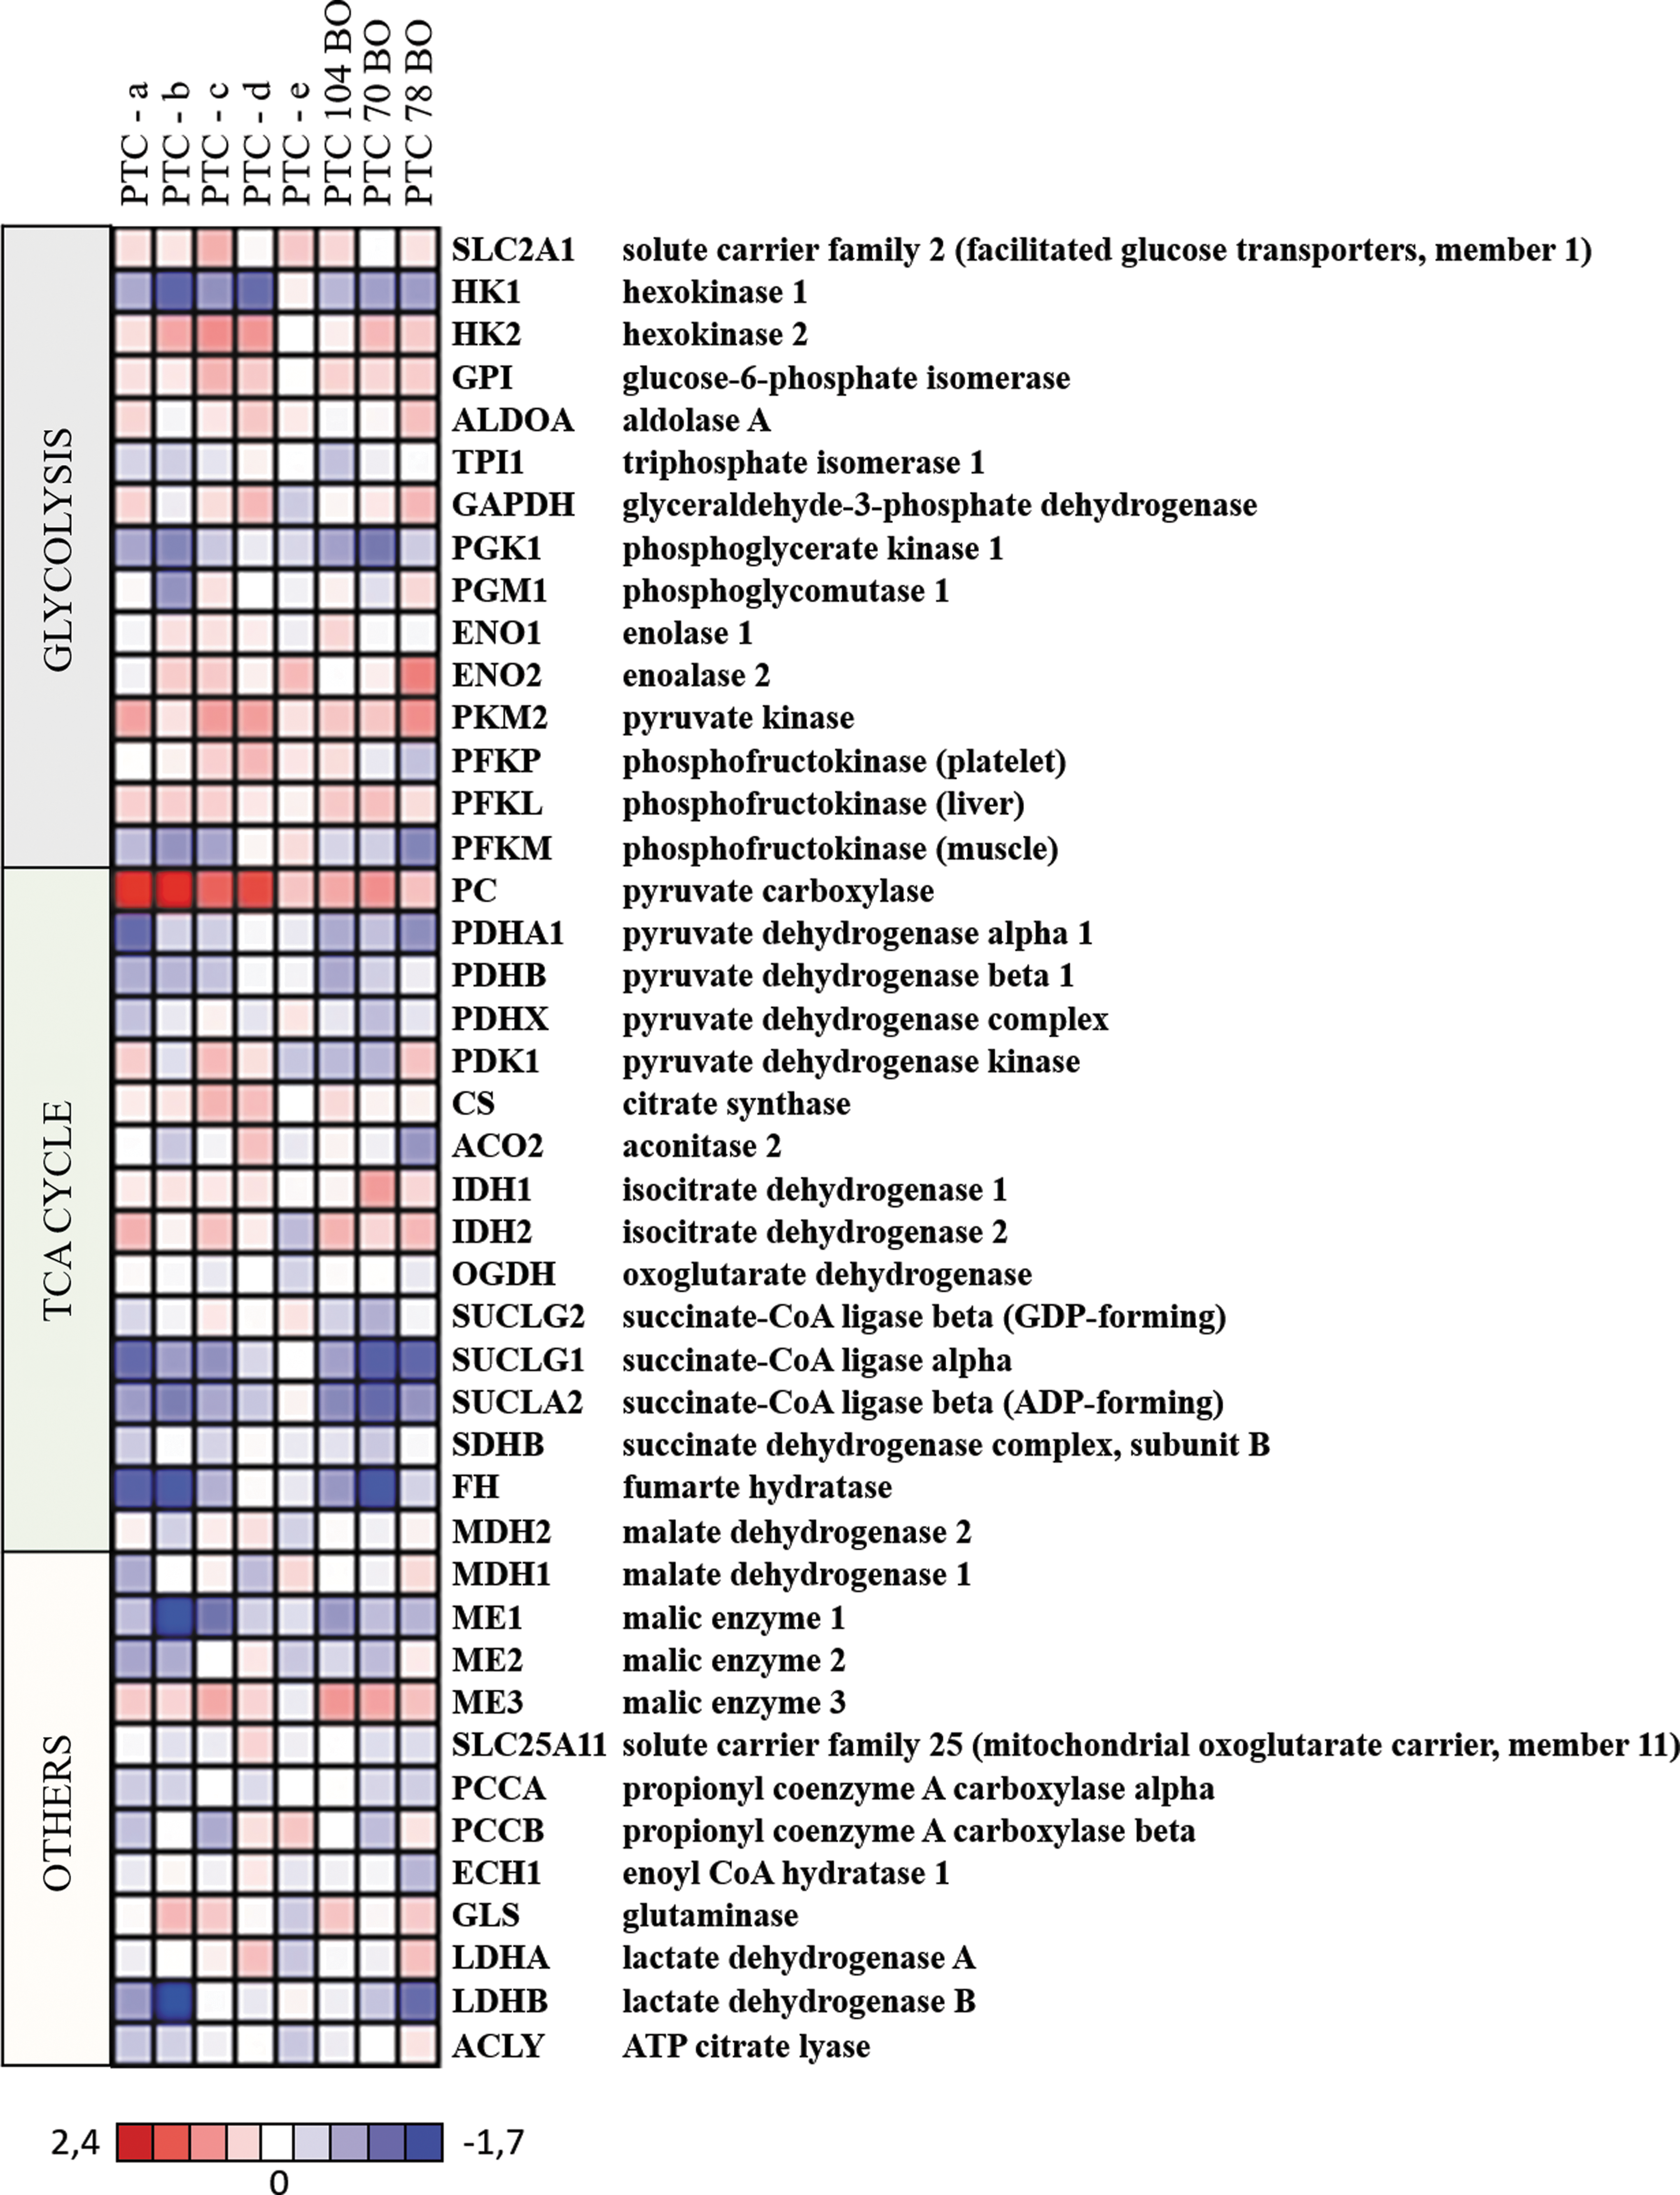
Heat map of mRNA expression levels of metabolic proteins. Expression levels were obtained by Affymetrix microarrays and are presented in log2 of expression ratios (tumor/normal). Genes were grouped by metabolic pathways: glycolysis, TCA cycle, and “others.” PTCa–e were the five PTC analyzed by MS/MS spectrometry. TCA, tricarboxylic acid; PTC, papillary thyroid carcinoma. Color images are available online.
PC expression is increased in PTC
Among the proteins identified by proteomic analysis, PC was consistently upregulated in all the PTC investigated (Fig. 1). Similarly, an increase at the mRNA level was found in the same samples and in three additional PTC (Fig. 2), as well as in 49 independent PTC analyzed previously, with a mean ratio in log2 of 1.7 (data not shown) (29). The upregulation of PC mRNA expression has been validated by quantitative reverse transcription polymerase chain reaction in 12 independent PTC. Nine were compared to their normal adjacent tissues (Fig. 3A), and three, for which no adjacent tissue was available, were compared to a pool of 22 normal thyroid tissues (Fig. 3B). PTC9 has been compared both to its normal adjacent tissue and to the pool of normal thyroids, which explains the difference between PC mRNA relative expression. The mean of expression (log2 of expression ratios between tumor and normal tissues) was 1.75, and 9/12 PTC showed more than a twofold upregulation. Increased protein expression of PC has been validated by Western blotting (Fig. 3C) on four samples already tested for mRNA expression (PTC1–4) and on 11 additional samples. Altogether, these data provided good evidence that PC is upregulated in PTC and this led us to its function being explored further in thyroid cancer cells.
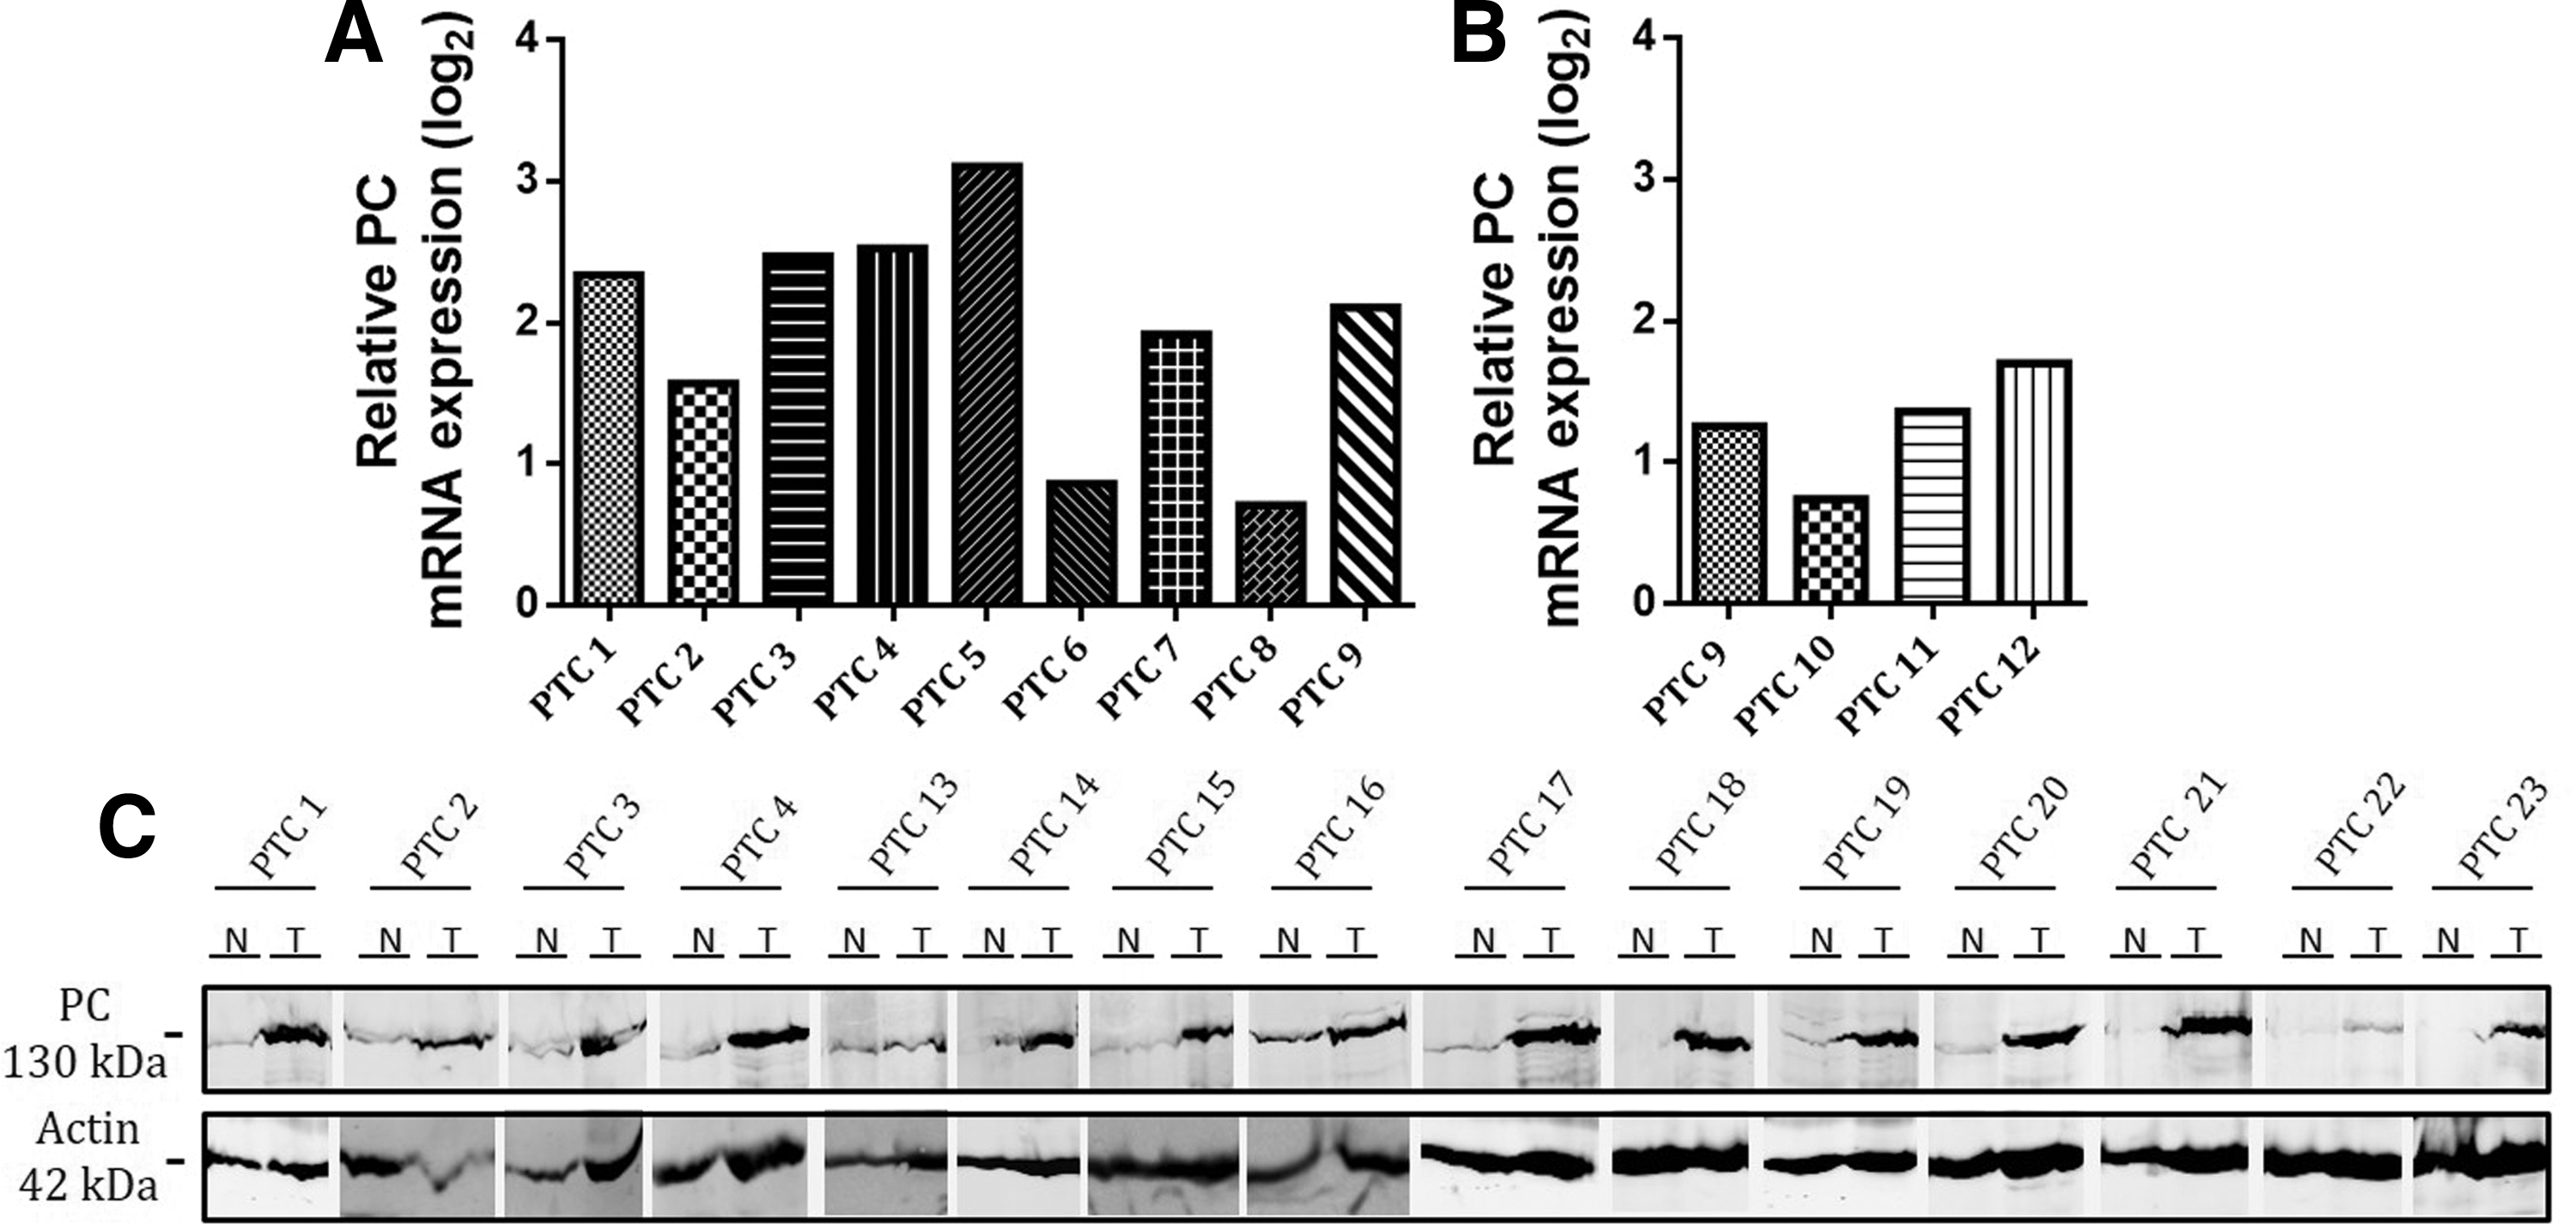
Pyruvate carboxylase (PC) expression in PTC. (
PC knockdown in thyroid cell lines alters their proliferative and motility capacities
Three thyroid cell lines (TPC1, 8505C, and HTori-3) were used to investigate the functional role of PC, following siRNA transfection. The PC mRNA expression level was significantly decreased 48 hours following siPC transfection in TPC1 cells (Fig. 4A), and the downregulation of the protein was validated by Western blotting (Fig. 4B) in the three cell lines 72 hours after transfection. PC protein levels were measured in cells transfected with siPC and siCTRL and in non-transfected cells. No difference was observed between non-transfected cells and cells transfected with siCTRL, whereas PC expression was clearly downregulated following siPC transfection.

PC knockdown following siRNA transfection and functional effects in thyroid cell lines. Transfection of siRNA against PC (siPC) was performed in three thyroid cell lines (TPC1, 8505C, and HTori). Cell lines were also transfected with a negative control siRNA (siCTRL) or not transfected (NT). PC expression was measured (
PC knockdown was accompanied by changes in the proliferative capacity of TPC1 and 8505C cells (Fig. 4C). After 72 hours of transfection, there was no change in the proliferation rate when the cells were transfected with the siCTRL compared to non-transfected cells, while siPC transfection markedly reduced the percentage of EdU-positive cells for TPC1 and less importantly for 8505C. There was no statistical difference in the percentage of EdU-labeled cells for HTori-3 cells.
Next, the role of PC on the migration and invasion properties of the three cell lines was investigated. These were evaluated by using migration or invasion chambers and by counting the cells that had crossed the specific membranes. SiPC transfection altered the migration and/or the invasion abilities of the cells: the number of migrating cells was reduced by one half for the three cell lines after transfection of siPC (Fig. 4D), and the number of invading cells decreased about four times for TPC1 cells and about twice for 8505C cells. No effect on invasion was observed in HTori-3 cells (Fig. 4E).
PC is involved in the replenishment of the TCA cycle in thyroid cell lines
The three cell lines were then used to investigate the role of PC in energy cancer metabolism (Fig. 5). The Seahorse Technology was used to measure OCR, and different substrates were given to the cells to evaluate their contribution to oxidative metabolism: glucose, lactate, pyruvate, glucose + glutamine, or glucose + glutamine ± BPTES, a GLS inhibitor. The OCR was higher when siCTRL-transfected cells received lactate or pyruvate than glucose, and was even more important with glucose + glutamine, suggesting that glutamine is a central nutrient for anaplerosis in the three cell lines. The OCR was markedly reduced following siPC transfection, regardless of the substrate, suggesting that PC participates in the replenishment of the TCA cycle. Despite the lower level of PC expression in the HTori-3 cell line compared to the other two cell lines (Fig. 4B), a decrease of OCR was also observed in these cells. This was less pronounced when the cells were fed with glucose + glutamine, suggesting that glutamine alone is sufficient. To understand how the cells are taking advantage of anaplerotic resources, they were treated with BPTES. This treatment did not affect O2 consumption in siCTRL transfected cells, but strongly decreased it in PC knockdown cells. This suggests that PC and GLS are codependent, that is, if one of the two major anaplerosis pathways is affected, the other takes over.

Oxygen-consumption rates (OCR) measurements following PC knockdown. TPC1, HTori, and 8505C cells were transfected with siPC or siCTRL 72 h before OCR measurements, which were taken before and after substrate addition. Substrates: Glc, glucose; Lac, lactate; Pyr, pyruvate; Gln, glutamine; BPTES, glutaminase inhibitor. (
Thyroid cancer cells have an increased oxidative metabolism compared to stromal cells
The overexpression of PC in PTC and its participation in the replenishment of the TCA cycle, coupled with the increased expression of many other metabolic proteins, suggests an increased oxidative metabolism in this tumor type. However, PTC are heterogeneous tumors containing stromal cells, mainly CAFs, and light has previously been shed on the important role of this stroma in tumor expansion (21). Within this context, since the “omic” studies were performed with bulk tissues, a decision was made to investigate the cellular distribution of several upregulated metabolic proteins in the cancer and in the stromal cells of PTC, and more specifically their expression in CAFs. Immunostainings were performed of PC, PCK2, PDHα1, GLS, ECH1, PCCB, and LDHA/B, as well as of additional proteins absent in the MS/MS data but known to play important roles in metabolism (PDK, MCT1/4, GLUT1, and HK2) (Fig. 6).
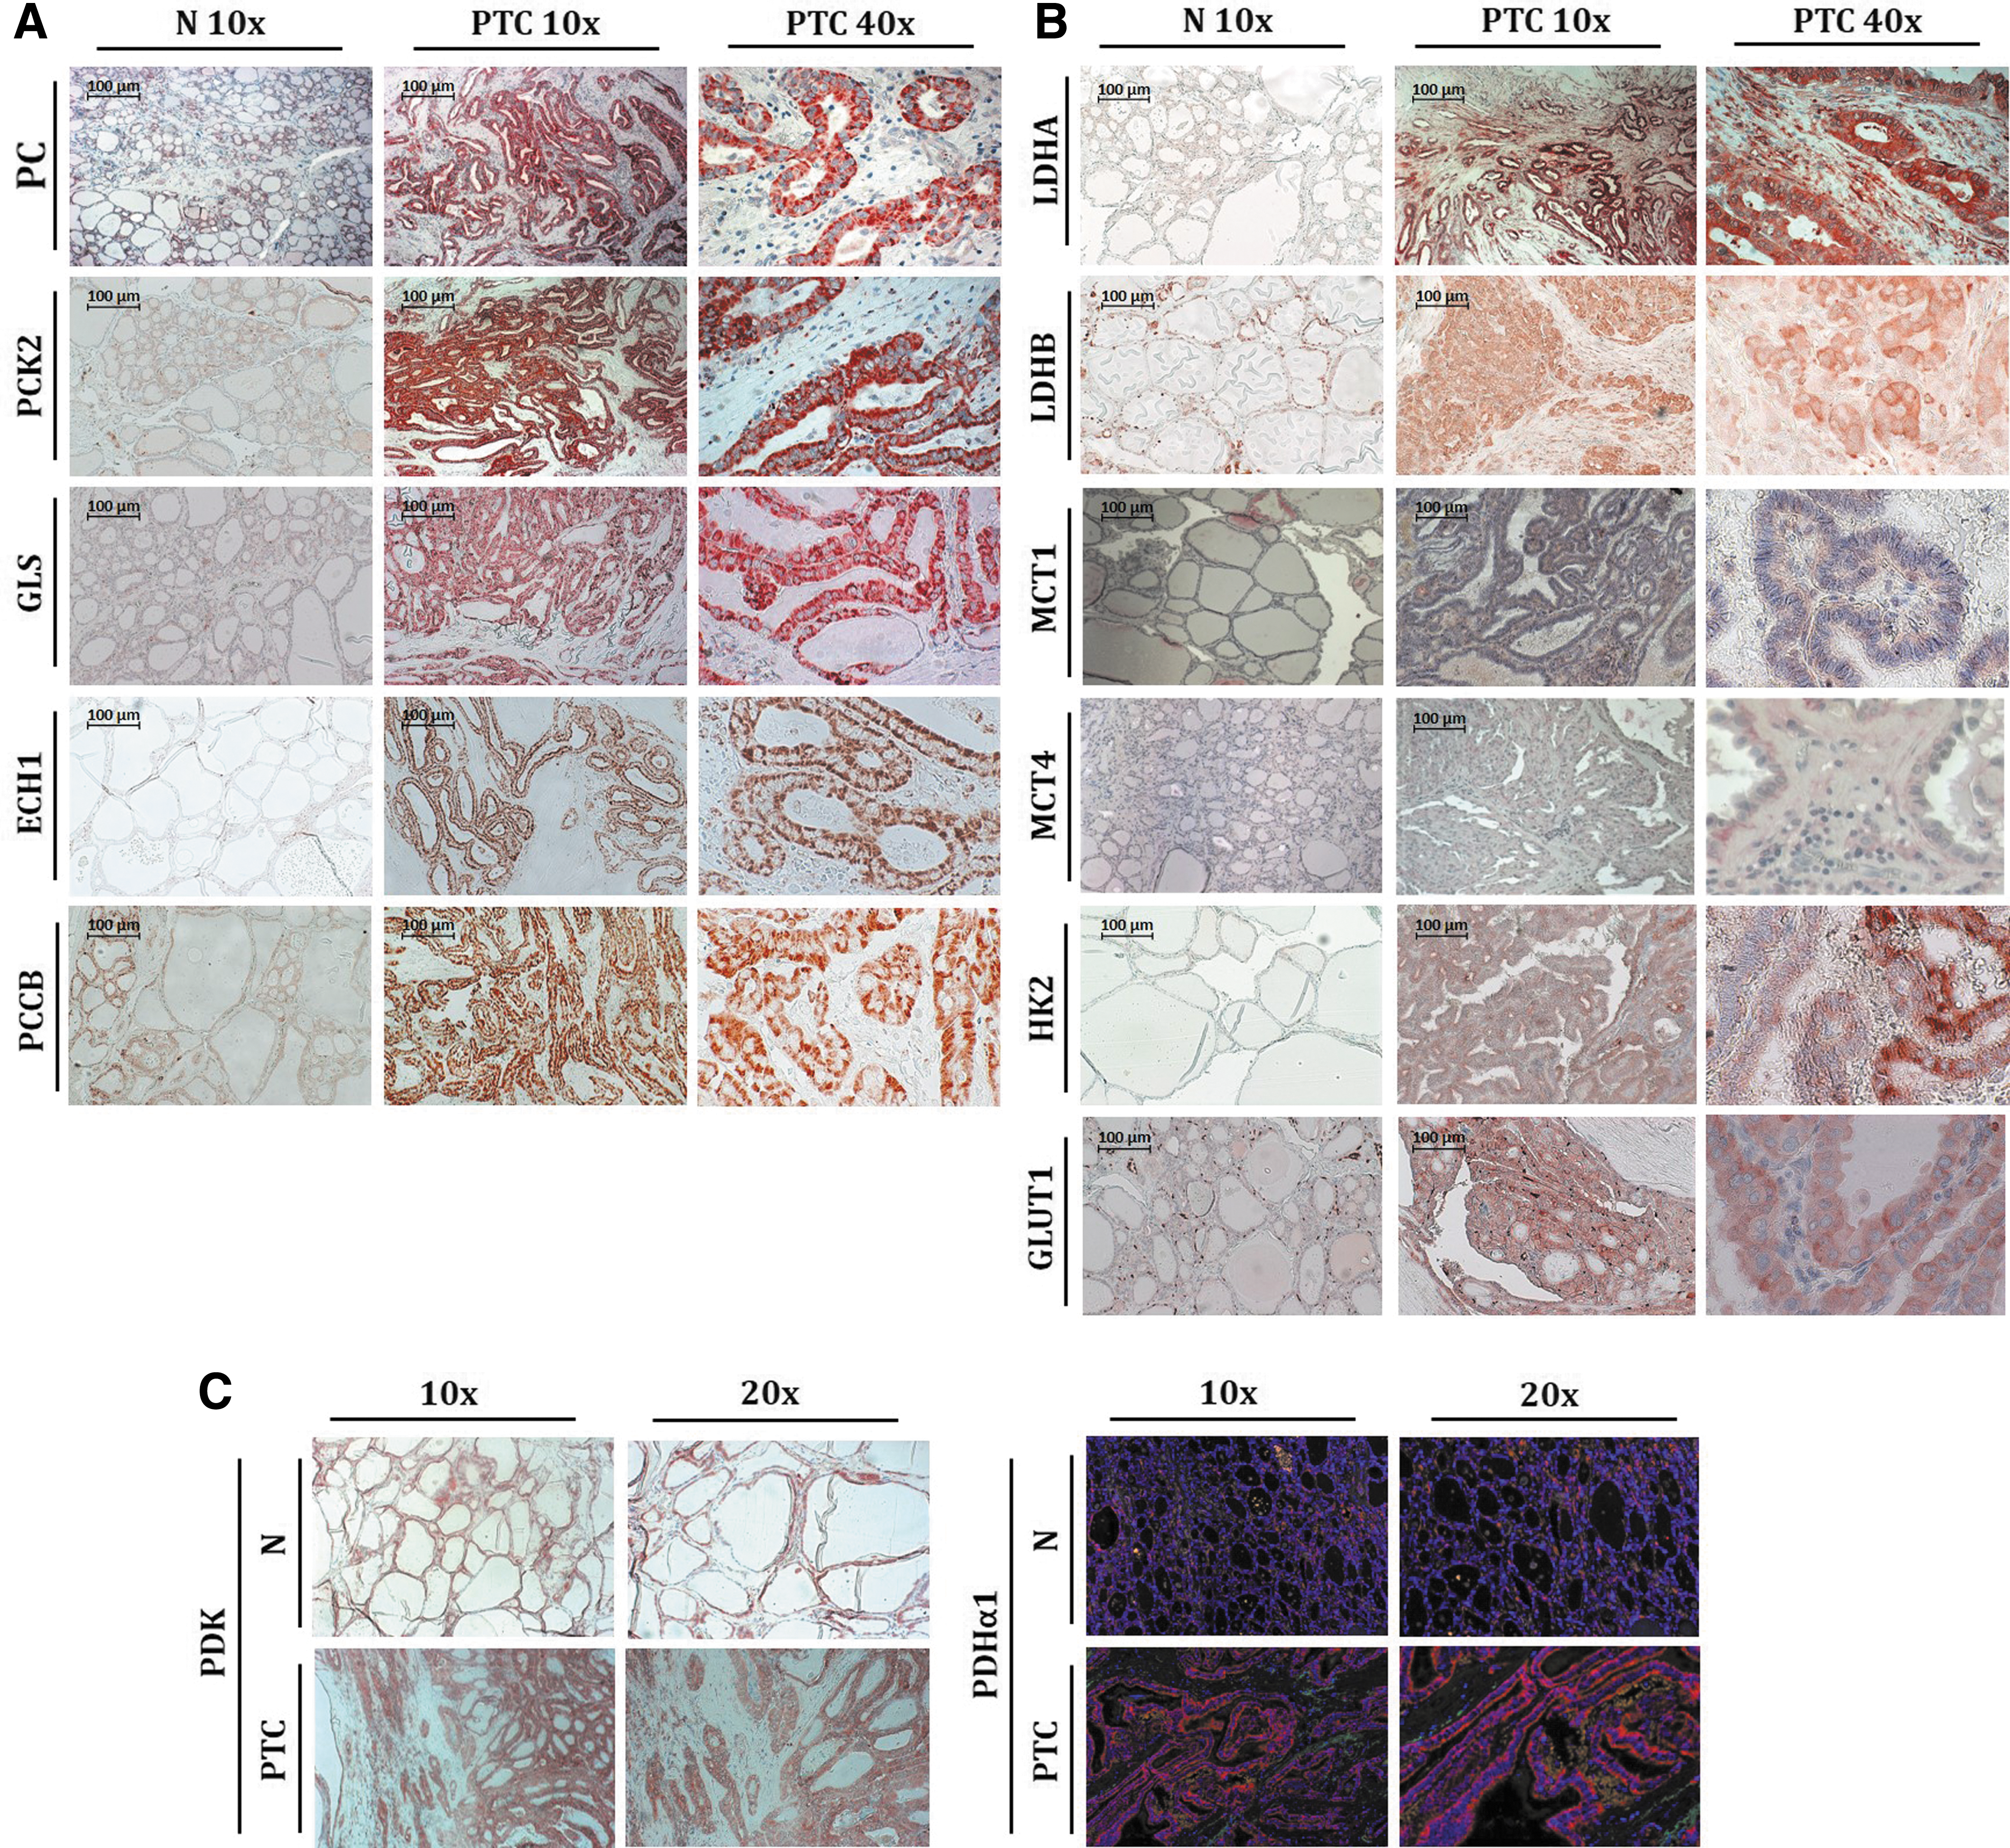
Expression of different metabolic enzymes and transporters in PTC and their normal adjacent tissues (N). (
PC overexpression was specific to cancer thyrocytes (Fig. 6A), as were two other overexpressed enzymes linked to the metabolism of oxaloacetate: phosphoenolpyruvate carboxykinase 2 (PCK2; Fig. 6A) and pyruvate dehydrogenase (PDH; Fig. 6C), the latter being responsible for pyruvate decarboxylation into acetyl-CoA, an allosteric activator of PC. These data suggest that anaplerosis occurs in PTC, with PC mediating oxaloacetate entrance into the TCA cycle. Interestingly, pyruvate dehydrogenase kinase (PDK), which inhibits PDH and is described in many cancers as overexpressed, was not deregulated in PTC (Fig. 6C). Protein levels for PDHα1 and PDK were also analyzed by Western blotting. PDHα1 was strongly upregulated in 2/8 samples and weakly upregulated in 4/8 samples, while PDK levels remained constant in most of the samples (data not shown). In addition, GLS was also specifically increased in tumor cells, suggesting activity of the major alternate anaplerotic reaction (Fig. 6A). Two enzymes implicated in β-oxidation of lipids leading to acetyl-CoA production were analyzed: 3-5,2-4,dienoyl-CoA isomerase (ECH1) and propionyl-CoA carboxylase B subunit (PCCB). Both were also specifically upregulated in the cancer cells, suggesting an increased production of acetyl-CoA in these cells (Fig. 6A).
LDH showed increased expression in cancer cells and in CAFs, and this was observed for LDHA and LDHB (Fig. 6B). Since LDH is a tetramer composed of two different subunits (LDH-M and LDH-H, respectively, encoded by the LDHA and LDHB genes) present in variable combinations, these results could be explained by the existence of mixed isoforms of LDH, all recognized by the specific anti-LDHA and -LDHB antibodies. The monocarboxylate transporter MCT1, mediating the uptake of lactate, was only overexpressed in the cancer cells, while MCT4, triggering the export of lactate, was found in tumor cells and was also weakly expressed in CAFs in some areas (Fig. 6B). Finally, the expression of HK2 and of the glucose transporter GLUT1 was analyzed. As depicted in Figure 6B, both enzymes were specifically overexpressed in the thyroid cancer cells. HK2 showed a heterogeneous expression across the entire tumor, with some tumor cells expressing higher levels of this enzyme.
Discussion
Scientific domains in cancer research are clear and easily understandable, as long as they are kept distinct. However, as soon as concepts and findings in one domain are extended to another, difficulties and discrepancies appear. Whereas the cause and initial genetic mechanism of a particular tumor may be well defined, its phenotype and even genotype evolve in space and time, resulting in spatial and temporal heterogeneity. Experimentally, studies on whole tissues (e.g., omics studies) ignore the morphological and metabolic heterogeneity of the tumor. On the other hand, focused experimental studies in vitro (e.g., cancer cells, cell lines) and in vivo ignore tissue complexity (30).
With regard to cancer metabolism, much has been learned about the versatility of in vitro models, depending on the culturing conditions, for instance the existence of both the Warburg and the reverse Warburg effects, the alternative use of substrates depending on their availability, and the roles of lactate and H+ as metabolites and signals (31). On the other hand, the description of cancers in vivo is based mostly on observations at one point in time (“snapshots”). It is therefore interesting to investigate which situation exists in vivo in human cancers. For this, global measurements (genetics, mRNA, protein expression, etc.) should be complemented by methods allowing spatial and time distributions of properties to be defined. This study have tried to integrate some fundamental experimental concepts on tumor energy metabolism in order to define the spatial characteristics of metabolism, the Warburg effect, and anaplerosis of the well-defined, most frequent, human thyroid cancer, PTC. This could provide a few conceptual links between experimental and physiopathologic concepts.
For decades, the hypothesis of Otto Warburg orientated cancer research to understand better how tumors work, and to find new treatments. According to the concept of the Warburg effect, tumors have increased glycolysis and drastically reduced oxidative mitochondrial activity. This concept led to the development of therapies specifically targeting the glycolytic pathway (32,33). However, several studies have demonstrated that the TCA cycle is still functional in some tumors and produces catabolic precursors for their proliferative needs (6). This study shows that PTC have a very active TCA cycle, which contrasts with the Warburg model, and this activity is not mutually exclusive with glycolysis, since both metabolic pathways are active.
As energy metabolism in PTC is poorly characterized, this study investigated the metabolic alterations in these tumors. A proteomic analysis of five PTC revealed upregulation of a high number of proteins involved in metabolism, which were further characterized. Although the number of samples analyzed is too low to draw definite conclusions, these deregulations seem to be amplified according to tumor stage, suggesting a correlation between increased energy metabolism and tumor aggressiveness. Accordingly, Nahm et al. showed that the expression of glycolysis-related proteins correlates with poorer prognosis (17). PC appeared to be overexpressed at both the mRNA and protein levels, a new finding in the field. This enzyme that allows pyruvate to be carboxylated into oxaloacetate, funneled in the TCA cycle, was only recently described as deregulated in lung and breast cancers (34,35). This suggests that pyruvate is not systematically transformed into lactate according to the Warburg effect, but rather that it could be an essential resource to maintain the oxidative mitochondrial metabolism. The functional role of PC was first defined in thyroid cell lines. Two commonly used thyroid cancer cell lines, TPC1 and 8505C (23,25), and HTori-3 cells, non-tumorigenic SV40-immortalized human thyrocytes (24), were used for this purpose. Although TPC1 and 8505C cells derive from a PTC and an ATC, respectively, these cell lines have evolved into a common, dedifferentiated phenotype (23,25). Thus, TPC1 and 8505C cells were not chosen as a relevant model for the corresponding in vivo tumor, but rather as experimental in vitro models for thyroid cancer. Both cell types showed decreased proliferation, migration, invasion, and mitochondrial respiration rates following PC knockdown, suggesting a role of PC in generating energy and metabolic precursors through the pyruvate conversion into oxaloacetate and its consumption by the TCA cycle. No changes were observed in the proliferation and invasion rates in HTori-3 cells following PC knockdown, but their migration rate and their oxygen consumption were reduced. The non-tumorigenic character and the non-cancer origin of HTori-3 cells might explain these differences.
Cellular heterogeneity is an emerging concept in interpreting cancer biology, and PTC are indeed heterogeneous tumors containing thyroid cells, stromal cells such as cancer-associated fibroblasts, lymphocytes, and endothelial cells. To explore the increased oxidative mitochondrial metabolism in PTC further and to analyze the contribution of the different cell types, the study investigated the cellular distribution of several metabolic proteins in the cancer and in the stromal cells by immunohistochemistry (IHC). PC, PCK2, and PDHα1, three enzymes related to the metabolism of oxaloacetate, were specifically overexpressed in cancerous thyrocytes, whereas the expression of PDK, an inhibitor of PDH, remained unchanged. PC and PDH, by producing respectively oxaloacetate and acetyl-CoA, itself an allosteric activator of PC, contribute to replenish the TCA cycle. PCK2, the mitochondrial isoform of PCK, although well known for its role in gluconeogenesis, underlines the importance of the TCA cycle in absence of glucose (36). The overexpression of PDH, observed in 75% of the samples, and the absence of deregulation of PDK contrast with the findings described in other cancers, such as non–small cell lung carcinomas (NSCLC), where the repression of the PDH/PDK pathway has been associated with aerobic glycolysis (the Warburg effect) (37). Taken together, the data support the presence of an actively functioning TCA cycle in PTC, involving pyruvate metabolism. In addition, they also suggest that acetyl-CoA can be produced from lipid degradation, since several enzymes involved in this pathway showed an increased expression, as measured by MS/MS. Among them, the specific overexpression in cancer cells of ECH1 and PCCB was confirmed by IHC. This is in agreement with other studies reporting a role of lipid degradation in cancers, such as in triple-negative breast cancer, following stress conditions (38,39).
The other important anaplerotic reaction able to replenish the TCA cycle (i.e., glutaminolysis) also appears to sustain the energy metabolism in PTC. Indeed, overexpression of GLS was observed in the cancerous cells of the PTC, and glutamine was identified as an essential nutrient in thyroid cell lines tested for oxidative respiration. Inhibiting GLS by BPTES highlights the existence of a compensatory relationship between GLS and PC, already described for glioblastoma cells in culture and in xenografts (12), in addition to the anaplerotic role of GLS.
All the enzymes involved in oxidative metabolism that were studied were specifically overexpressed in thyroid cancer cells. Cancer-associated fibroblasts have been described in other cancers such as breast and brain cancers to feed cancerous cells by producing lactate in the tumor microenvironment (10,40). The present data show that LDH enzymes are present in cancerous cells and in CAFs, but they do not allow the definitive conclusion of the metabolism of lactate. Regarding the lactate transporters, MCT1 (uptake of lactate) is overexpressed in tumor cells, while MCT4 (export of lactate) is present in tumor cells but also weakly expressed in CAFs in some areas. This confirms other studies on thyroid cancer (22), and suggests that lactate is released from cancerous cells and from CAFs in some areas of the tissue and is taken up by other cancerous cells, allowing production of ATP through mitochondrial oxidative phosphorylation. It supports the metabolic model of the reverse Warburg effect between cancerous cells and CAFs, as well as the existence of a metabolic symbiosis between cancer cells that are not equal with regard to oxygen availability (41). Finally, the study investigated the origin of pyruvate, which could derive from glucose as well as from lactate. The proteomic data revealed an overall upregulation of the glycolytic enzymes in the five analyzed PTC. IHC was performed with GLUT1 and HK2 antibodies, and it was observed that both enzymes were specifically overexpressed in tumor cells, confirming a previous report (17). The overexpression of GLUT1 is consistent with the observation that in differentiated thyroid carcinomas, glucose uptake in BRAFV600E -positive tumors was higher than in BRAF wild-type tumors (16). In addition, the overall survival of patients with high GLUT1 expression is reduced (17). Altogether, the results suggest that in PTC, glucose is distributed between the TCA cycle and the production of lactate, as it was reported in KRAS-mutated NSCLC (20), glioblastomas (42), and bladder cancer (43).
In conclusion, PC is a key enzyme in thyroid cancer cells at the intersection between glycolysis and the TCA cycle, playing an important role in anaplerosis. The distribution of other overexpressed enzymes showed that the TCA cycle is very active in tumor cells. However, the results give only a snapshot of the Warburg effect, metabolism, and anaplerosis in PTC at the time of tissue collection. They do not consider the evolution of the described temporal heterogeneity. For this, further in vivo studies, for example a 13C-tracer analysis with labeled glucose and lactate, could provide information about carbon trafficking inside the tumors (44). Hypoxia should also be investigated in PTC to identify areas with distinct metabolic adaptations. Exploring the expression pattern of the different metabolic proteins comparing central and peripheral tumor areas might also bring interesting information regarding tumor heterogeneity. Such knowledge could give a basis for the rational use of new therapeutic tools targeting tumor metabolism (14,33). However, this concept implies that all the cells exhibit the same pattern at the same time, which in the case of metabolism is not true (30,45). Moreover, cancer cells are able to adapt to changing conditions by shifting from one metabolic pattern to another.
Footnotes
Acknowledgments
This study was supported by grants from the Fonds de la Recherche Scientifique FNRS-FRSM, Fonds J-P Naets, Fondation Roi Baudouin. The authors thank Chantal Degraef, Claude Massart, and Bernadette Bournonville for the excellent technical support. Protocols have been approved and consent by the Ethics Committee of the J. Bordet Institute (protocol number: 1978), in accordance with the Declaration of Helsinki.
Author Disclosure Statement
No competing financial interests exist.
Supplementary Material
Supplementary Figure S1
Supplementary Table S1
Supplementary Table S2