
Abstract
Background:
The reported prevalence of thyroid disease in pregnancy varies widely through the published literature. These discrepancies are due to differences in criteria for euthyroidism, nationality, iodine status, and gestational age at screening. As a result, currently, an accepted rate of prevalence does not exist for the various thyroid diseases in pregnancy. Understanding the true prevalence rates of these disorders has important implications for clinical management and the ongoing discussion regarding universal screening. The aims of this study were to assess (i) the true prevalence of thyroid disorders in pregnancy and (ii) the impact of diagnostic methodology on these rates.
Methods:
A systematic review was conducted of the existing literature, including the Pubmed database and references from relevant review articles. Sixty-three studies reporting prevalence of overt hypothyroidism, subclinical hypothyroidism, isolated hypothyroxinemia, subclinical hyperthyroidism, and overt hyperthyroidism in pregnant women were included. Studies were further classified by thyrotropin (TSH) cutoff for diagnosis in hypothyroid disease and timing of screening for hyperthyroid disease. Meta-analysis yielded pooled prevalence rates, with subgroup analyses for TSH cutoff and timing of screening. Analysis of studies using the 97.5th percentile TSH cutoff was assessed to yield the most accurate prevalence rates for hypothyroidism.
Results:
Pooled prevalence rates for hypothyroidism calculated from studies using the 97.5th percentile as an upper limit for TSH were 0.50% for overt hypothyroidism, 3.47% for subclinical hypothyroidism, and 2.05% for isolated hypothyroxinemia. Pooled prevalence rates in the first and second trimesters for hyperthyroidism were 0.91% and 0.65%, respectively, for overt hyperthyroidism and 2.18% and 0.98%, respectively, for subclinical hyperthyroidism.
Conclusion:
Population-based, trimester-specific TSH cutoffs for diagnosis of hypothyroid disease in pregnancy result in more accurate diagnosis and better estimates for prevalence of disease. Prevalence of hyperthyroidism in pregnancy varies depending on timing of screening. The prevalence rates reported in this study represent the best estimate to date of the true rates of thyroid disease in pregnancy.
Introduction
N
Given the association between thyroid disease and adverse pregnancy outcomes, a debate has ensued regarding whether universal thyroid screening in pregnancy should be instituted. Critical to this debate is the wide range in the prevalence of thyroid disorders reported in the literature. Although a straightforward question, the answer is fraught with ambiguities. The greatest confounding variable is the difficulty in reaching a consensus as to what constitutes a normal thyrotropin (TSH) level in pregnancy. In 2011, the ATA published thyroid and pregnancy guidelines, which included a definition of the normal TSH range during pregnancy. Population-based reference ranges obtained in a local, euthyroid, pregnant population were considered the gold standard for determining the normal TSH range per trimester. However, if these were not available, which is still most often the case, the ATA thyroid and pregnancy guidelines recommended a range of 0.1–2.5 mIU/L in the first trimester, 0.2–3.0 mIU/L in the second trimester, and 0.3–3.0 mIU/L in the third trimester (19). The 2017 ATA thyroid and pregnancy guidelines revised these TSH ranges. Absent population-derived data, the TSH upper limit of normal for late in the first trimester was set at 4.0 mIU/L, with a gradual return to the nonpregnant reference range in the second and third trimesters. In addition, the 2017 guidelines also clarified that population-based reference ranges be determined from not only euthyroid, but also thyroid peroxidase antibody (TPOAb)-negative women (6). Due to the shifting definition of normal thyroid function in pregnancy, it is not surprising that the reported prevalence of overt hypothyroidism ranges between 0% and 13.1% (20,21), with the prevalence of subclinical hypothyroidism varying from 1.5% to 42.9% (21,22).
The diagnosis of hyperthyroidism during pregnancy is complicated by a different factor, namely the impact of human chorionic gonadotropin (hCG) on the TSH receptor. As a weak agonist, placental hCG cross-reacts with the TSH receptor, leading to increased production of thyroxine and a decrease in TSH (23). Prospective studies demonstrate an inverse relationship between TSH and hCG, with TSH at its lowest when hCG peaks late in the first trimester. In 1993, Glinoer et al. reported that 18% of pregnant women without thyroid disease have suppressed TSH levels in the first trimester, which return to normal as pregnancy progresses (24). Similarly, Fraenkel et al. recently published that women with TSH levels <0.40 mIU/L in the first trimester exhibit normal TSH levels later in pregnancy and no adverse pregnancy outcomes (25). Therefore, the prevalence of hyperthyroidism and, in particular, subclinical hyperthyroidism is strongly impacted by the gestational week of screening. Consequently, the reported prevalence of overt hyperthyroidism varies in the literature from 0% to 2.5% (26,27), whereas the prevalence range of subclinical hyperthyroidism is quite broad, stretching from 0.3% to 13% (28,29).
The goal of the present study was to establish a more refined estimate of thyroid disease in pregnancy through the use of meta-analysis, which takes into account, for hypothyroidism, the definition of hypothyroidism utilized and, for hyperthyroidism, the gestational age at which TSH testing occurred.
Methods
This study was conducted and reported in accordance with the Preferred Reporting Items for Systematic Reviews and Meta-Analysis (PRISMA) statement (30). The review protocol used is described herein. One author (A.D.) examined the current literature through a search of the PubMed database (inception to July 10, 2018). The search query included the following terms: (“pregnancy”[MeSH Terms] OR “pregnancy”[All Fields]) AND (“subclinical hypothyroidism”[All Fields] OR “overt hypothyroidism”[All Fields] OR “overt hyperthyroidism”[All Fields] OR “hypothyroxinemia”[All Fields]). Additional studies were identified through review of references in recent review articles. All studies were imported into RefWorks 2.0 (ProQuest, Ann Arbor, MI) where duplicates were removed.
Titles and abstracts of articles were scanned, and relevant articles were selected for full-text review. The literature reviewed was limited to English language, full-text, published articles only. Studies that reported a prevalence of overt hypothyroidism, subclinical hypothyroidism, isolated hypothyroxinemia, subclinical hyperthyroidism, or overt hyperthyroidism in pregnant women at any gestational age were included, regardless of whether not prevalence was the primary outcome measure. Studies that limited the population studied to specific groups of pregnant women, including but not limited to those undergoing infertility treatment, those with recurrent pregnancy loss, or those with known thyroid disease, were excluded. Upon full-text review, an additional subset of articles was excluded, coded as one of the following reasons: (i) no prevalence reported for conditions of interest, (ii) only specific subgroups included, (iii) full cohort prevalence not reported, or (iv) duplicate cohort. Authors were not contacted for missing information. All included studies in the systematic review were included in the meta-analysis.
Prevalence data, defined as total number of cases divided by total number of study participants, were extracted or calculated from the available data. The data were then classified based on type of disease being reported on overt hypothyroidism, subclinical hypothyroidism, isolated hypothyroxinemia, subclinical hyperthyroidism, or overt hyperthyroidism. Data in the hypothyroid and isolated hypothyroxinemia groups were further classified by TSH cutoff criteria for determining diagnosis. Hyperthyroid data were further classified based on timing of thyroid function testing. When the timing of testing was not consistent throughout an individual study, the study was classified by reported mean or median time of testing. When ranges for timing were provided, the middle of this range was used to classify the study. If this information was unavailable or conflicting, the authors of these articles were contacted for clarification. A single author performed the data classification (A.D.).
Data from 63 studies were aggregated in the meta-analysis and analyzed using MetaXL v5.3 (Epigear International, Sunrise Beach, Australia) add-in for Microsoft® Excel 2016 version 16.0.9330.2124 (Microsoft, Redmond, WA). The principal summary measure calculated was pooled prevalence. Most accepted tools for bias assessment of observational studies are limited and are ill-suited to studies of prevalence. To address this, Hoy et al. have described a checklist for assessing bias in prevalence studies, which was modified for use in this study (31).
To avoid the drift in variance toward 0 of studies that report prevalence rates close to 0, prevalence estimates were transformed using the double arcsine method and were back-transformed for ease of interpretation (32). Heterogeneity was assessed with the I 2 statistic. To account for study heterogeneity, pooled prevalence with a confidence interval (CI) was calculated using the inverse heterogeneity model in MetaXL. Study weighting was thus determined based on the heterogeneity of each study. Compared to the standard random effects model used in many meta-analyses, this method tends to reflect the statistical error better (33).
Results
Search results
A total of 684 articles were identified through the initial database search, with an additional 47 identified through reference review of recently published articles, leading to a total of 685 articles analyzed after duplicates were removed. Ninety-two articles were selected for full-text review. Twenty-nine articles were excluded after review, leaving 63 studies (27,29,34 –94) from 24 different countries to be included in the review and meta-analysis. The included studies are presented in Table 1. A flow diagram of the study selection strategy is depicted in Figure 1.
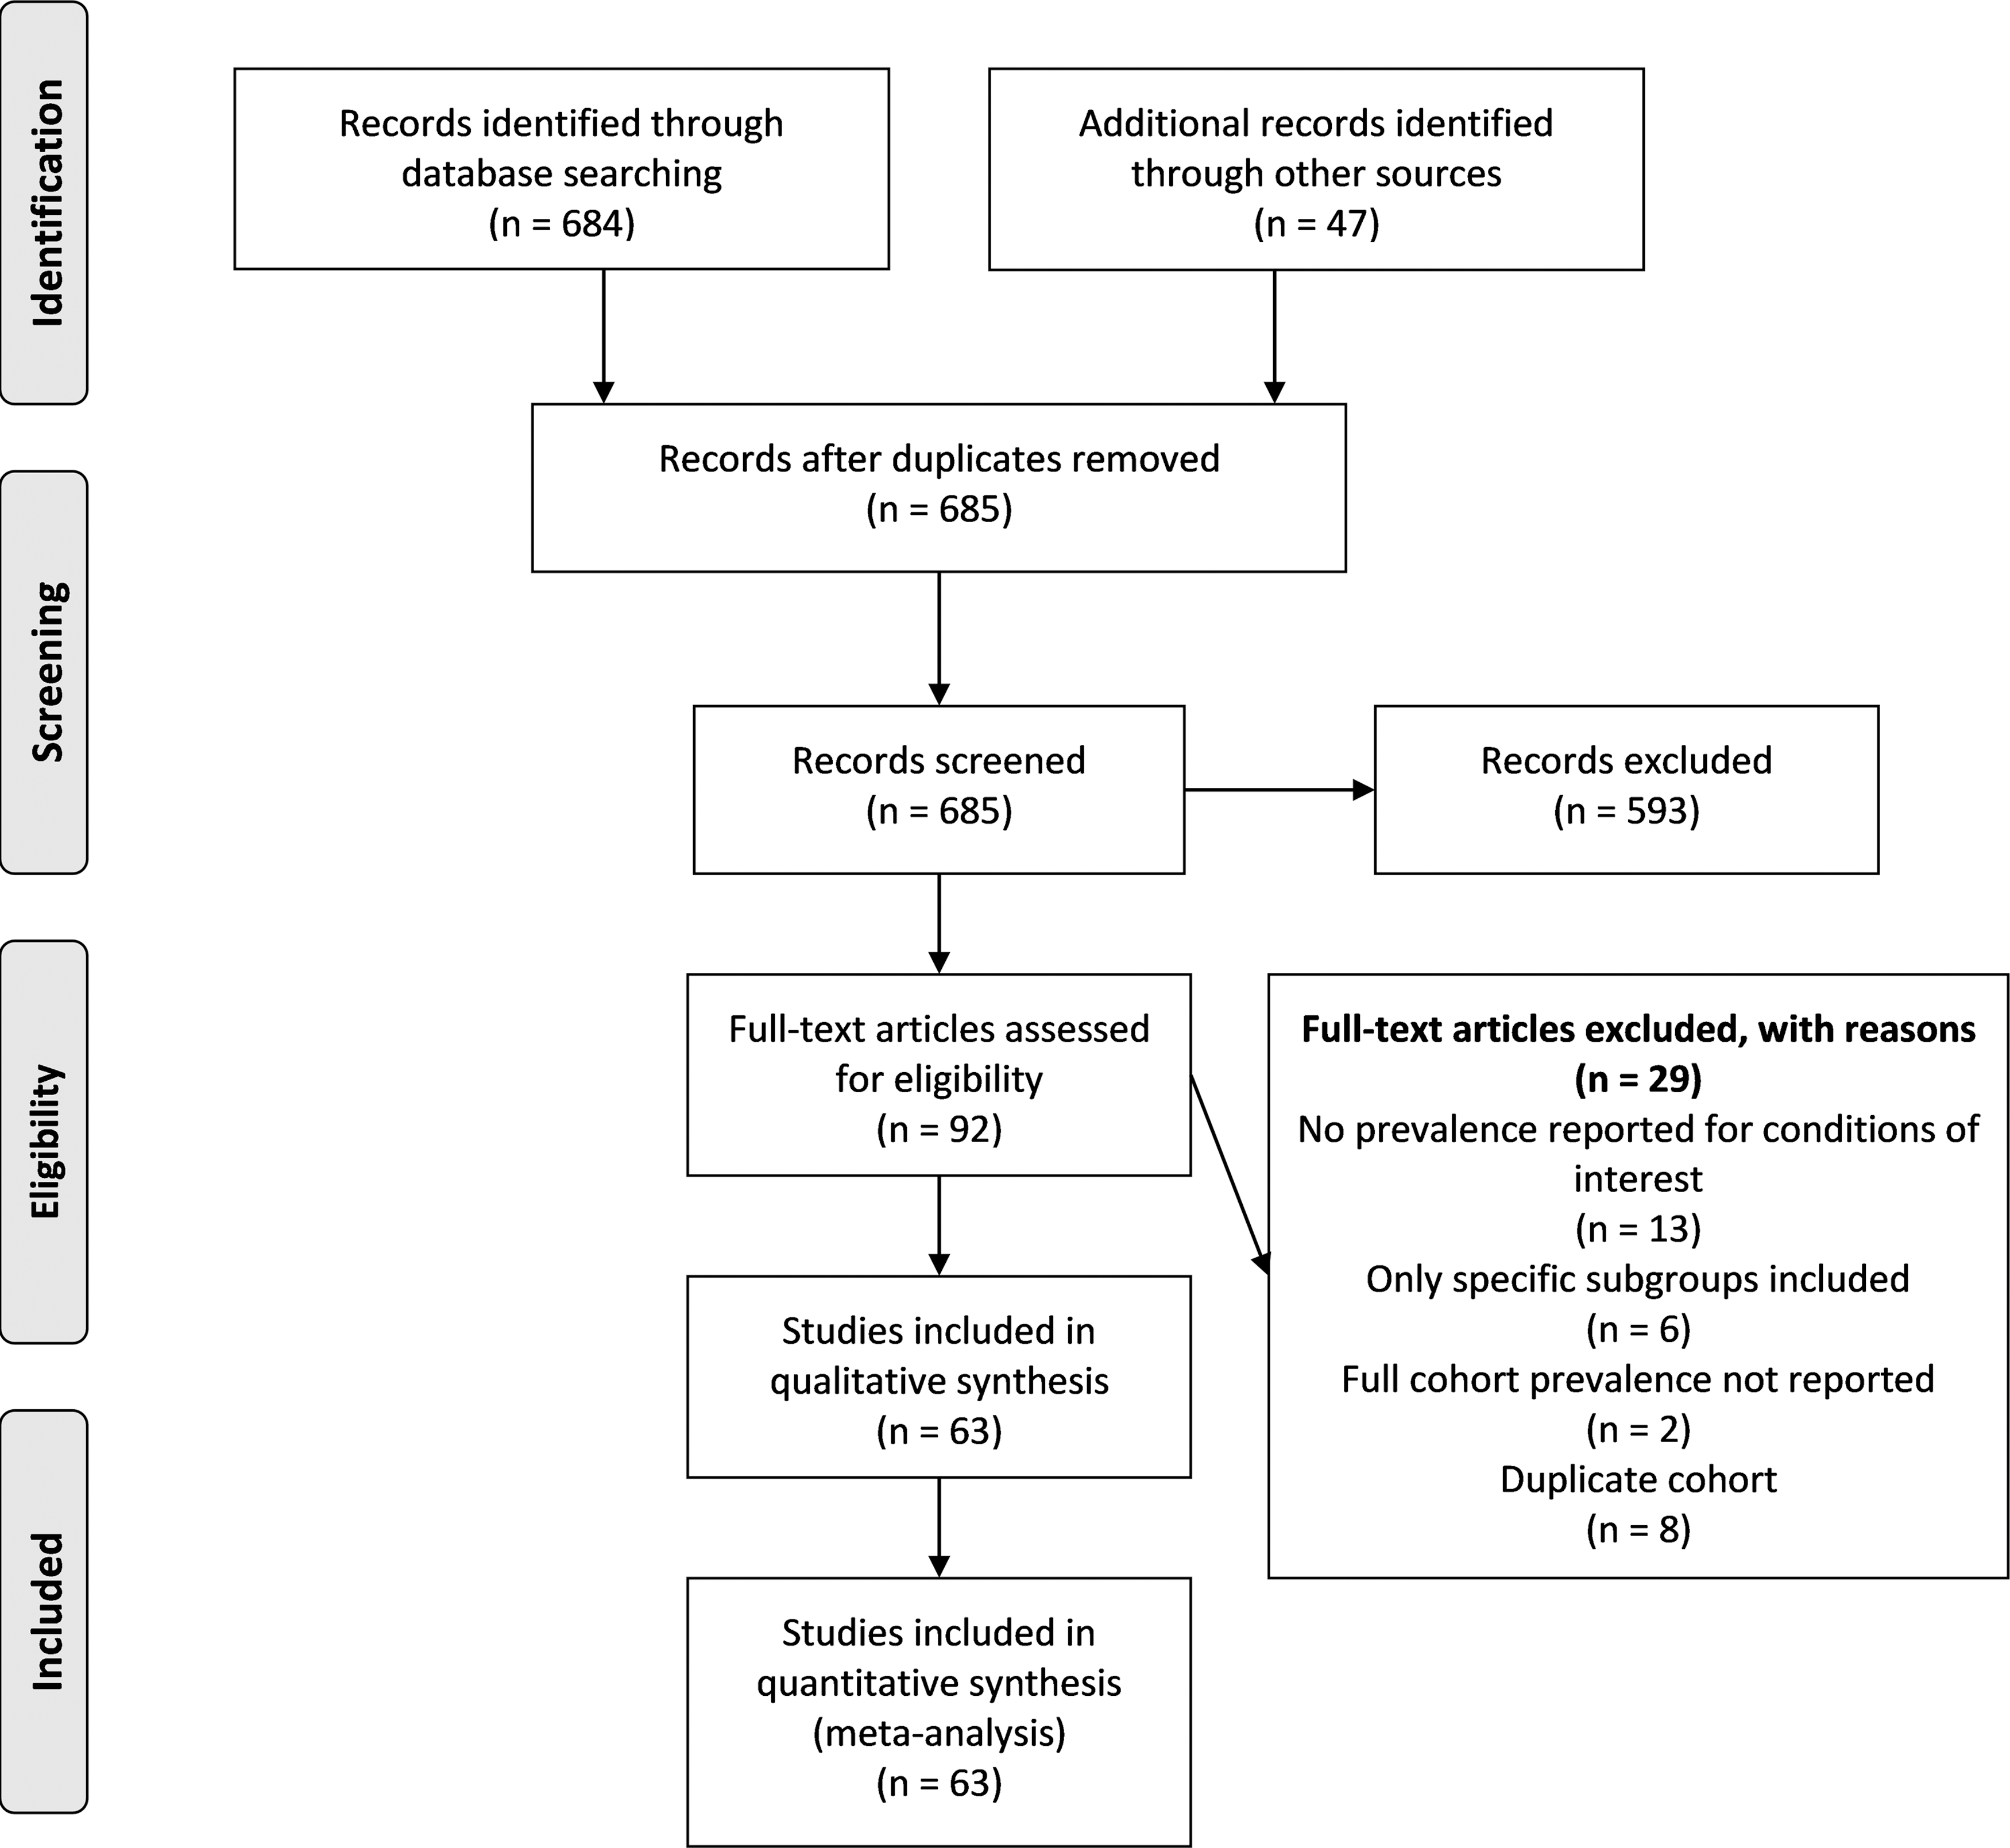
Flow chart depicting article selection strategy. Articles were excluded if they did not provide a prevalence rate or enough data to calculate a prevalence rate for overt hypothyroidism, subclinical hypothyroidism, isolated hypothyroxinemia, subclinical hyperthyroidism, or overt hyperthyroidism; if they included only certain populations in their subjects (e.g., patients with infertility, or patients with diabetes); if they only reported prevalence data for a portion of their cohort (e.g., only patients with risk factors were screened); or if the study cohort represented all or a portion of another cohort already included in the review.
Included studies
Studies included in the analysis included 28 with cross-sectional design (29,36,37,42,43,45 –48,50,53,55 –57,59,61,63 –65,68,73 –75,77,81,83,90,93), 34 with a cohort design (27,34,35,38 –41,44,47,49,51,52,54,58,60,62,66,67,69 –71,76,78 –80,82,84,85,87 –89,91,92,94), and a single randomized controlled trial (72).
Forty-three studies provided prevalence estimates for overt hypothyroidism (27,34,37 –41,43,46,49,50,52 –55,58 –61,63 –66,68,69,73,75 –78,80 –86,88,89,91 –94). Of these, 19 used a population-derived 97.5th percentile as an upper TSH limit for diagnosis (39 –41,46,52,53,55,63,65,66,69,76,78,80 –82,86,91,94). Four used a population-derived 95th percentile (27,58,88,92), 12 used the ATA 2011 recommendation of 2.5 mIU/L as a fixed cutoff (34,38,39,49,59 –61,64,75,83,85,93), and nine studies used another cutoff of >4.0 mIU/L (37,43,50,54,68,73,77,84,89). One study provided a prevalence estimate for both the 97.5th percentile and the ATA 2011 fixed cutoff (39).
Fifty-six studies provided prevalence estimates for subclinical hypothyroidism (27,34 –43,45,46,49 –61,63 –69,71 –78,80 –94). Of these, 24 used a population-derived 97.5th percentile as an upper TSH limit for diagnosis (39 –41,46,51 –53,55,56,63,65 –67,69,71,74,76,78,80 –82,86,91,94). Four used a population-derived 95th percentile (27,58,88,92), 26 used the ATA 2011 recommendation of 2.5 mIU/L as a fixed cutoff (34 –39,42,43,45,49,56,59 –61,64,71 –73,75,77,83,85,87,90,93), and another eight studies used another cutoff of ≥4 mIU/L (37,50,54,56,57,68,84,89). Two studies provided prevalence estimates for both the 97.5th percentile and the ATA 2011 fixed cutoff (39,71). One study provided prevalence estimates for the 97.5th percentile, the ATA 2011 fixed cutoff, and at a TSH >4 mIU/L (56). Two studies provided prevalence estimates for the ATA 2011 fixed cutoff and at a TSH >4 mIU/L (37,57).
Twenty-eight studies provided prevalence estimates for isolated hypothyroxinemia (38,40,41,44,45,47,52,55,59 –64,66,69,70,78,79,82,85 –89,91,92,94). Of these, 13 studies used population-derived 2.5th and 97.5th percentiles as the TSH reference interval for diagnosis (40,41,44,47,52,55,63,69,78,82,86,91,94). Three studies used population-derived 5th and 95th percentiles (70,79,88). Nine studies used the ATA 2011 fixed ranges of 0.1–2.5 mIU/L in the first trimester, 0.2–3.0 mIU/L in the second trimester, and 0.3–3.0 mIU/L in the third trimester (38,45,59 –61,64,66,85,87). Another three studies used another cutoff, with the upper limit >4 mIU/L (55,62,89).
Twenty studies provided prevalence estimates for subclinical hyperthyroidism (27,29,40,41,44,48,55,64,65,69,75,78,80,82,84,85,88,89,91,92). Of these, 13 studies had thyroid function testing done in the first trimester (27,29,40,41,55,64,65,75,78,80,88,89,91), and seven studies had testing done in the second trimester (27,44,69,82,84,85,91).
Twenty-one studies provided prevalence estimates for overt hyperthyroidism (27,29,40,41,48,55,64,65,69,75,77,78,80,82 –85,88,89,91,92). Of these, 14 studies had thyroid function testing done in the first trimester (27,29,40,41,55,64,65,77,78,80,83,88,89,91), and six studies had testing done in the second trimester (27,69,82,84,85,91).
Risk of bias
A summary of completed assessments for all included studies can be found in Supplementary Table S1. Forty-five studies were assessed to be at low risk for bias. Sixteen studies were assessed to be of moderate risk. Two studies were assessed to be at high risk for bias. The overall assessment of bias risk assigned to each study did not necessarily reflect the numerical scores from the other categories, as nuances of each study may not necessarily be reflected in a binary yes or no response (31). The studies assessed to be of low risk tended to have higher numbers of study participants, often selected randomly or by census, and had target populations more representative of the study location's national population.
Prevalence of overt hypothyroidism
Prevalence estimates for overt hypothyroidism ranged from 0% to 13.1% among included studies. Meta-analysis yielded an overall pooled prevalence estimate of 0.61% [CI 0.34–0.91%]. Among studies using a 97.5th percentile TSH cutoff, prevalence estimates ranged from 0% to 2.4%, with meta-analysis yielding an overall pooled prevalence estimate of 0.50% [CI 0.28–0.76%]. Among studies using a 95th percentile TSH cutoff, prevalence estimates ranged from 0% to 2.9%, with meta-analysis yielding an overall pooled prevalence estimate of 1.50% [CI 0.51–2.71%]. Among studies following the ATA 2011 fixed TSH cutoffs, prevalence estimates ranged from 0.4% to 13.10%, with meta-analysis yielding an overall pooled prevalence estimate of 1.33% [CI 0.37–2.51%]. Among the remaining studies using a TSH cutoff >4.0 mIU/L, prevalence estimates ranged from 0% to 4.58%, with meta-analysis yielding an overall pooled prevalence estimate of 0.80% [CI 0.26–1.46%]. Meta-analysis results for these data are presented in Figure 2. Forest plots for all studies are available in Supplementary Figures S1–S5.
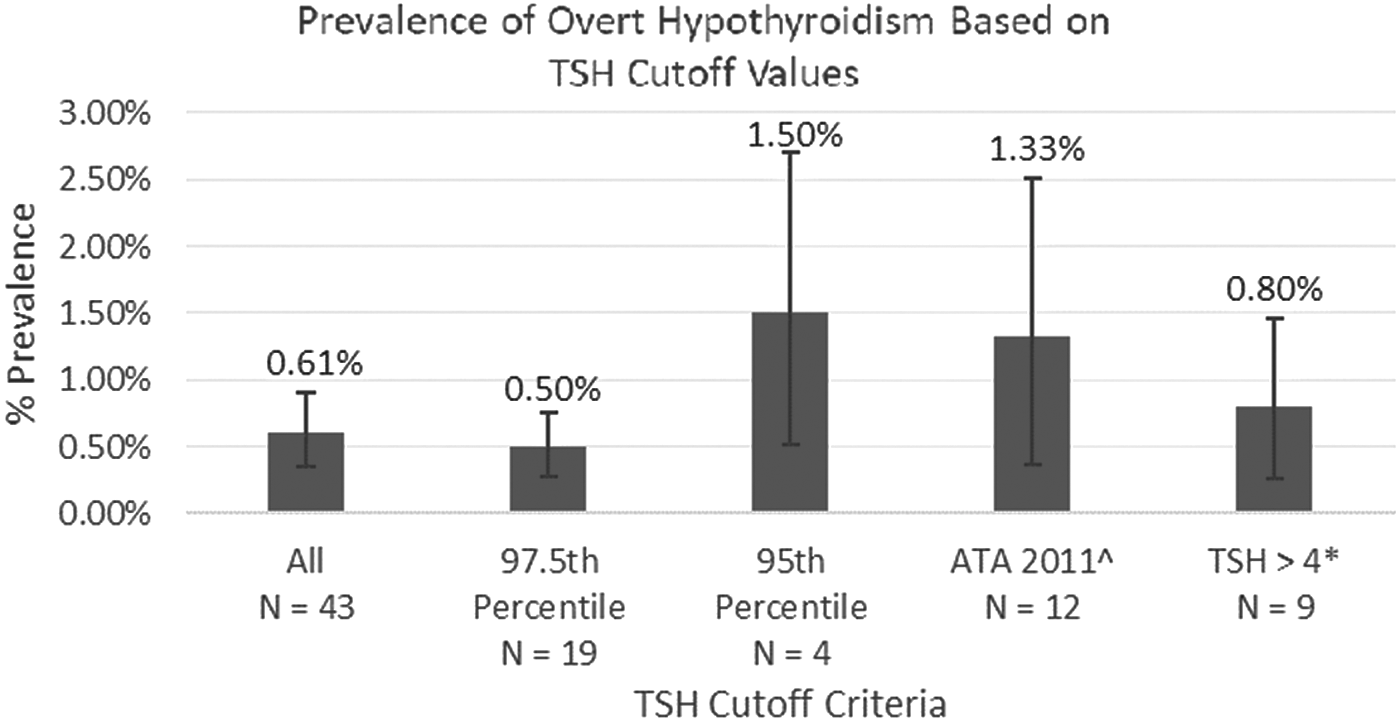
Pooled prevalence rates of overt hypothyroidism from analysis of studies using different thyrotropin (TSH) upper cutoff values. Error bars represent the confidence interval for each analysis. ^American Thyroid Association (ATA) 2011 fixed limits of 2.5 and 3.0 mIU/L in the first and second trimesters, respectively. *Includes studies with TSH upper limits of 4.2, 4.5, 4.5, 5, 5.5, 6, 6.16, and 10 mIU/L.
Prevalence of subclinical hypothyroidism
Prevalence estimates for subclinical hypothyroidism ranged from 1.50% to 42.90% among included studies. Meta-analysis yielded an overall pooled prevalence estimate of 5.10% [CI 3.11–7.28%]. Among studies using a 97.5th percentile TSH cutoff, prevalence estimates ranged from 1.90% to 11.30%, with meta-analysis yielding an overall pooled prevalence estimate of 3.47% [CI 2.85–4.11%]. Among studies using a 95th percentile TSH cutoff, prevalence estimates ranged from 3.4% to 11.70%, with meta-analysis yielding an overall pooled prevalence estimate of 3.89% [CI 2.44–5.52%]. Among studies following the ATA 2011 fixed TSH cutoffs, prevalence estimates ranged from 3.30% to 42.90%, with meta-analysis yielding an overall pooled prevalence estimate of 14.39% [CI 9.54–19.59%]. Among the remaining studies using a TSH cutoff >4.0 mIU/L, prevalence estimates ranged from 1.50% to 19.60%, with meta-analysis yielding an overall pooled prevalence estimate of 4.05% [CI 0.70–8.31%]. Meta-analysis results for these data are presented in Figure 3. Forest plots for all studies are available in Supplementary Figures S6–S10.

Pooled prevalence rates of subclinical hypothyroidism from analysis of studies using different TSH upper cutoff values. Error bars represent the confidence interval for each analysis. *Significantly greater than all other measurements [CI]. ∼Includes one study with a TSH upper limit of 2.6 mIU/L. ^Includes studies with TSH upper limits of 4.0, 4.2, 4.5, 4.6, 5, 5.5, 6, and 6.16 mIU/L.
Prevalence of isolated hypothyroxinemia
Prevalence estimates for isolated hypothyroxinemia ranged from 0.18% to 31.00% among included studies. Meta-analysis yielded an overall pooled prevalence estimate of 2.09% [CI 1.07–3.24%]. Among studies using a 2.5th to 97.5th percentile TSH reference range, prevalence estimates ranged from 1.00% to 9.40%, with meta-analysis yielding an overall pooled prevalence estimate of 2.05% [CI 1.29–2.87%]. Among studies using a 5th to 95th percentile TSH reference range, prevalence estimates ranged from 0.76% to 4.30%, with meta-analysis yielding an overall pooled prevalence estimate of 1.39% [CI 0–5.09%]. Among studies following the ATA 2011 fixed TSH cutoffs, prevalence estimates ranged from 0.18% to 31.00%, with meta-analysis yielding an overall pooled prevalence estimate of 3.26% [CI 0–10.53%]. Among the remaining studies using a reference range with the upper TSH cutoff >4.0 mIU/L, prevalence estimates ranged from 1.60% to 10.10%, with meta-analysis yielding an overall pooled prevalence estimate of 6.42% [CI 0.67–13.93%]. Meta-analysis results for these data are presented in Figure 4. Forest plots for all studies are available in Supplementary Figures S11–S15.
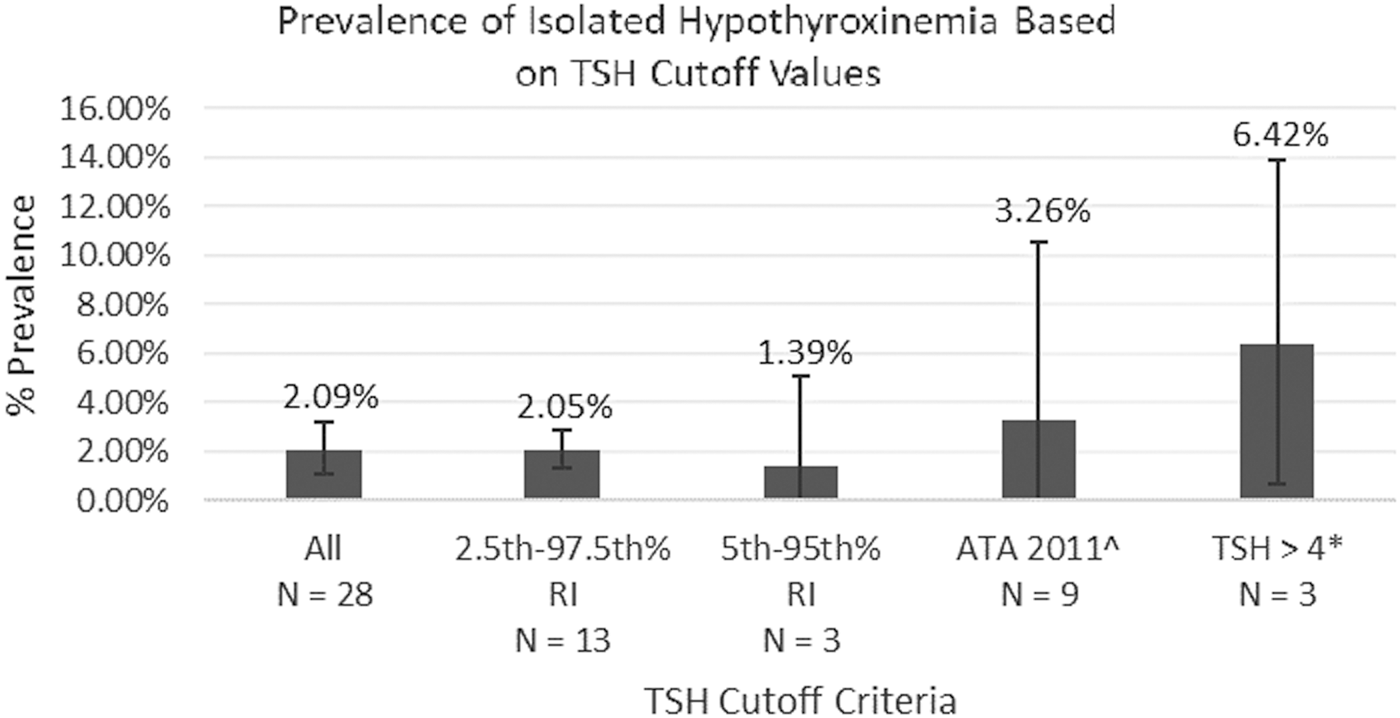
Pooled prevalence rates of isolated hypothyroxinemia from analysis of studies using different TSH reference ranges. Error bars represent 95% confidence interval for each analysis. ^ATA 2011 fixed limits of 2.5 and 3.0 mIU/L in the first and second trimesters, respectively. *Includes studies with reference ranges of 0.15–4.5, 0.2–4.5, and 0.27–4.2 mIU/L.
Prevalence of overt hyperthyroidism
Prevalence estimates for overt hyperthyroidism ranged from 0% to 2.50% among included studies. Meta-analysis yielded an overall pooled prevalence estimate of 0.64% [CI 0.30–1.02%]. Among studies with thyroid function testing done in the first trimester, prevalence estimates ranged from 0.30% to 2.50%, with meta-analysis yielding an overall pooled prevalence of 0.91% [CI 0.57–1.29%]. Among studies with thyroid function testing done in the second trimester, prevalence estimates ranged from 0% to 2.5%, with meta-analysis yielding an overall pooled prevalence estimate of 0.65% [CI 0.04–1.48%]. Meta-analysis results for these data are presented in Figure 5. Forest plots for all studies are available in Supplementary Figures S16–S18.
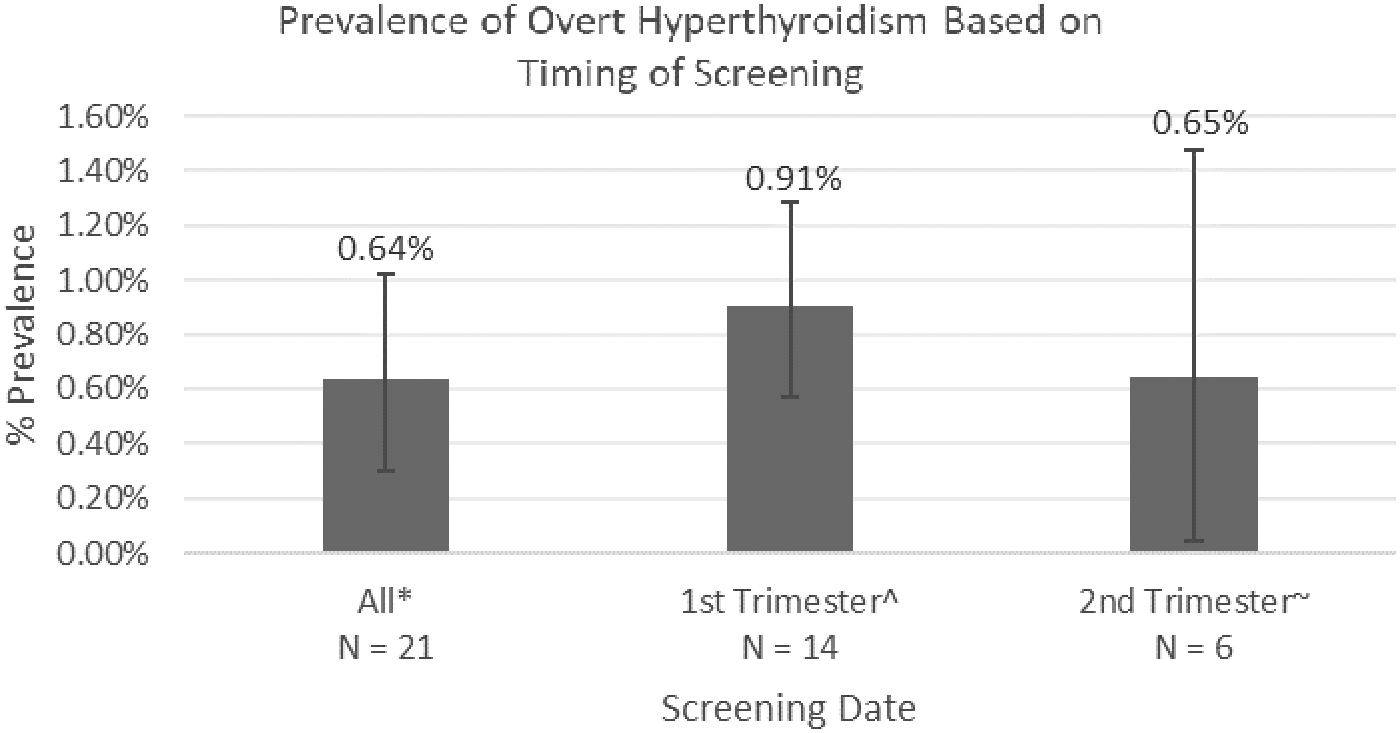
Pooled prevalence rates of overt hyperthyroidism from analysis of studies using different timings of thyroid function testing. Error bars represent the confidence interval for each analysis. *Includes one study with no data on screening timing and one study with first or third trimester screening. ^Includes one study with screening from 9 to 15 weeks of gestation. ∼Includes studies with screening ranging from 13 to 28 weeks of gestation.
Prevalence of subclinical hyperthyroidism
Prevalence estimates for subclinical hyperthyroidism ranged from 0.30% to 13.00% among included studies. Meta-analysis yielded an overall pooled prevalence estimate of 1.77% [CI 0.78–2.91%]. Among studies with thyroid function testing done in the first trimester, prevalence estimates ranged from 0.50% to 13.0%, with meta-analysis yielding an overall pooled prevalence of 2.18% [CI 0.87–3.72%]. Among studies with thyroid function testing done in the second trimester, prevalence estimates ranged from 0.22% to 4.17%, with meta-analysis yielding an overall pooled prevalence estimate of 0.98% [CI 0.30–1.81%]. Meta-analysis results for these data are presented in Figure 6. Forest plots for all studies are available in Supplementary Figures S19–S21.
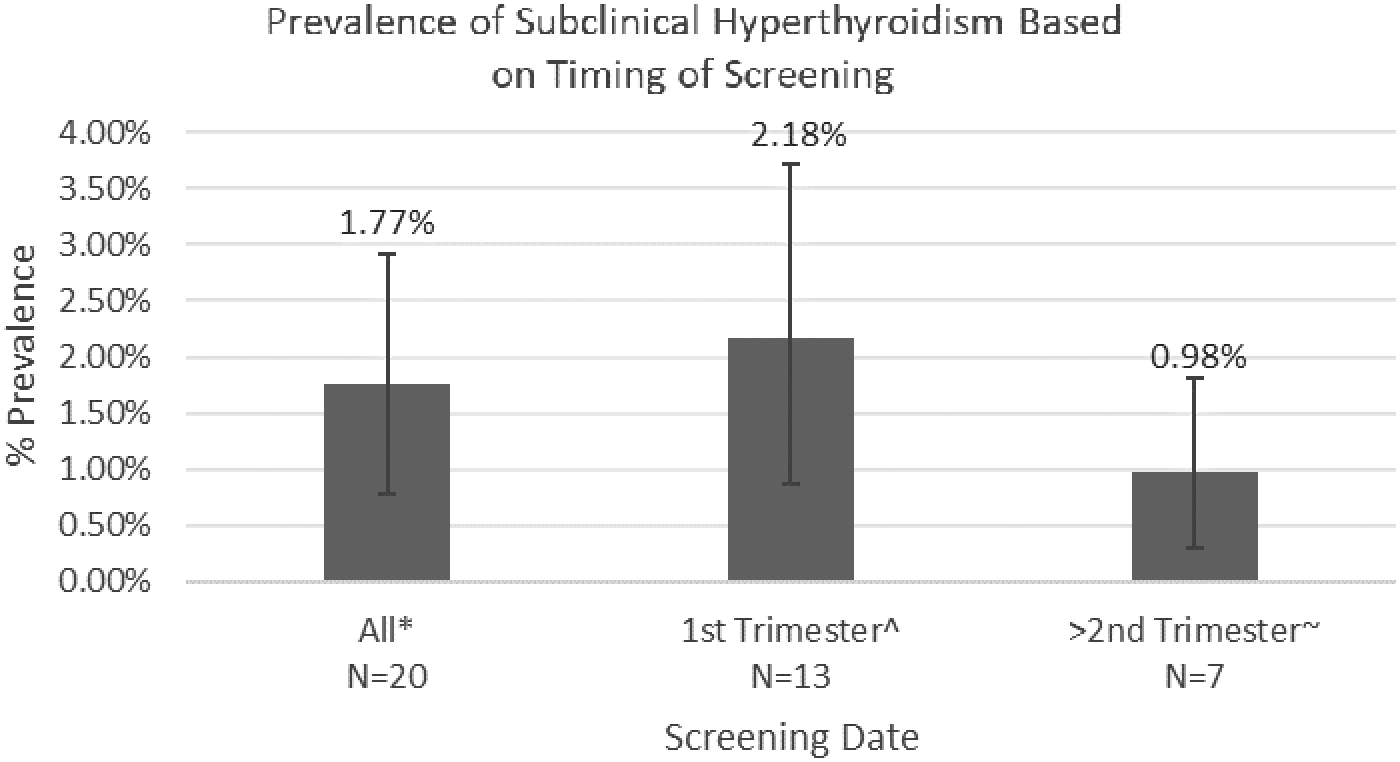
Pooled prevalence rates of subclinical hyperthyroidism from analysis of studies using different timings of thyroid function testing. Error bars represent the confidence interval for each analysis. *Includes one study with no data on screening timing and one study with first or third trimester screening. ^Includes one study with screening from 9 to 15 weeks of gestation. ∼Includes studies with screening ranging from 13 to 28 weeks of gestation.
Effects of bias
Most included studies were assessed to be of low or moderate risk of bias. Sensitivity analysis using a quality effects model resulted in similar results (data not shown). Studies rated as having a higher risk of bias tended to have a lower numbers of study participants. In general, these studies tended to have the widest CI prevalence estimate and were therefore weighted lower in the pooled prevalence calculation. Sensitivity analysis by manual exclusion of studies with the highest levels of uncertainty also did not change any of the results (data not shown).
Heterogeneity among studies
All analyses showed high levels of heterogeneity among studies, with all analyses having an I 2 statistic >75. Only the analysis of subclinical hypothyroidism prevalence when using the 95th percentile as an upper TSH cutoff had an I 2 statistic <80. Heterogeneity remained high for all analyses, even after exclusion of studies with the highest levels of uncertainty (data not shown).
Discussion
Prevalence data for thyroid disease in pregnancy varies dramatically from study to study based on multiple factors, including the year the study was performed, the criteria used to identify the normal range (sometimes informed by published guidelines and other times not), and the gestational age of screening. Due to this lack of standardization, currently an accepted rate of prevalence for overt hypothyroidism, subclinical hypothyroidism, isolated hypothyroxinemia, overt hyperthyroidism, or subclinical hyperthyroidism in pregnancy does not exist. The present study represents the first meta-analysis of prevalence of thyroid disease in pregnancy. By combining data from multiple studies and taking into consideration the timing and criteria used for screening, this study presents the most accurate estimate to date of the prevalence of thyroid disease in pregnancy. This information is needed to contextualize usage of newly released guidelines for current screening practice. In addition, an accurate measure of thyroid disease prevalence in pregnancy is needed to guide the debate on universal screening, as prevalence is an important measure of the impact a disease has on the population to be screened.
The data from the present study demonstrate a large degree of variability in prevalence rate in the published literature for each of the five thyroid disorders in pregnancy (Figures 2 –6). For example, Figure 2 breaks down the 43 studies that met the criteria for overt hypothyroidism into four categories: the 2011 ATA thyroid and pregnancy guidelines' fixed TSH cutoff, TSH values >4.0 mIU/L, population-derived 95th percentile, and population-derived 97.5th percentile. Meta-analysis of the 19 studies using the 97.5th percentile cutoff yielded a prevalence rate for overt hypothyroidism of 0.5%. As noted by the ATA 2011 and 2017 guidelines, population-based reference values are the most accurate method of diagnosing thyroid disease in pregnancy, as they account for differences in patient populations. Thus, it is this percentage that should become the accepted prevalence rate for overt hypothyroidism. Interestingly, the overall pooled prevalence of all 43 studies of overt hypothyroidism (irrespective of category of TSH cutoff) was 0.61%, very close to the 0.5% described above. Not surprisingly, meta-analysis of those studies using a TSH cutoff >95th percentile yielded a misleadingly high prevalence rate of 1.33%.
Similarly, based on diagnostic criteria, the 56 studies on subclinical hypothyroidism were divided into four categories (Figure 3). Meta-analysis of the 24 studies using the 97.5th percentile cutoff yielded a prevalence rate for subclinical hypothyroidism of 3.47%. Again, this represents the most accurate prevalence rate for this condition. Pooled analysis for all 56 studies yielded a prevalence rate for subclinical hypothyroidism of 5.10%, whereas analysis of studies using the 2011 ATA thyroid and pregnancy guidelines' fixed cutoff gave a prevalence of 14.39%. Both of these overstate the actual prevalence rate of subclinical hypothyroidism. In fact, the pooled prevalence rate for studies using the ATA 2011 fixed cutoffs for subclinical hypothyroidism is statistically significantly higher than those calculated from all other analyses, including the pooled prevalence calculated from all studies.
A total of 28 studies reported rates of isolated hypothyroxinemia, with an overall pooled prevalence rate of 2.09%. Meta-analysis of the 13 papers that utilized a population cutoff of the 97.5th percentile yielded a prevalence rate of 2.05%. Again, and not surprisingly, studies using the 2011 ATA thyroid and pregnancy guidelines' fixed cutoff report a higher prevalence rate of 3.26%.
In regard to hyperthyroidism, the initial hypothesis was that the prevalence of hyperthyroidism (both overt and subclinical) would be higher in the first trimester and decrease in the second trimester as hCG levels fell. Meta-analysis of all 21 studies of overt hyperthyroidism yielded a prevalence rate of 0.64%, which when divided into trimesters demonstrated results of 0.91% in the first trimester and 0.65% in the second trimester. Similarly, meta-analysis for subclinical hyperthyroidism revealed a prevalence rate of 1.77% for all 20 studies, which was broken down into 2.18% in the first trimester and 0.98% in the second trimester. Although, as postulated, prevalence rates decreased from the first trimester to the second trimester for both overt and subclinical hyperthyroidism, the differences were not statistically significant.
As noted recently by Fraenkel et al., women who appear clinically and biochemically hyperthyroid early in pregnancy but who have normal thyroid function testing by the time of delivery do not appear to suffer any adverse pregnancy outcomes (25). This suggests that diagnosis of hyperthyroidism in the first trimester may overestimate the true prevalence of clinically relevant disease by including a subset of patients with thyroid symptoms representing a physiological change in pregnancy rather than true disease.
Utilizing the 97.5th percentile as the criteria for diagnosing overt hypothyroidism (0.5%), subclinical hypothyroidism (3.47%), and isolated hypothyroxinemia (2.05%), and separating overt and subclinical hyperthyroidism by trimester (0.91% and 2.18%, respectively, in the first trimester and 0.65% and 0.98%, respectively, in the second trimester) results in clear prevalence rates for each of these disorders. It also serves to remove the confusion that presently exists in the literature where prevalence rates vary widely based on diagnostic criteria utilized and the timing of screening.
As with all systematic reviews and meta-analyses, a limitation of this study is the possibility of an incomplete search strategy. However, by not limiting the literature database search terms to only studies including “prevalence” as a key word, many additional studies that did not aim to determine prevalence, but reported it nonetheless, were included in this analysis. Only one reviewer was involved in the study selection and data extraction, which may increase the odds of errors in the review process. However, a review of prevalence is less vulnerable to differences in reviewer opinion on study inclusion and data extraction, as determining whether a study reports prevalence is generally not a subjective decision. Methodological bias is also less of a concern with prevalence studies, as unlike comparative studies, sources of bias are limited to study population, sample size, sample selection, and, importantly, method and timing of classification, which were specifically considered in subgroup analysis for this study. A quality effects model considering the other variables did not alter results significantly, suggesting that bias did not have a large effect on the results of this study. Heterogeneity between studies was very high, though this was not unexpected, as the prevalence of thyroid disease in pregnancy varies from population to population, possibly due to differences in iodine status, autoimmunity, genetics, and other environmental factors.
In conclusion, the present study, by utilizing population-based screening with a 97.5th percentile cutoff for hypothyroidism and considering timing of screening for hyperthyroidism, determined clear prevalence rates for thyroid disorders in pregnancy. Using these criteria, the following prevalence rates were defined: 0.50% for overt hypothyroidism; 3.47% for subclinical hypothyroidism; 2.05% for isolated hypothyroxinemia; 0.91% and 0.65% in the first and second trimesters, respectively, for overt hyperthyroidism; and 2.18% and 0.98% in the first and second trimesters, respectively, for subclinical hyperthyroidism. This study suggests a need for increased availability of population-based, trimester-specific reference values for TSH in pregnancy and less reliance on fixed cutoffs such as those provided in the 2011 and 2017 ATA thyroid and pregnancy guidelines.
Footnotes
Acknowledgments
The authors thank Kayeromi Gomez for his help with statistical methods and analysis.
Author Disclosure Statement
All authors declare that no competing financial interests exist.