
Abstract
Background:
Medullary thyroid carcinoma (MTC) presents a disproportionate number of thyroid cancer deaths due to limited treatment options beyond surgery. Gain-of-function mutations of the human REarranged during Transfection (RET) proto-oncogene have been well-established as the key driver of MTC tumorigenesis. RET has been targeted by tyrosine kinase inhibitors (TKIs), such as cabozantinib and vandetanib. However, clinical results have been disappointing, with regular dose reductions and inevitable progression. This study aimed to identify RET-regulated microRNAs (miRNAs) and explore their potential as novel therapeutic targets.
Methods:
Small RNA sequencing was performed in MTC TT cells before and after RET inhibition to identify RET-regulated miRNAs of significance. In vitro gain-of-function studies were performed to investigate cellular and molecular effects of potential miRNAs on cell phenotypes. Systemic delivery of miRNA in MTC xenografts using EDV™ nanocells, targeted to epidermal growth factor receptor on tumor cells, was employed to assess the therapeutic potential and possible modulation of TKI responses.
Results:
The study demonstrates the tumor suppressive role of a specific RET-regulated miRNA, microRNA-153-3p (miR-153-3p), in MTC. Targeted intravenous delivery of miR-153-3p impeded the tumor growth in MTC xenografts. Furthermore, combined treatment with miR-153-3p plus cabozantinib caused greater growth inhibition and appeared to reverse cabozantinib resistance. Mechanistically, miR-153-3p targets ribosomal protein S6 kinase B1 (RPS6KB1) of mTOR signaling and reduced downstream phosphorylation of Bcl-2 associated death promoter.
Conclusion:
This study provides evidence to establish systemic miRNA replacement plus TKIs as a novel therapeutic for patients with metastatic, progressive MTC.
Introduction
Medullary thyroid carcinoma (MTC) originates from a small population of calcitonin-secreting parafollicular C-cells of the thyroid gland. Around 75% of MTC occurs in a sporadic form (SMTC), and the remaining 25% of the malignancy is hereditary MTC (HMTC) (1). Patients with MTC have a disproportionately high mortality when compared to the majority of other thyroid cancer types (2,3), since surgery remains the only curative treatment at present. Half of patients will develop residual disease (persistent or recurrent) requiring reoperation, which carries significant risk and complications (1).
Activating mutations of the human REarranged during Transfection (RET) proto-oncogene has been well established as the key driver of MTC tumorigenesis (4). RET encodes a receptor tyrosine kinase (RTK) and is involved in regulating vital cellular processes, such as cell proliferation, differentiation, cell growth, and survival (5). Upon activation, RET is auto-phosphorylated on tyrosine residues, which serve as docking sites for adaptor molecules. This leads to activation of p38 mitogen-activated protein kinase (MAPK) and phosphatidylinositol 3-kinase (PI3K)-Akt pathways (6). This knowledge has prompted the development and use of RET tyrosine kinase inhibitors (TKIs), such as cabozantinib and vandetanib, for the treatment of advanced, progressive MTC (7 –9). In a double-blind, Phase III trial, patients receiving cabozantinib achieved a significant progression-free survival (PFS) prolongation of 7.2 months compared to placebo (7). The one-year PFS rate for patients receiving cabozantinib was 47.3% versus 7.2% in the placebo group. However, there was no improvement in overall survival with cabozantinib treatment. Adverse events associated with cabozantinib resulted in dose reductions in 79% of patients and led to treatment discontinuation in 16% of patients (7). Likewise, in the Phase III trial for vandetanib, an estimated PFS of 30.5 months with vandetanib relative to the placebo of 19.3 months was identified (8). A statistically significant difference in the objective response rate between vandetanib (45%) and placebo (13%) was also observed. Thirty-five percent of patients receiving vandetanib required a dose reduction because of adverse events, while 12% of patients with vandetanib discontinued treatment (8).
Recent studies of microRNAs (miRNAs) have revealed their regulatory functions in cancer development, progression, and metastasis (10,11). miRNAs also appear as specific partners for RTK in mediating signaling relevant to cancer, for example miR-30b/c, miR-221/miR-222, and miR-27a were specifically modulated by oncogenic mutations of epidermal growth factor receptor (EGFR) and/or hepatocyte growth factor receptor (c-MET) RTKs in lung cancer, and the modulation impacts a significant role on resistance to the EGFR inhibitor gefitinib (12,13). miRNA studies in MTC have been challenging, mainly due to the lack of normal C-cell tissue as a differential expression comparator. To date, no miRNA that has been shown to act as a tumor driver in MTC, although differentially expressed miRNAs have been identified between SMTC and HMTC (14), or in metastatic lymph nodes when compared to primary tumors (15,16), or in MTC versus non-tumor thyroid tissues (17 –19). More recently, Chu et al. demonstrated strong expression of miR-21 (miR-21-5p, miRBase v22) in primary MTC tissues using miRNA in situ hybridization, and the inhibition of miR-21 significantly reduced cell proliferation and invasion (20). Spitschak et al. also showed overexpression of miR-182 in MTC, activated by highly aggressive RET mutations in a nuclear factor kappa-light-chain-enhancer of activated B cells (NF-κB)-dependent manner, exerts its oncogenic capacity through loss of tumor suppressive Hes Family BHLH Transcription Factor 1 (HES1)/Notch 1 signaling loop (21).
Given the significant activation of RET in MTC pathogenesis, this study explored how RET signaling could potentially modulate miRNAs in MTC. This study identified RET-regulated miRNAs via RET activity inhibition. It demonstrates that miR-153-3p acts as a tumor suppressor in MTC tumorigenesis and modulation of TKI responses by targeting ribosomal protein S6 kinase B1 (RPS6KB1) of mTOR signaling. Furthermore, intravenous manipulation of miR-153-3p levels using targeted nanocells in combination with cabozantinib may have significant therapeutic potential for advanced MTC.
Methods
Cell culture, clinical sample collection, and TKIs
The human MTC TT cell line (cat. # CRL-1803), harboring a RET C634W, was purchased from the American Type Culture Collection (ATCC, Manassas, VA). Authentication of the cell-line identity was performed using short tandem repeat (STR) profiling by CellBank Australia (Children's Medical Research Institute, Westmead, Australia). Cells were cultured in Ham's F12 media, Kaighn's modification (HyClone; GE Healthcare Life Sciences, Logan, UT) supplemented with 10% fetal bovine serum (FBS; AusGeneX, Molendinar, Australia), and in humidified conditions with 5% CO2 at 37°C. Cells were confirmed mycoplasma free.
De-identified, snap-frozen MTC tissue samples for validation of miRNA expression were obtained from the Neuroendocrine Tumor Bank of the Kolling Institute of Medical Research. All samples were from surgical resections, and the diagnosis for all samples was confirmed by pathological examination. Clinical information for these patients was collated from the prospectively maintained University of Sydney, Endocrine Surgical Unit database, medical records, and pathology reports.
Cabozantinib was purchased from Selleck Chemicals (Houston, TX) and dissolved in dimethyl sulfoxide at a concentration of 200 mM as stock solution according to the manufacturer's recommendation. For in vivo studies, cabozantinib was formulated in sterile water/10 mmol/L HCl, and administered via oral gavage at 10 mg/kg body weight.
miRNA transfection
Cells were transfected with a final concentration of 40 nM of synthetic miRNA mimics (mirVana miRNA mimics; Thermo Fisher Scientific, Waltham, MA) corresponding to the mature miR-153-3p sequences 5′-UUG CAU AGU CAC AAA AGU GAU C-3′ (cat. # 4464070, product ID MC10122) or a negative control scrambled miRNA sequences (miR-NC, cat. # 4464061) using Lipofectamine RNAiMax (Thermo Fisher Scientific) according to the manufacturer's instructions. Cells were transfected when they were 50–70% confluent on day 0, and two days later a second transfection was performed.
Small RNA sequencing
Small RNA sequencing was performed by the Australian Genome Research Facility (AGRF, Parkville, Australia) with an Illumina HiSeq 2000 platform for production of a 50 bp single end run. Enriched small RNAs were extracted from MTC cells using the miRNeasy Mini Kit (Qiagen, Hilden, Germany). RNA libraries were prepared using Illumina's TruSeq small RNA protocol. Primary bioinformatics and miRNA differential expression analysis were processed according to the AGRF set workflow platforms. The sequencing data used in this study are available from the Sequence Read Archive (accession SRP150290).
Quantitative reverse transcription polymerase chain reaction
The expression level of miRNA/mRNA was measured with quantitative reverse transcription polymerase chain reaction (RT-qPCR) using TaqMan miRNA/gene expression assays (Thermo Fisher Scientific) according to the manufacturer's protocols. Quantification of all PCR products was performed with a ABI 7900HT Real-Time PCR System (Applied Biosystems, Foster City, CA) under standard cycling conditions. Relative expression (RQ) was obtained by the ΔΔCt method using RQ Manager v1.2.1 (Applied Biosystems).
Protein extraction and Western blotting
Cells were lysed using radioimmunoprecipitation assay buffer (Sigma–Aldrich, St. Louis, MO), and total protein concentration was quantified using the BCA Protein Assay Kit (Pierce Biotechnology, Rockford, IL). Denatured protein lysate (10–30 μg) was electrophoresed on precast 4–12% Bis-Tris gels (Life Technologies, Carlsbad, CA). Separated proteins were transferred to nitrocellulose membranes followed by blocking in Tris-buffered saline with 0.1% Tween 20 (TBST) containing 5% bovine serum albumin or skim milk. The WesternBright Quantum Detection Kit (Advansta, Inc., Menlo Park, CA) was used to visualize the detected proteins by a LAS4000 digital imaging system (Fujifilm, Tokyo, Japan), and proteins were quantified using MultiGauge software v3.0 (Fujifilm). Antibodies were purchased from Cell Signaling Technology (Beverly, MA): GAPDH (#2118), phospho-p44/42 MAPK (ERK1/2, Thr202/Tyr204, #9101), p44/42 MAPK (ERK1/2, #9102), cleaved poly ADP-ribose polymerase (cPARP, #5625), PARP (#9542), p70 S6 kinase (RPS6KB1, #9202), phospho-BAD (Ser112, #9291), and Bcl-2-associated death (BAD; #9292).
Cell proliferation
Cell proliferation was measured by the absorbance at 490 nm using CellTiter 96 Aqueous One Solution Cell Proliferation Assay according to the manufacturer's instruction (MTS Assay; Promega, Madison, WI). Cells (n = 15,000/well) were cultured on a 96-well plate and transfected with miRNA mimics simultaneously (reverse transfection). Two days later, the second transfection was performed.
Cell cycle and apoptosis
Cells were collected 72 hours post transfection, washed with phosphate-buffered saline twice, and stained with propidium iodide (Sigma–Aldrich) at a final concentration of 17.4 μg/mL. Cells were analyzed using fluorescence-activated cell sorting analysis (FACS Calibur; BD Biosciences, San Jose, CA), and data were analyzed using ModFit LT software (Verity Software House, Topsham, ME). The apoptosis analysis was determined by PE Annexin V kit (PharMingen, BD Biosciences). Cells were stained with PE Annexin V and 7-AAD, and data were analyzed using CellQuest Pro software (BD Biosciences).
Cell migration and invasion
The ability of cells to migrate or invade through a polycarbonate membrane (8 μm pore size) was measured using CytoSelect 24-well cell migration and invasion assay kit (Cell Biolabs, Inc., San Diego, CA) according to the manufacturer's protocol.
EDV™ nanocell preparation
In vivo grade miRNA mimics were packaged into the EDV™ (EnGeneIC Dream Vector; EnGeneIC Ltd., Lane Cove West, Australia) nanocells for systemic delivery with overnight incubation, and loaded EDVs were then coated with bi-specific monoclonal antibodies (BsAb) directed toward human EGFR for one hour at 24°C, as previously reported (22,23). The number of EGFRs on TT cells was quantified by flow cytometry, Quantum Simply Cellular Antibody Binding Capacity anti-mouse IgG beads (Bangs Laboratories, Inc., Fishers, IN) to generate a standard curve of relative signal intensity values. Cells were incubated with both anti-EGFR-AF488 and mouse IgG-FITC isotope control, and the complex was analyzed on a Beckman Coulter Gallios flow cytometer. The mean receptor number was calculated using the equation derived from the standard curve.
Mouse xenografts
Protocols for in vivo experiments in female athymic (nu/nu) mice (5–6 weeks old) were approved by the EnGeneIC Animal Ethics Committee. To create MTC xenografts, TT cells (1 × 10⁷ cells in 100 μL serum free F12K medium) together with 100 μL Matrigel™ Basement Membrane Matrix Growth Factor Reduced, phenol red free (BD Biosciences), which contains <0.5 ng/mL of EGF, were inoculated subcutaneously into the left flank of each mouse.
Histopathology and immunohistochemistry
Mouse euthanasia was performed by CO2 inhalation 24 hours following the final treatment based on ethical approval. The xenografts and internal organs were excised, snap frozen in liquid nitrogen, and stored at −80°C. Histopathology on formalin-fixed samples following hematoxylin and eosin staining and immunohistochemistry was performed by a pathologist blinded to the treatment group.
Serum calcitonin measurement
Immediately after the euthanasia, mouse serum samples were obtained by cardiac puncture, and human calcitonin in mouse serum was measured by electrochemiluminescence immunoassay (Elecsys Calcitonin; Roche, Basel, Switzerland) using a Roche Cobas E601 instrument. Briefly, 50 μL of serum sample, a biotinylated monoclonal human calcitonin-specific antibody and a ruthenium-labeled monoclonal calcitonin-specific antibody, was incubated for nine minute. Streptavidin-coated microparticles were added, and the complex was incubated for another nine minutes prior to the measurement of chemiluminescent emission by a photomultiplier.
Statistics
Unless otherwise stated, values represent the mean ± standard error of the mean. Statistics were calculated using Prism Software v7.0 (GraphPad Software, Inc., La Jolla, CA) using Student's t-test for parametric data and Mann–Whitney test for nonparametric data. Differences in gene expression were assessed by t-test using DataAssist v3.01 (Applied Biosystems). Statistical significance was set as p < 0.05.
Study approval
Human ethics for this study were approved from the Northern Sydney Local Health District Human Research Ethics Committee. For all human samples used in experiments, informed consent was obtained from all patients at the time of surgery. Protocols for in vivo experiments were approved by the EnGeneIC Animal Ethics Committee.
Results
Small RNA sequencing identifies RET-regulated miRNAs in MTC
In order to identify RET-regulated miRNAs in MTC, RET activity was inhibited in MTC cells using either RET siRNA or cabozantinib. Small RNA sequencing for miRNA expression profile before and after RET inhibition was then carried out. Inhibition of RET activity was demonstrated by reduced expression of phosphorylated extracellular signal-regulated kinase (ERK) protein (Supplementary Fig. S1). Among RET siRNA knockdown cells, 13 miRNAs were identified to be differentially expressed before and after RET knockdown with an absolute fold change (FC) greater than two (p < 0.05). Similarly, 14 miRNAs were identified following RET inhibition using cabozantinib. Ten miRNAs were differentially expressed following both siRNA and cabozantinib, where eight miRNAs—miR-153-3p, miR-1277-5p, miR-29a-3p, miR-188-5p, miR-484, miR-598-3p, miR-324-3p, and miR-21-3p—were upregulated following RET inhibition, and two miRNAs—miR-27b-5p and miR-92a-1—were downregulated (Fig. 1A and Table 1).
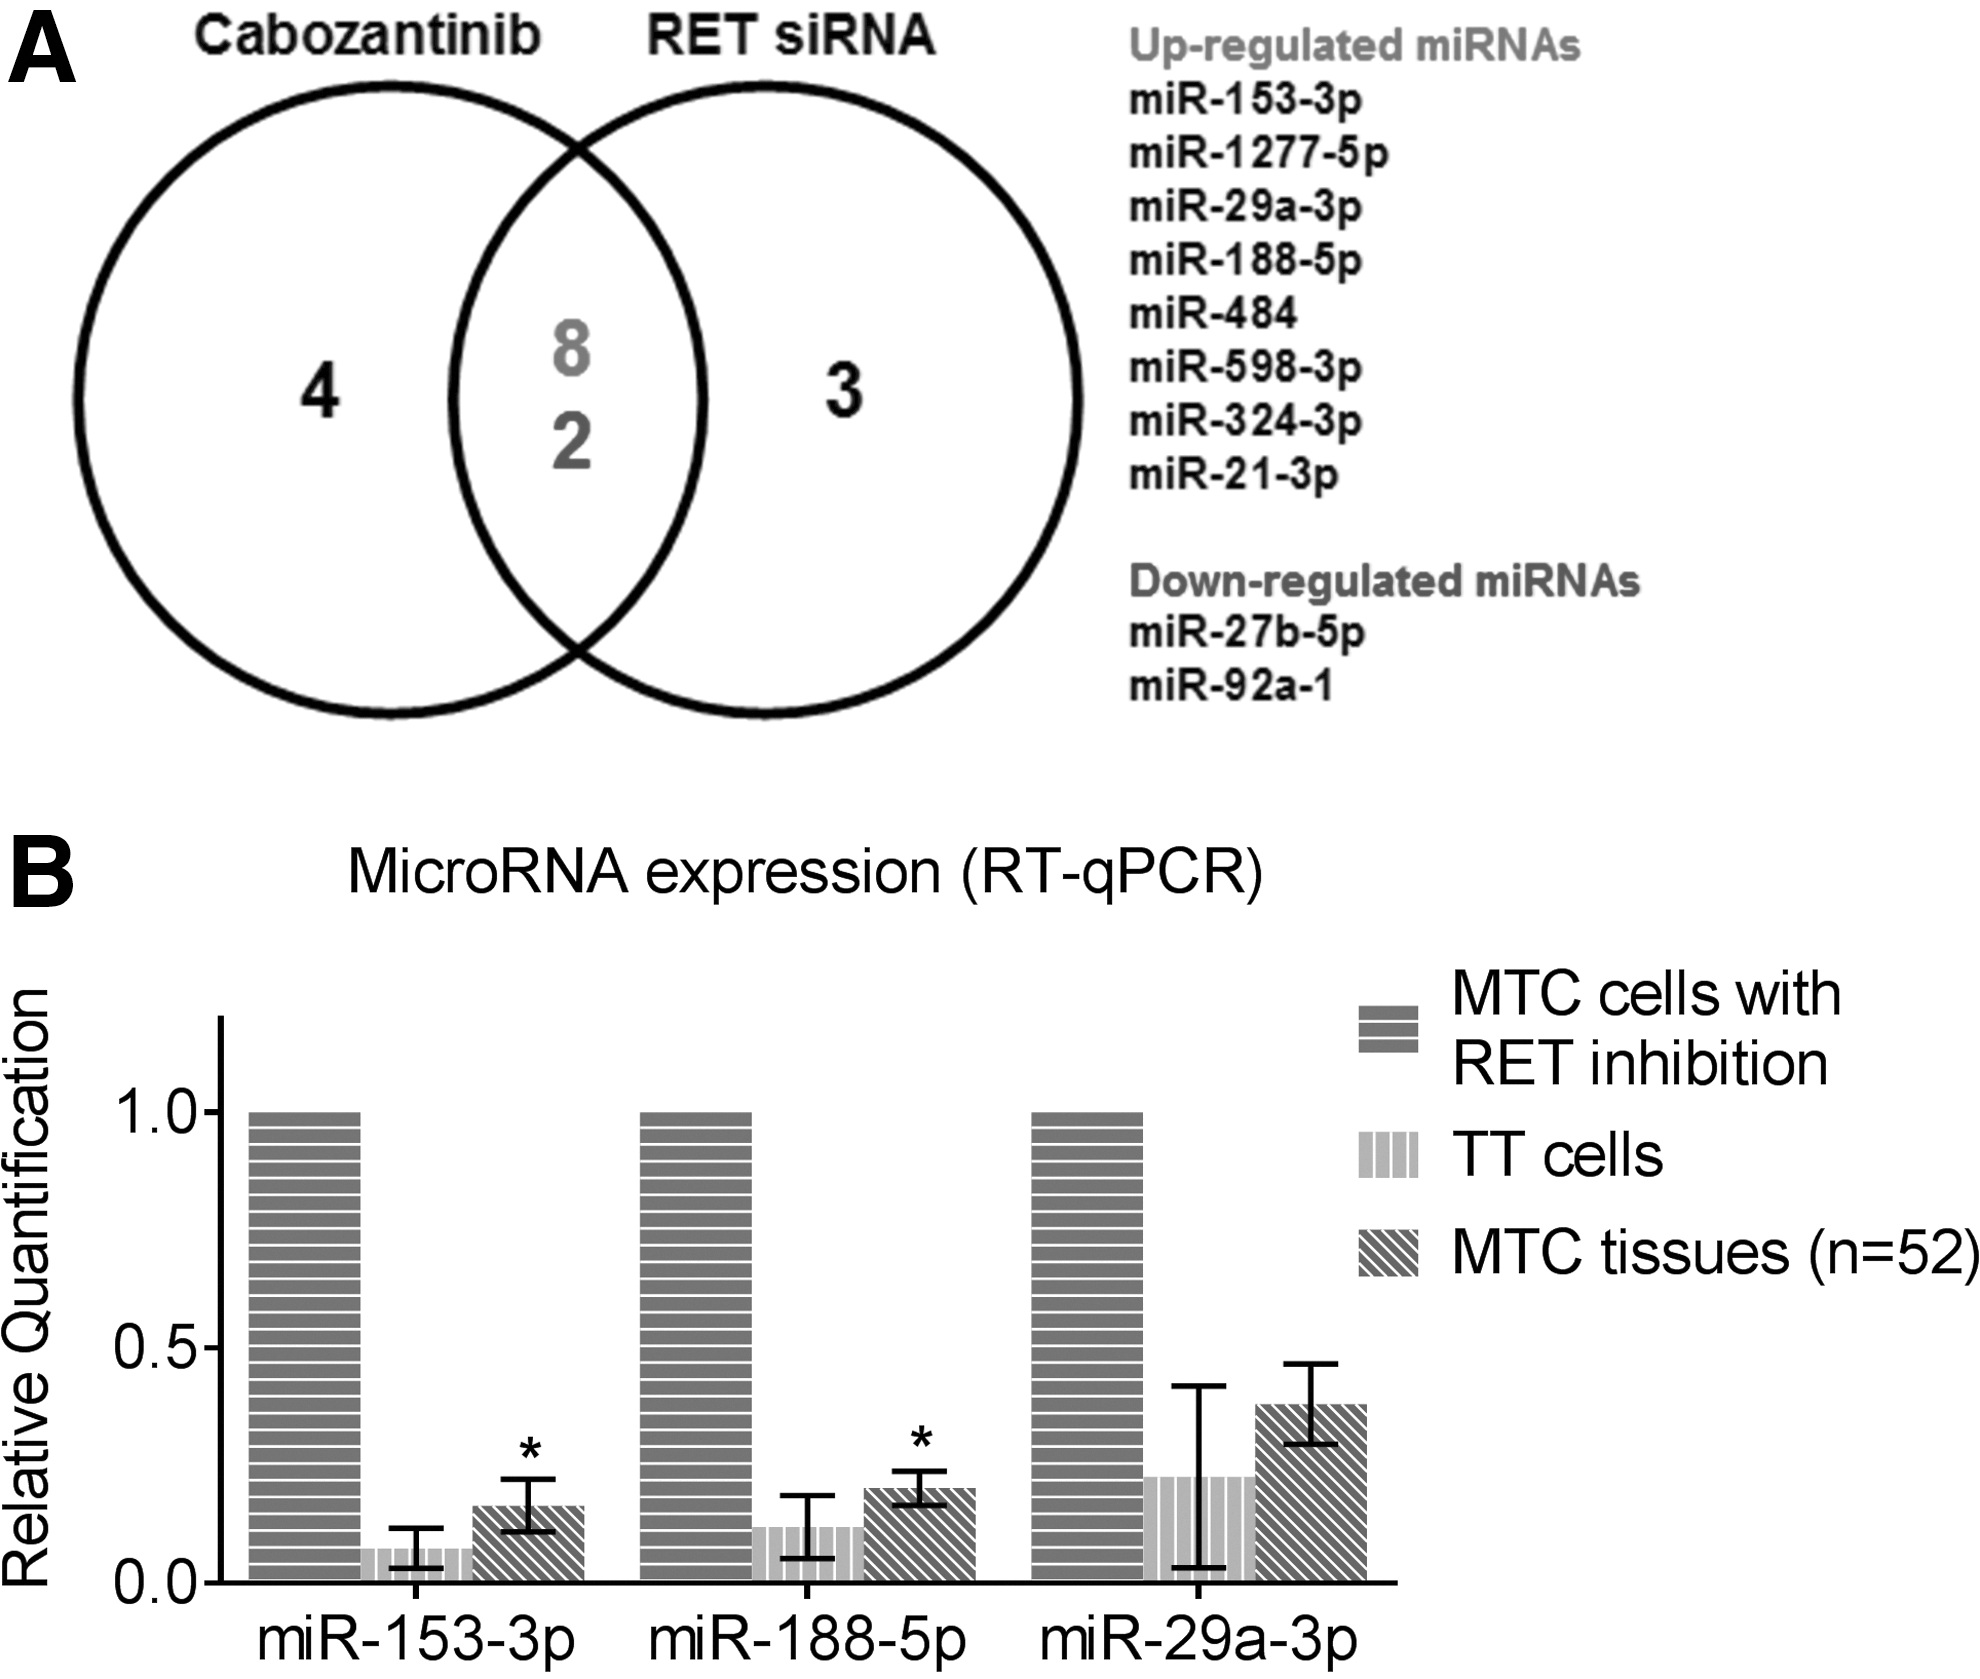
Identification of REarranged during Transfection (RET)-regulated miRNAs in medullary thyroid carcinoma (MTC). (
Common Differentially Expressed miRNAs Following RET Inhibition by Both RET siRNA and Cabozantinib in MTC Cells
Small RNA sequencing with Illumina HiSeq 2000 platform identified miRNAs that are differentially expressed following REarranged during Transfection (RET) inhibition in medullary thyroid carcinoma (MTC) cells. Listed are miRNAs with at least a twofold change and corrected p < 0.05.
Further validation of dysregulated miRNAs was carried out on a large cohort of MTC tissue samples (n = 52) using the RT-qPCR technique. The available genetic and clinicopathologic data for 39 patients are summarized in Table 2. The selection of miRNAs for validation was based on the range of absolute FC following RET inhibition, together with published significance in other cancers. miR-153-3p had the greatest absolute FC of 4.7, and was under-expressed in several cancer types such as glioblastoma and lung and hepatocellular carcinoma (24 –28). miR-188-5p (absolute FC 2.7) is a well-known tumor suppressor in multiple myeloma, hepatocellular carcinoma, prostate cancer, and oral squamous-cell carcinoma, and acts through suppression of cell proliferation, metastasis, and invasion (29 –32). miR-29a-3p (absolute FC 2.6) is associated with proliferation and migration in gastric cancer (33), and regulates cancer-associated genes in colorectal cancer (34). These three miRNAs were all confirmed to be significantly under-expressed in MTC tissues compared to MTC cells where RET activity was inhibited (Fig. 1B), corresponding to the findings of small RNA sequencing. Since miR-153-3p demonstrated a maximal upregulation of 4.7-fold in the RNA sequencing, it was selected for further investigation of its functional role in MTC tumorigenesis and therapeutic potential.
Genetic and Clinicopathologic Characteristics of MTC Patients
F, female; M, male; H, hereditary; S, sporadic with somatic mutation; -, sporadic with no somatic mutations; Y, yes; N, no; blank, data not available.
The expression of the three miRNAs in the MTC cohort was also analyzed based on the clinical data of tumor recurrence, lymph node metastasis, venous invasion, and RET mutation status. miR-188-5p showed an under-expression in recurrent MTC patients (p = 0.04; FC 2.3) (Fig. 2A). miR-29a-3p demonstrated an under-expression in SMTC patients with somatic RET mutation when compared to SMTC patients without any RET mutation (p = 0.03; FC 1.3; Fig. 2B). However, no significant association between the expression of miR-153-3p and the clinical outcomes and RET mutation status was observed (Fig. 2C).
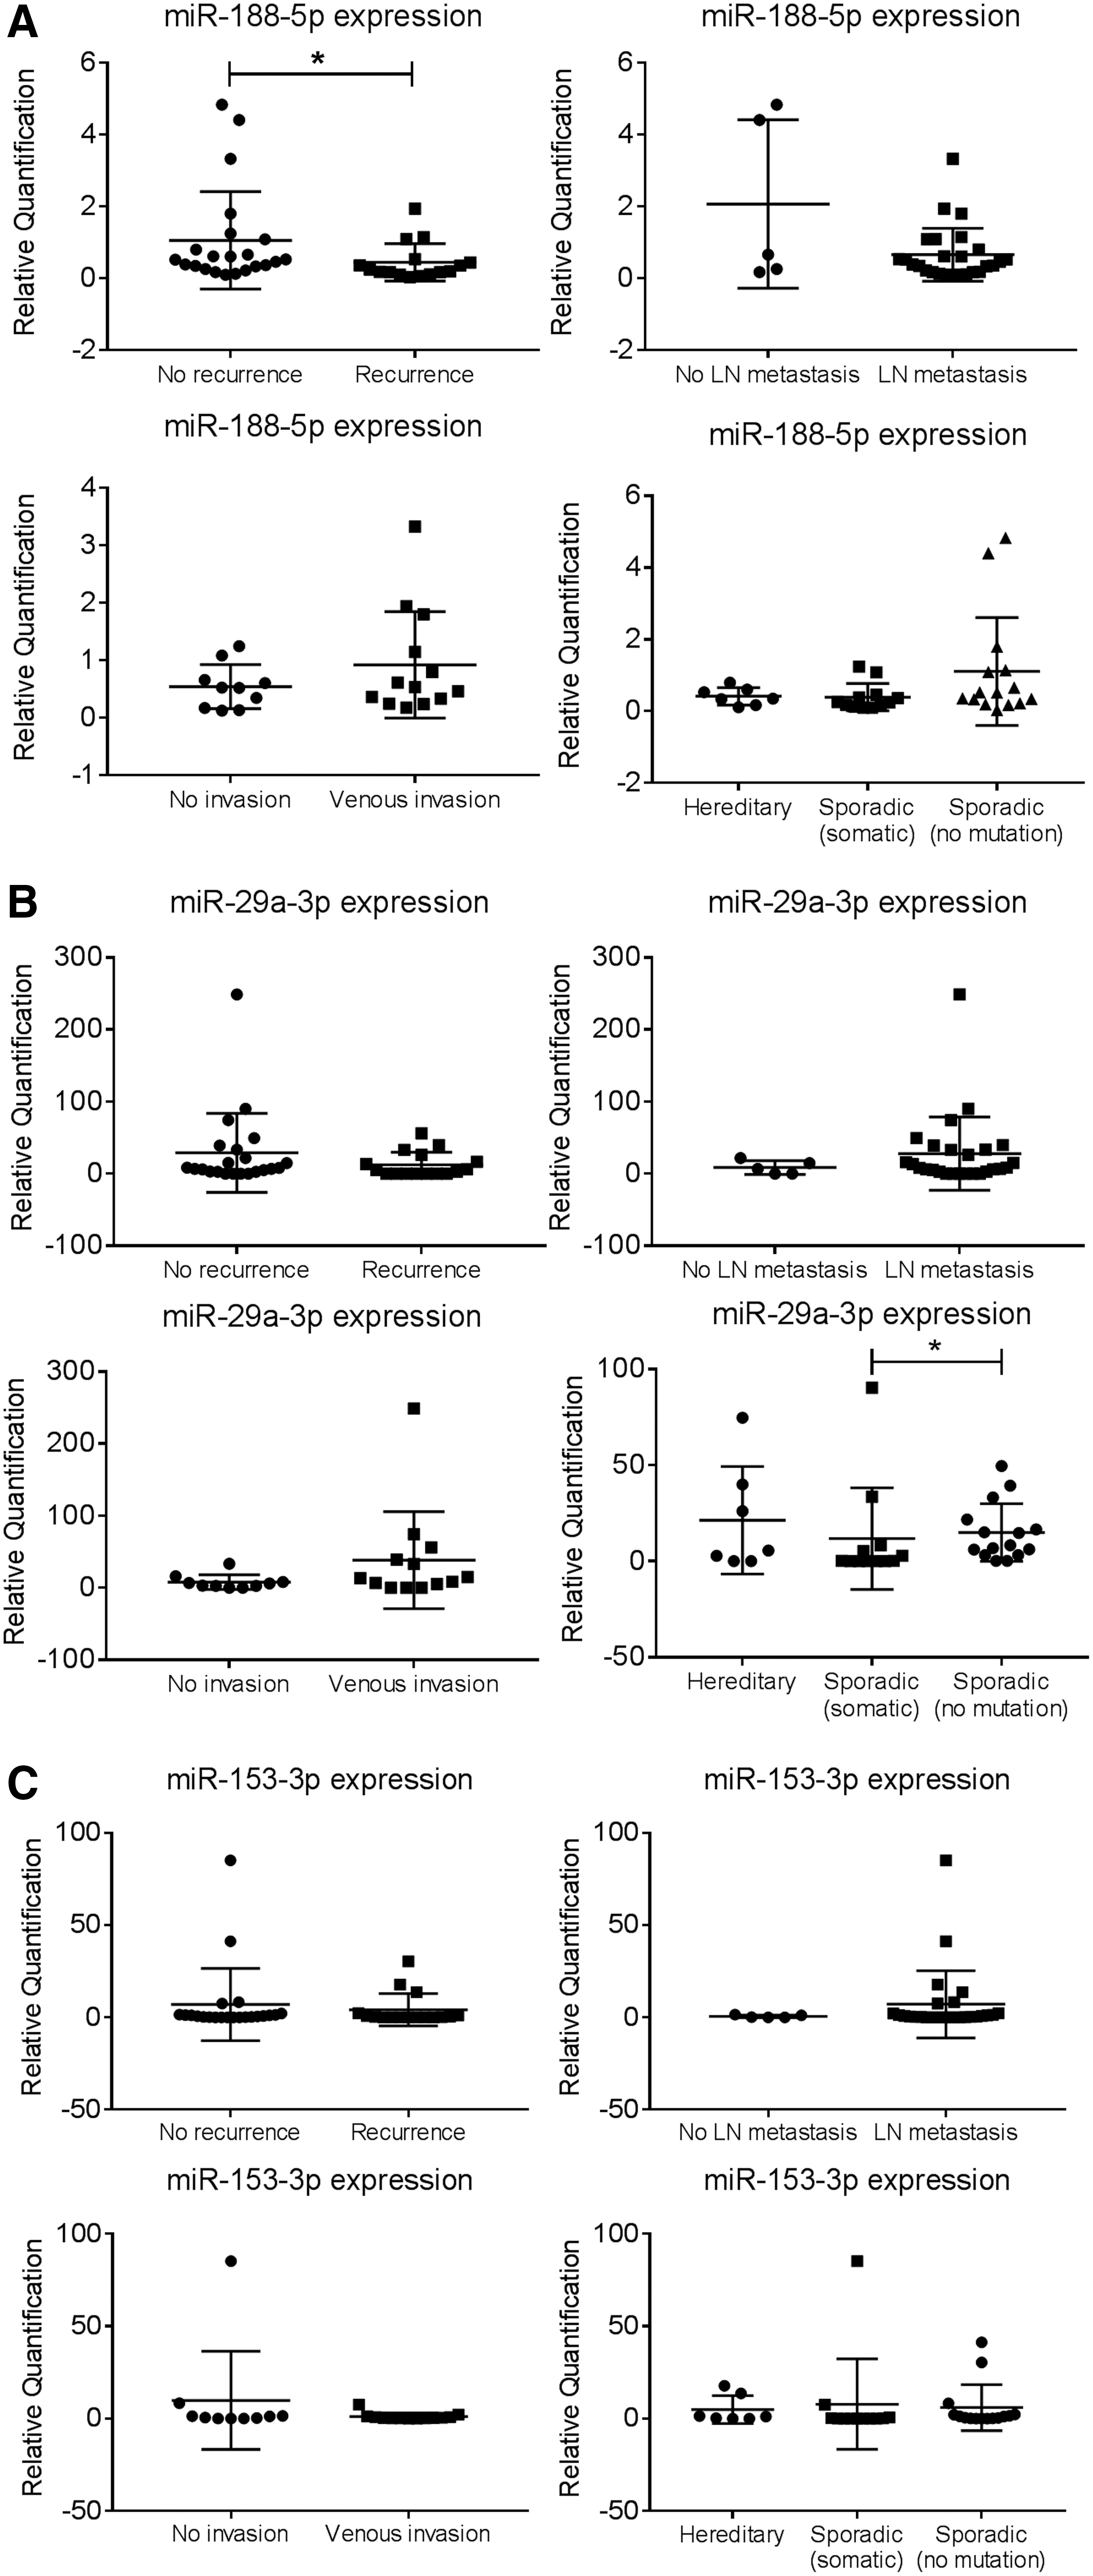
Correlation between expression of candidate miRNAs and clinical data of MTC patients. Expression level of (
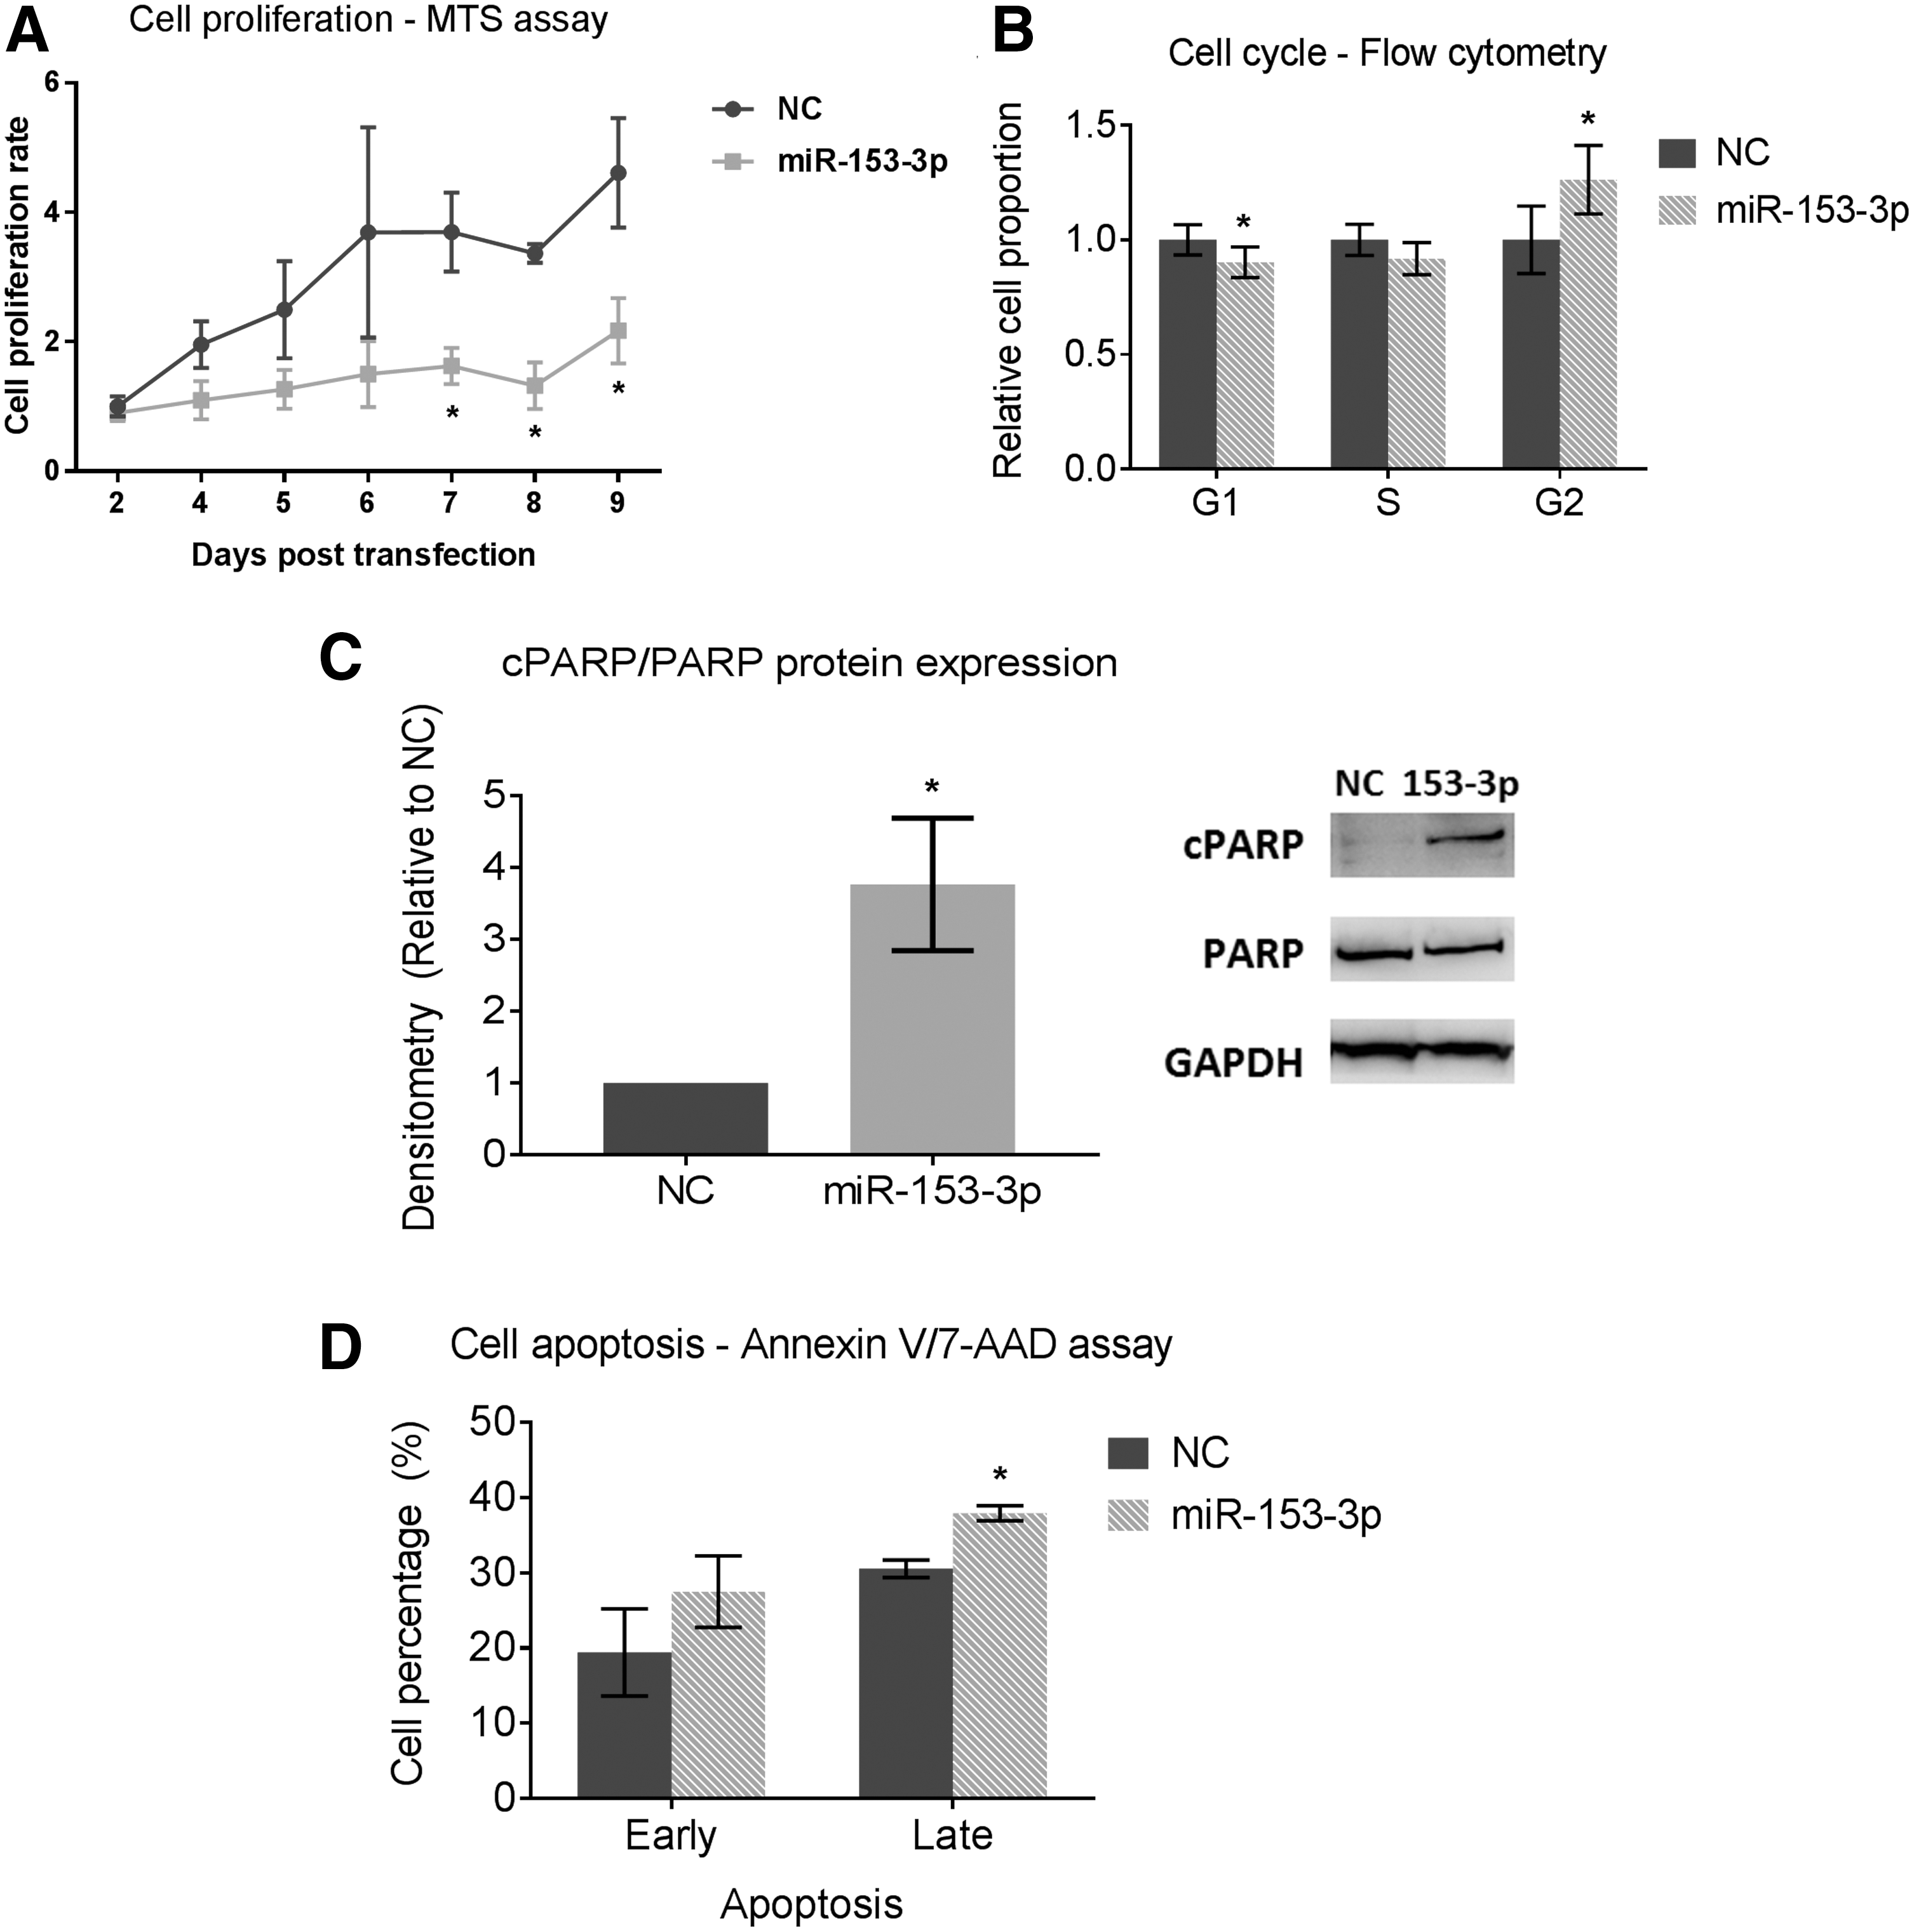
RET-regulated miR-153-3p inhibits cell proliferation and induces G2 cell-cycle arrest and cell apoptosis
It was hypothesized that miR-153-3p acts as a tumor suppressor due to its upregulation following RET inhibition. To verify this, gain-of-function studies were performed where miR-153-3p expression was replaced in the TT (MTC) cell line. Following transient transfection with miR-153-3p mimics, miR-153-3p expression in TT cells was increased (Supplementary Fig. S2). Restoration of miR-153-3p in TT cells resulted in significant inhibition of cell proliferation, which lasted for nine days (Fig. 3A). Furthermore, miR-153-3p increased the cell population in G2 phase by 20% compared to miR-NC (p < 0.05; Fig. 3B). Cell apoptosis was examined by measuring expression of cleaved poly (ADP-ribose) polymerase (cPARP) protein. cPARP was nearly fourfold increased following miR-153-3p replacement (p < 0.05; Fig. 3C). Cell apoptosis was also analyzed using Annexin V/7-AAD apoptosis assay by flow cytometry. Cell population undergoing late apoptosis was increased by 10% upon miR-153-3p overexpression (p < 0.05; Fig. 3D).
Restoration of miR-153-3p in TT cells and its cellular effect on cell phenotypes. (
Combination of miR-153-3p and cabozantinib results in further inhibition in cell proliferation
The tumor suppressive effect of miR-153-3p in combination with cabozantinib was explored next. TT cells were transfected with either miR-153-3p or miRNA scrambled sequences. Two days later, cells were treated with varying concentrations of cabozantinib (20, 200, 400, 800, or 1600 nM) for 48 hours for cabozantinib alone plus combined treatment groups. The day when cabozantinib treatment was completed and withdrawn was labeled as day 0, and cell proliferation was monitored on day 0 as well as over three days following cabozantinib treatment. The cabozantinib concentration applied was based on its IC50 of TT cell growth inhibition, and it was also within the range previously reported by Bentzien et al. to investigate the activity of cabozantinib in a MTC model (35).
Treatment with cabozantinib showed dose-dependent inhibition of cell proliferation, and miR-153-3p showed a more marked effect in inhibiting cell proliferation than cabozantinib up to a concentration of 400 nM (Fig. 4A and Supplementary Fig. S3). Moreover, the combination of miR-153-3p and cabozantinib at a dose of ≥400 nM inhibited cells by >50% (p < 0.05) on the first day post cabozantinib treatment when compared to either treatment alone (Fig. 4A and Supplementary Fig. S3).

Effect of combined treatment on MTC tumorigenesis in vitro. (
miR-153-3p alone reduces cell migration and invasion
The study further assessed the effects of miR-153-3p and miR-153-3p combined with cabozantinib treatment on cell migration and invasion. TT cells were either transfected with miR-153-3p or were treated with 400 nM of cabozantinib for 48 hours or with both miR-153-3p and cabozantinib. Migration was reduced by approximately 50% following miR-153-3p replacement (p < 0.05). There was no change following cabozantinib treatment. Combined treatment of miR-153-3p plus cabozantinib reduced migration similarly to that of miR-153-3p treatment alone (Fig. 4B). Approximately 30% reduction in invasion was achieved by miR-153-3p (p < 0.05) with no effect produced by cabozantinib (Fig. 4C).
mTOR signaling is inhibited following miR-153-3p replacement in vitro
Molecular targets of miR-153-3p were reviewed to attempt to establish a mechanism for the tumor suppressor actions of miR-153-3p. A number of publicly available prediction algorithms, such as DIANA-microT-CDS v5.0 (Biomedical Sciences Research Center “Alexander Fleming,” Vari, Greece), DIANA-miRPath v3.0 (Biomedical Sciences Research Center “Alexander Fleming”), TargetScan (Whitehead Institute for Biomedical Research, Cambridge, MA), and miRanda (Wellcome Trust Sanger Institute, Hinxton, United Kingdom), were used to identify putative targets. Both mTOR and PI3K-Akt signaling pathways were predicted to be significant enriched pathways with 6 and 18 genes, respectively, as potential molecular targets of miR-153-3p. The ribosomal protein S6 kinase B1 (RPS6KB1) gene is involved in both signaling pathways. Restoration of miR-153-3p in TT cells reduced expression of RPS6KB1 protein by 50% (p < 0.05) while having no effect on mRNA expression (Fig. 5A). RPS6KB1, a downstream activator of mTOR tyrosine kinase in mTOR signaling, is known to mediate cell survival by phosphorylating the BAD promoter, a pro-apoptotic protein. Western blots showed almost 50% reduction in phosphorylation of BAD following miR-153-3p overexpression (p < 0.05; Fig. 5B). This result indicates miR-153-3p may target RPS6KB1 by translational/posttranslational repression without affecting RPS6KB1 transcript levels.
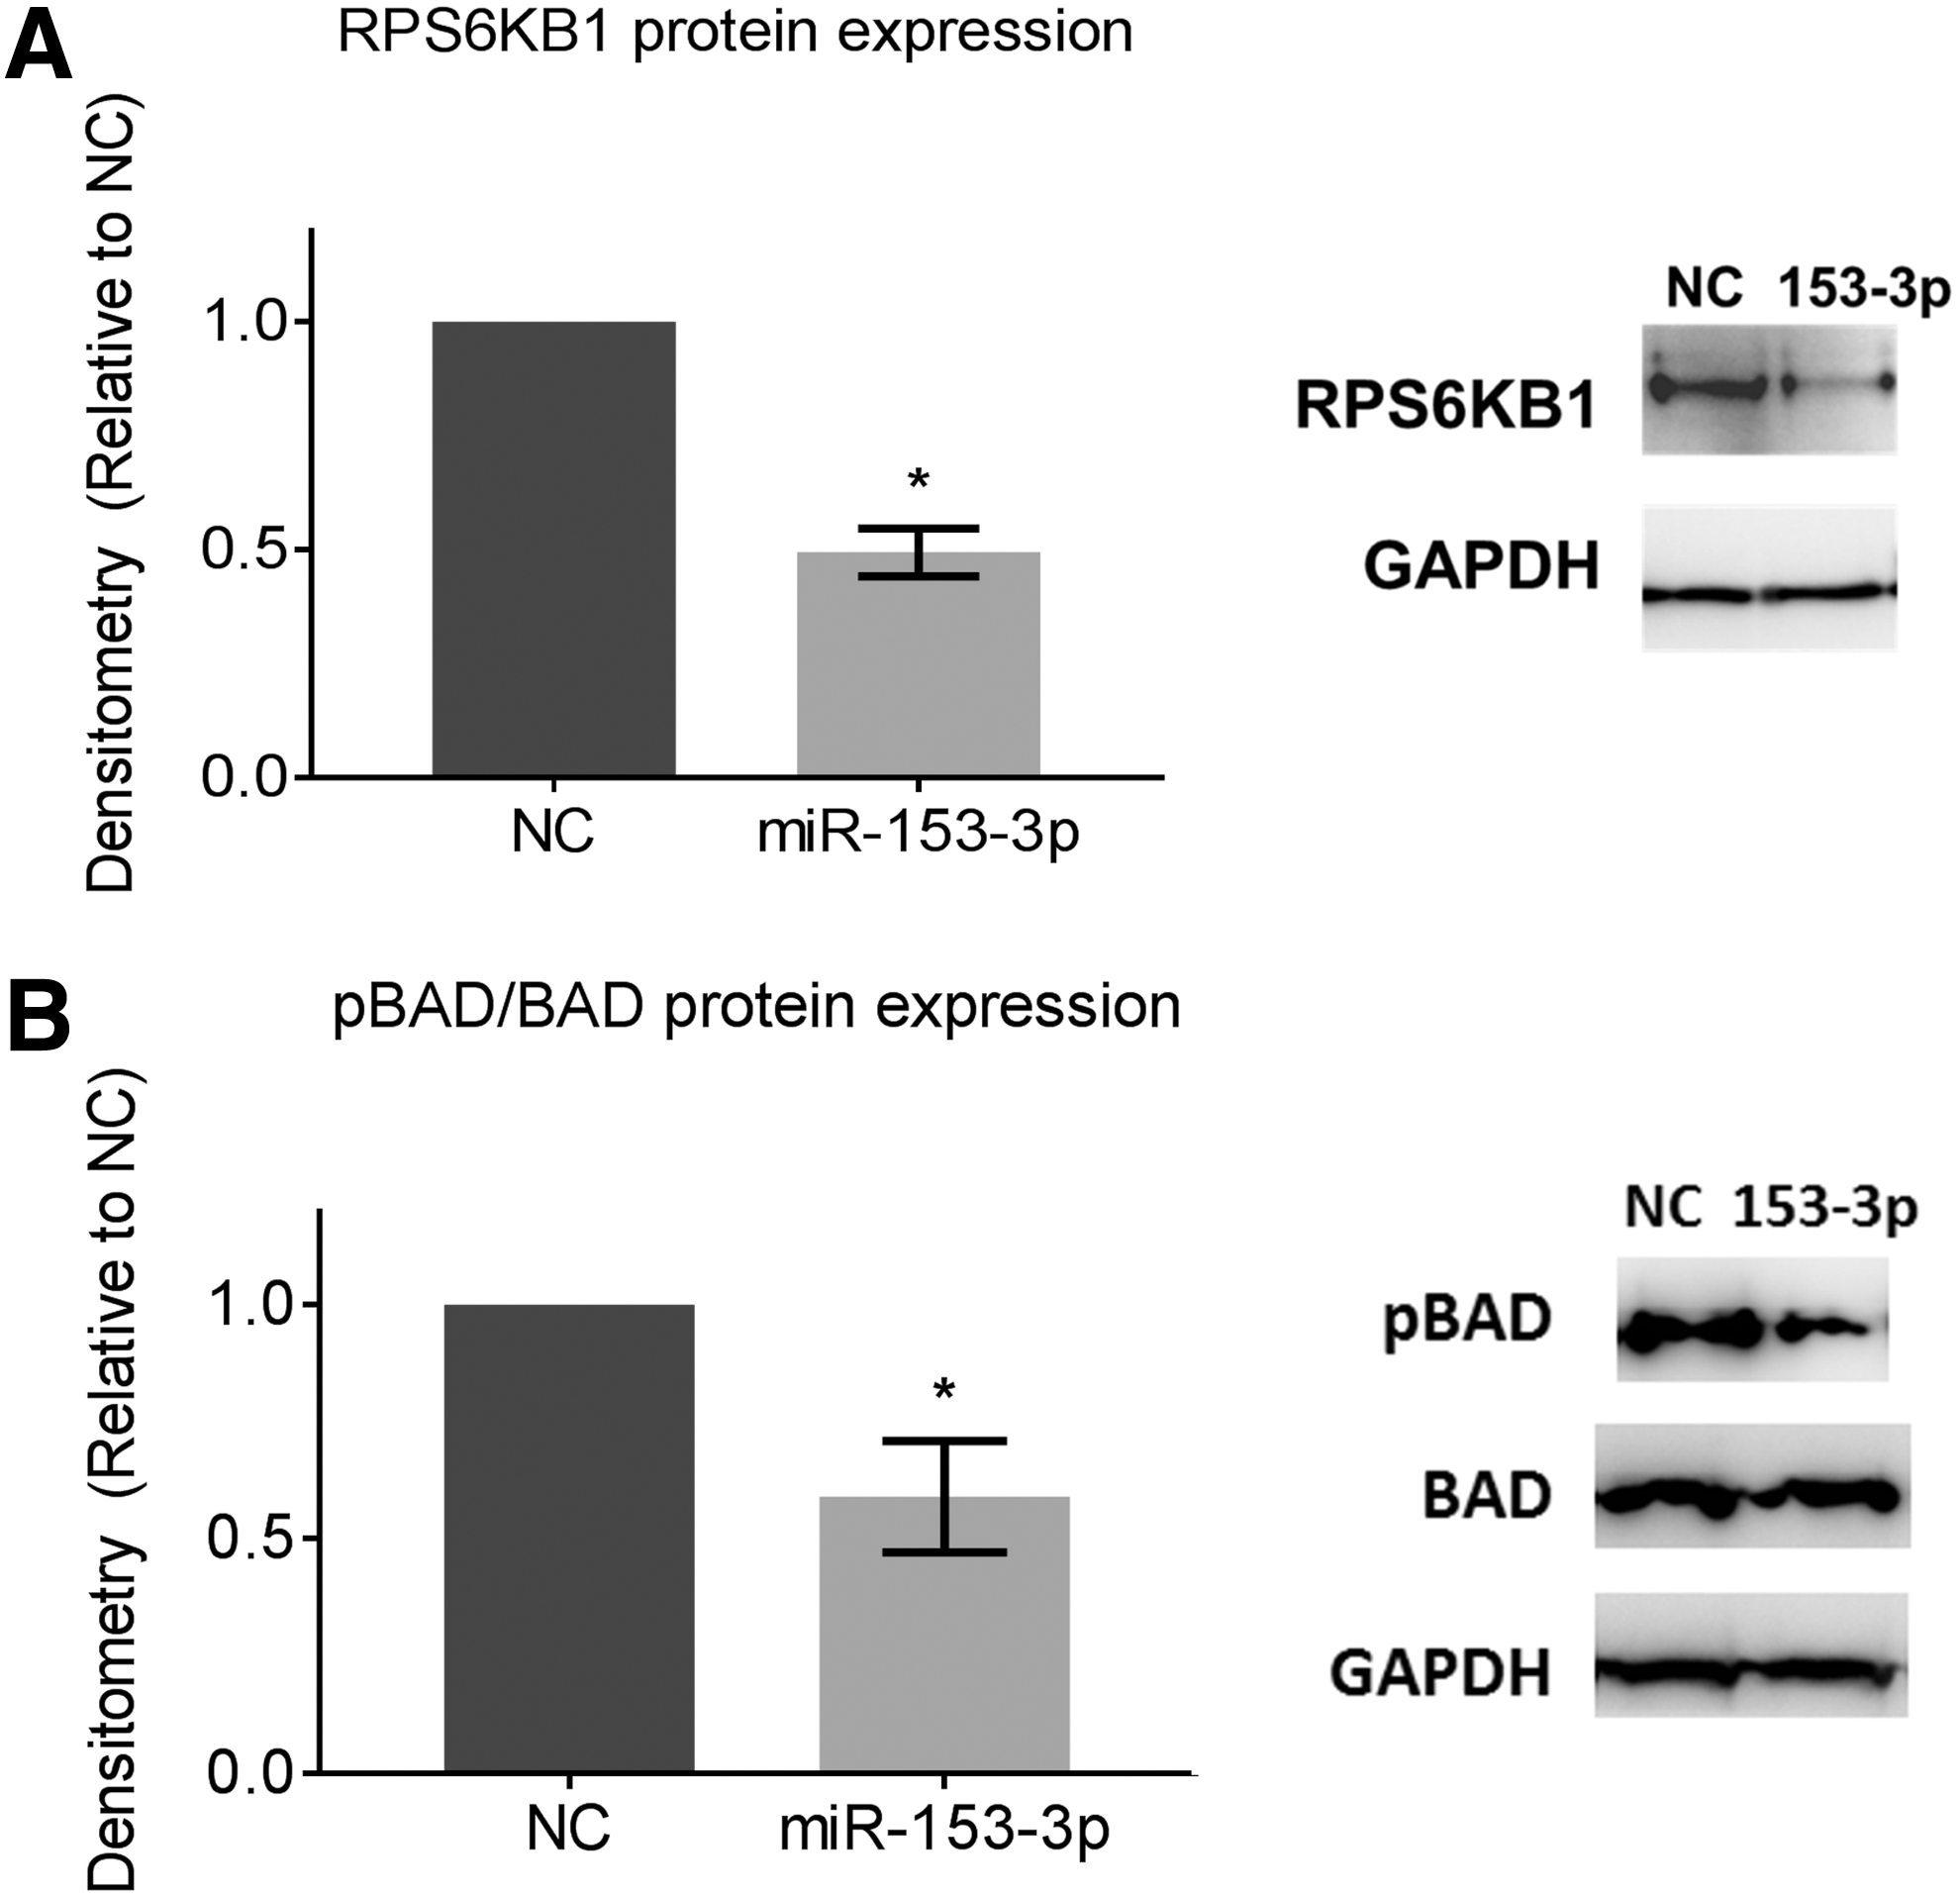
Ribosomal protein S6 kinase B1 (RPS6KB1) as a molecular target of miR-153-3p. miR-153-3p reduced protein expression of (
Intravenous delivery of miR-153-3p using targeted EDV nanocells reduces MTC xenograft growth
To assess the therapeutic potential of miR-153-3p in vivo, nude mice with established TT cell xenografts were treated with intravenous miR-153-3p mimics using EDV nanocells targeted against EGFR, and/or cabozantinib administered by oral gavage. TT cells expressed 31,081 EGF receptors per cell on average, as estimated by flow cytometry (Supplementary Fig. S4) (22). With the packaging of miRNAs in EDV nanocells, one dose contained 1 × 10⁹ nanocells, with each nanocell containing 6402 copies of miR-153-3p.
In the first experiment, the aim was to assess whether miR-153-3p would inhibit tumor growth and potentially enhance the tumor suppression effect of cabozantinib. When xenografts reached ∼120 mm3 (18 days), mice were randomized to five treatment groups (n = 8), in which mice were treated with saline, scrambled miRNA sequences (EDVmiR-NC) as control, miR-153-3p (EDVmiR-153-3p) alone, cabozantinib alone, or a combination of miR-153-3p plus cabozantinib. Tumor volumes were measured three times per week.
Initially, mice were treated four times per week each with one dose of EDV nanocells and/or cabozantinib at a concentration of 10 mg/kg mouse weight. After three treatments, tumor growth was significantly slowed, and tumor volume showed stabilization in the treatment groups compared to saline and the negative control (NC; p < 0.05; Fig. 6A). Within the first five treatments, tumors continued to remain stabilized or regressed. However, tumors appeared to progress 10 days after treatment (Fig. 6A). In order to clarify the tumor suppressive effect of miR-153-3p further, the dose of miRNA injection was doubled to 2 × 10⁹ EDVs for the following four treatments. Tumor growth was relatively stable for all treatment groups compared to NC once the dose was increased, while the tumor volume of the combined treatment was less than that of the individual treatment (Fig. 6A). Xenografts, mouse internal organs (liver, lungs, and kidneys), and mouse serum samples were collected for assessment of miRNA delivery, analyses of miRNA molecular targets, and measurement of serum calcitonin levels (results reported below).
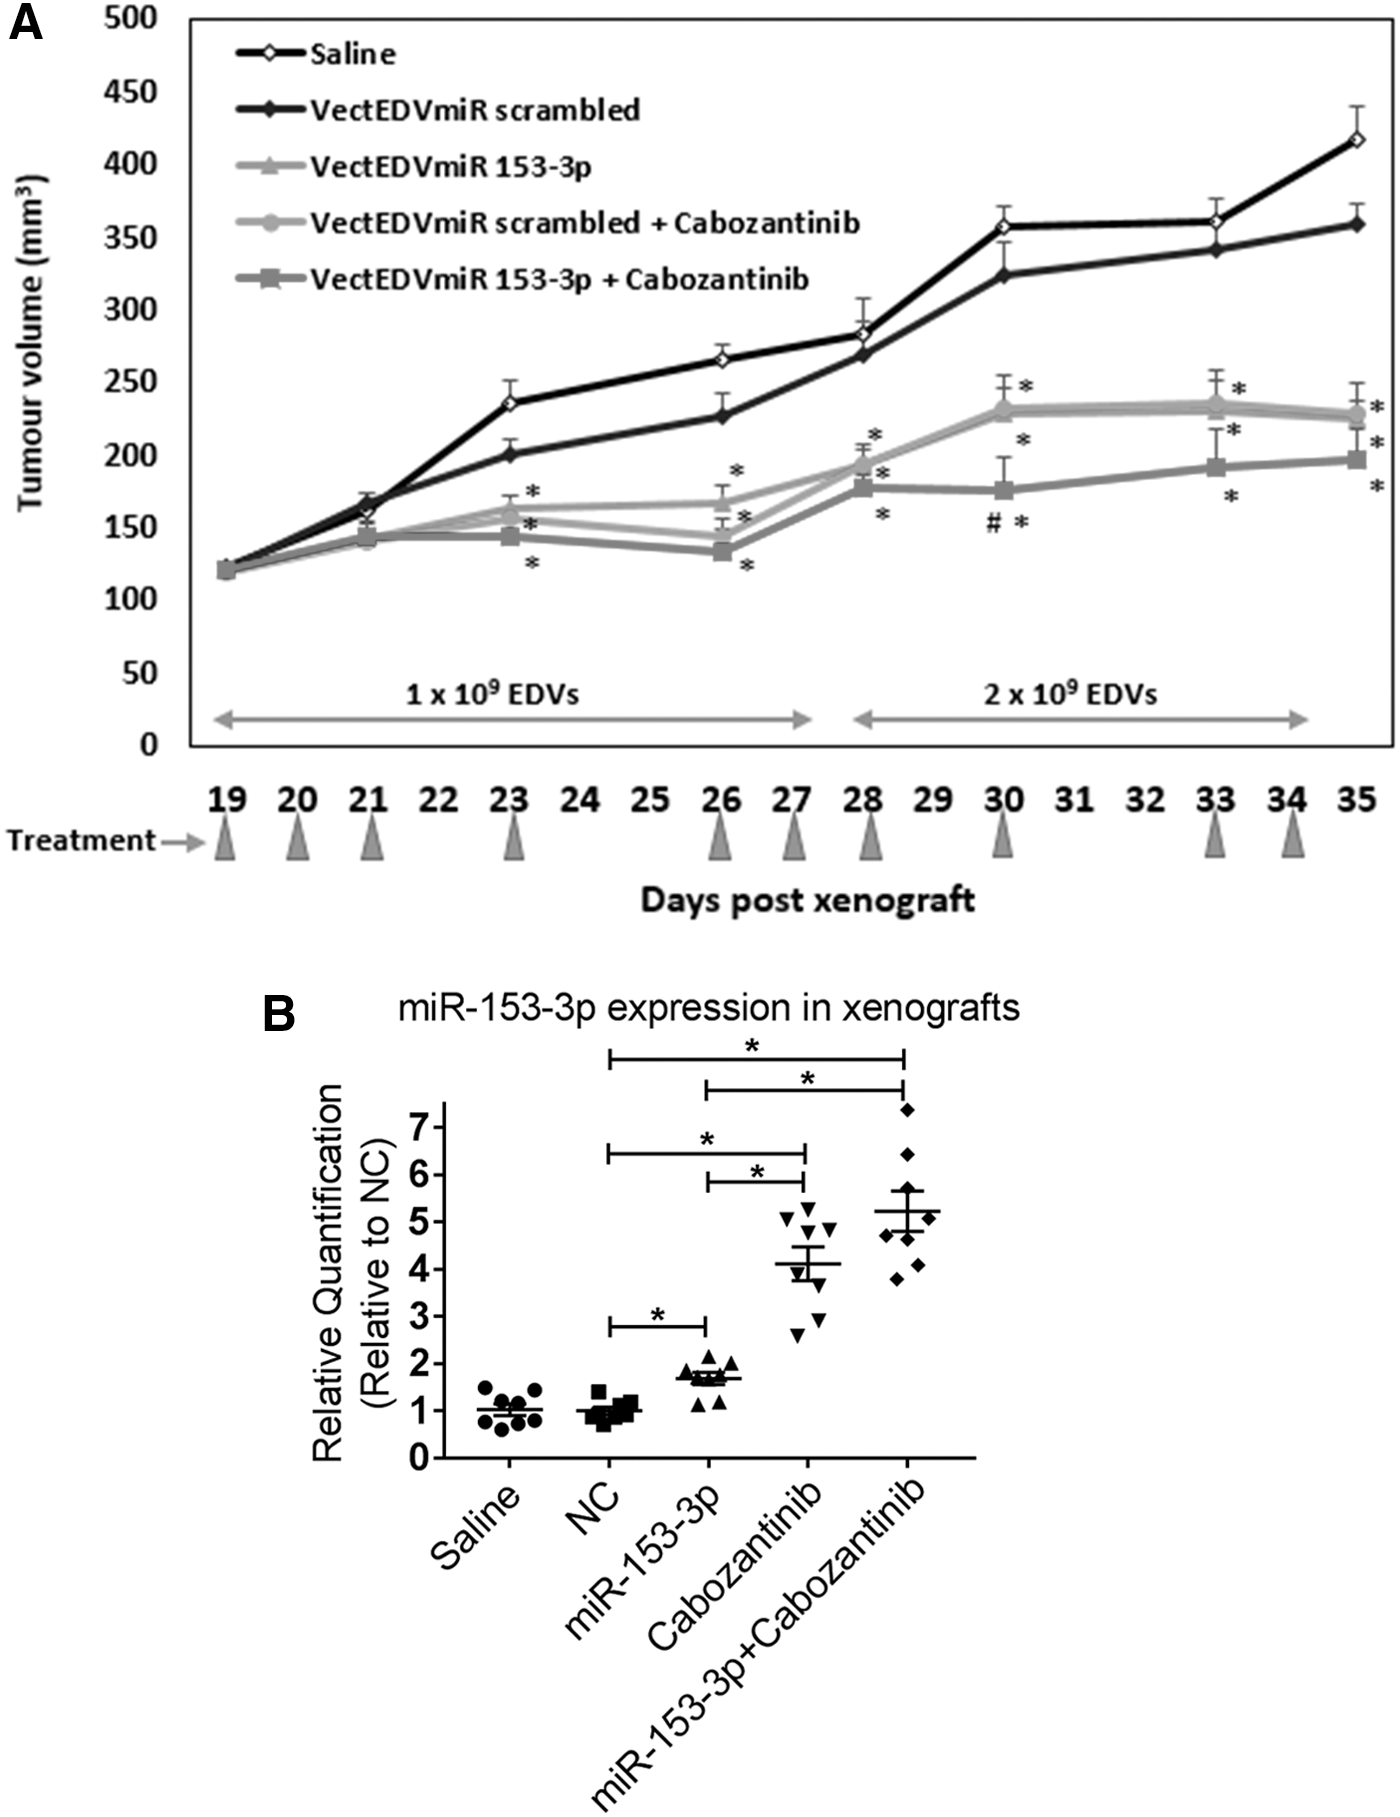
Intravenous targeted delivery of miR-153-3p inhibits MTC xenografts. (
Targeted intravenous delivery of miR-153-3p to MTC xenografts
In the ex vivo studies of the xenografts from the above in vivo experiment, in order to ensure delivery of miR-153-3p to the tumor cells, expression of miR-153-3p in all xenografts were measured by RT-qPCR. miR-153-3p expression was twofold increased with the miR-153-3p treatment group compared to the saline- or NC-treated group (Fig. 6B). Four- and fivefold increases were also detected in xenografts treated with cabozantinib and the combined treatment group, respectively (Fig. 6B). The overexpression of miR-153-3p in xenografts following the cabozantinib treatment was consistent with the finding of the in vitro studies (Fig. 1A and Table 1).
Repression of mTOR signaling in vivo
For further xenograft ex vivo studies, immunohistochemistry analysis of Ki67, a proliferation index, demonstrated a significant reduction of Ki-67 score (∼15%, p < 0.05) in the combined treatment group compared to that of the miR-153-3p treatment group (Fig. 7A). Protein expression of cleaved PARP was assessed in all xenografts. However, no significant difference was detected among the treatment groups (Supplementary Fig. S5).
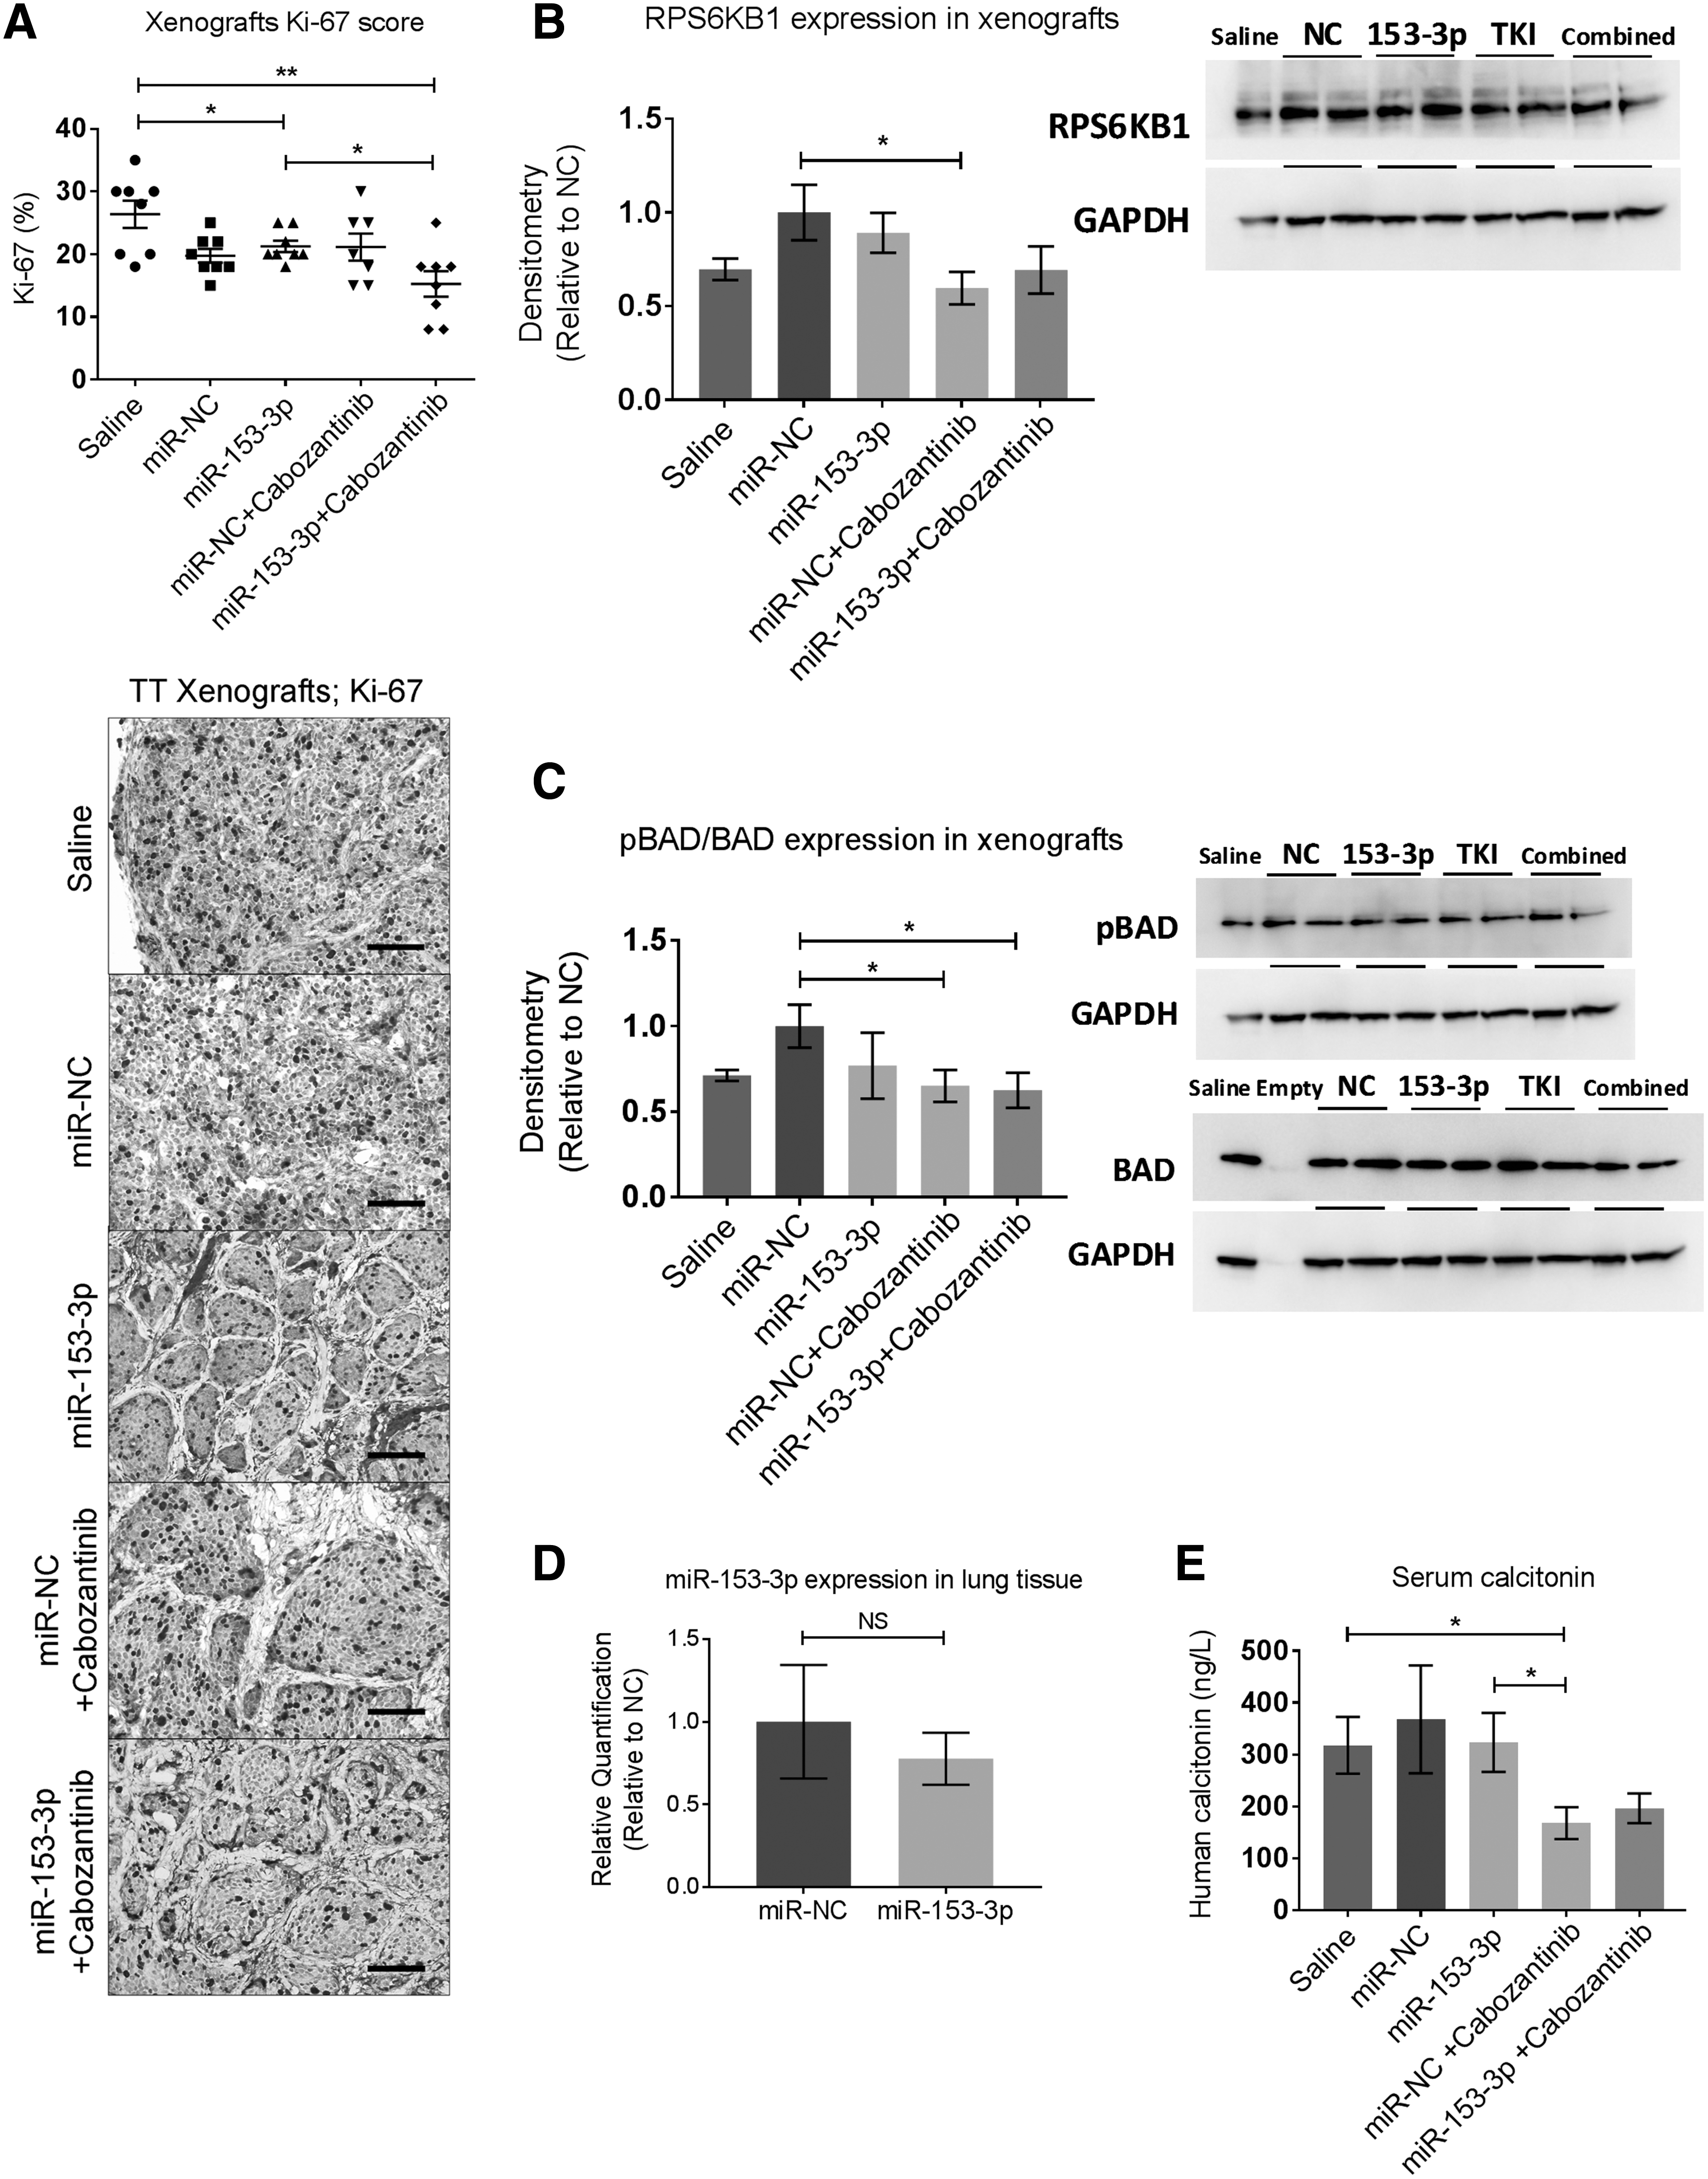
Xenografts ex vivo analyses and assessment of in vivo off-target effects. (
To investigate miR-153-3p regulation of its molecular targets in vivo further, RPS6KB1 and phosphorylation of BAD was examined in xenografts. No change of RPS6KB1 transcript level was detected among any treatment groups (data not shown), in line with the in vitro finding. However, RPS6KB1 was significantly downregulated in the xenografts treated with cabozantinib (Fig. 7B) compared to the NC-treated group, and phosphorylation of BAD was also significantly reduced in both the cabozantinib and combined treatment groups (Fig. 7C).
Targeted delivery of miR-153-3p does not cause any in vivo off-target effect
To assess possible side effects caused by the restoration of miR-153-3p via EDVs, the lungs, liver, and kidney of all mice were collected. miR-153-3p was not detected in either the liver or kidney in the miR-153-3p-treated mice (data not shown). No significant change of miR-153-3p was detected in lung tissues between mice treated with miR-153-3p and miR-NC (Fig. 7D). In all internal organs (liver, kidney, and lung), there was no significant difference in expression of RPS6KB1 and phosphorylated BAD proteins between mice treated with miR-153-3p and those with miR-NC (data not shown). Furthermore, throughout the study period, there was no significant weight loss (data not shown), and no abnormal behavior or signs of toxicity were observed in any animal.
Serum calcitonin levels
Human calcitonin secreted by TT xenograft in mouse serum samples was measured. There was no significant difference between the miR-153-3p treated group and miR-NC (Fig. 7E). Cabozantinib treatment resulted in significantly reduced levels of calcitonin compared to saline treatment and miR-153-3p delivery (Fig. 7E). However, the reduction of the calcitonin level in the combined treatment group did not reach statistical significance, with p-values of 0.062 and 0.058, respectively compared to the saline-treated and miR-153-3p-treated groups (Fig. 7E).
miR-153-3p modulates cell responses to cabozantinib in vivo
In a second in vivo experiment, the potential for miR-153-3p to modulate cell responses to cabozantinib was explored. When TT xenografts reached ∼120 mm3, mice were randomized to five groups (n = 7) and treated with scrambled miRNA sequences (NC), miR-153-3p alone, or with combined treatment of miR-153-3p plus cabozantinib, and two groups were treated with cabozantinib alone. Mice were treated three times per week each with 2 × 10⁹ EDV nanocells for two weeks, while cabozantinib remained at the same concentration (10 mg/kg mouse weight). Between day 19 and day 26, all the treatment groups showed comparable tumor stabilization/growth when compared to NC (Fig. 8). On day 28, the various treatment groups started to show disparity in tumor volume, and the combined treatment group showed the lowest tumor volume on day 33 compared to the individual miR-153-3p or cabozantinib treatment groups (p < 0.05, respectively; Fig. 8). On day 33, the tumor volume of the miR-153-3p treatment group was significantly reduced compared to the cabozantinib group (Fig. 8).

miR-153-3p modulates cell responses to cabozantinib in vivo. TT xenografts were treated for two weeks with scrambled miRNA sequences (NC), miR-153-3p alone, or with combined treatment of miR-153-3p plus cabozantinib, and two groups were treated with cabozantinib alone. Treatments were withdrawn after two weeks. Following two weeks of withdrawal period (indicated), the same initial treatment resumed except for one cabozantinib group, which received additional miR-153-3p labeled with “cabozantinib (+VectEDVmiR 153-3p).” Arrowheads indicate days of treatment. Average xenograft volumes are shown for each group. *p < 0.05 compared to cabozantinib; # p < 0.05 compared to miR-153-3p; + p < 0.05 compared to cabozantinib–cabozantinib. Error bars represent SEM, n = 7, t-test. Representative images of tumors from each group are shown.
Treatments were withdrawn after two weeks' initial treatments. During the first week of the withdrawal period (days 30–37), the cabozantinib groups showed substantially rapid tumor growth, and the tumor volume reached a level similar to the NC on day 35 (Fig. 8). The tumor volume for both the combined and miR-153-3p groups was significantly lessened on day 37 compared to the cabozantinib groups (p < 0.05; Fig. 8). The miR-153-3p group started to show considerably rapid tumor growth during the second week of the withdrawal period (days 37–44) and reached a similar tumor volume as the groups treated with cabozantinib at the end of the withdrawal period (day 44), while the combined group still maintained the lowest tumor volume compared to the other groups (Fig. 8).
Tumors were challenged again two weeks post withdrawal with the same initial treatments for one more week, except for one cabozantinib group, which received additional miR-153-3p (Fig. 8). There was an immediate decrease in tumor volume by 100 mm3 in the treatment group with cabozantinib coupled with additional miR-153-3p on day 47. However, the effect was diminished on day 50 where the tumor volume of this group remained similar to that of the miR-153-3p group (Fig. 8). The primary combination group of miR-153-3p plus cabozantinib continued to show tumor stabilization throughout the treatment-resuming period (Fig. 8).
Discussion
Activation of RET RTK has been well established as the key factor of MTC development and progression. This study reports for the first time a mechanism involving the regulation of specific miRNAs by RET tyrosine kinase in the pathogenesis of MTC. This study demonstrates the potential of miRNA replacement in combination with cabozantinib as a therapeutic approach for advanced MTC. It demonstrates that RET inhibition triggers the upregulation of miR-153-3p, which has established itself as a tumor suppressor through alterations in cellular processes, including cell proliferation, cell cycle, apoptosis, migration, and invasion. It also demonstrates that targeted systemic delivery of miR-153-3p results in stabilization of MTC xenograft growth without any off-target effect. Furthermore, the combined treatment with miR-153-3p plus cabozantinib causes greater growth inhibition, and the addition of miR-153-3p appears to constrain tumor growth when MTC xenografts cease to respond to cabozantinib treatment alone. Mechanistically, miR-153-3p suppresses mTOR signaling through RPS6KB1 and BAD, both downstream markers of mTOR signaling.
Distinctive miRNA expression signatures in cancers highlight their potential as biomarkers for diagnosis and prognosis, as well as novel therapeutic targets. However, there have been limited studies in miRNA profiling of MTC due to the difficulty in obtaining normal C-cells as a differential expression comparator. A recent finding of miR-21 overexpression in MTC and in vitro loss-of-function studies confirmed the oncogenic effect of miR-21 in MTC (20). To date, no miRNA has been shown as a tumor driver in MTC, and the identification of miRNAs of significance within the context of RTK signaling may offer a therapeutic potential for combination of miRNAs together with TKIs. One study identified that the expression of miR-129-5p was inversely correlated with RET expression in MTC cell lines and tissues (36). Another miRNA, miR-182, was found to promote invasion and migration in MTC by directly targeting HES1, a repressor of the Notch signaling pathway (21). In this study, it was shown that RET-regulated miR-153-3p functioned as a tumor suppressor, where it suppressed cell proliferation, invasion, or migration while promoting cell apoptosis. miR-153-3p has also been implicated as a tumor suppressor in several other cancers (24,27,37 –39). However, the present in vivo studies did not examine a survival difference among miRNA treatment groups. Further in vivo work using survival as an endpoint will be ideal to assess the utility of miRNA-based therapy for advanced MTC.
miRNAs function as a modulator for RTK signaling in cancer as both tumor suppressors and oncogenes (40 –42). In a study of glioblastomas by Zhang et al., RTKs, including MET, EGFR, and platelet-derived growth factor receptor, mediated downregulation of miR-134 to modulate KRAS and signal transducer and activator of transcription 5B (42). This highlights how the oncogenic pathways inactivate tumor suppression through miRNA modulation. It also suggests that manipulating certain miRNAs may confer important therapeutic potential in tumors, and overcome resistance to therapies that originates from the activation of multiple signaling pathways. In another study of glioblastomas, the authors identified a feedback loop between miR-21 and EGFR, where miR-21 was found to be positively regulated by the activated EGFR signaling pathway. Further, this study demonstrated that inhibition of miR-21 augments the efficacy of nimotuzumab, a monoclonal antibody against EGFR (41). This provides insights into the association of oncogenic miRNAs and RTK signaling in cancers.
Targeting RET using multikinase inhibitors, for example with cabozantinib and vandetanib, has emerged as a promising novel therapeutic approach for advanced MTC. However, TKI therapy has been associated with significant adverse effects, and patients often require dose reductions or discontinuation of treatment (7,43). The present in vitro study highlights the effect of miR-153-3p-enhanced growth suppression of MTC cells by cabozantinib via suppressing mTOR signaling, and this was confirmed in a mouse model. Several studies have provided evidence for the activation of the Akt/mTOR signaling cascade in MTC (44,45) and proliferation of TT cells have been found to be inhibited by the inhibitor targeting mTORC1 (45 –47). RPS6KB1 was validated as a target for miR-153-3p via translational/posttranslational repression, and repression of the downstream protein, BAD, was further observed. As an effector of mTOR signaling, RPS6KB1 plays a critical role in regulating fundamental cellular processes such as cell growth, proliferation, protein synthesis, and cell-cycle progression. Tumor inhibition by miR-153-3p via mTOR signaling will therefore offer a therapeutic benefit when incomplete inhibition of RET activity occurs following a dose reduction of TKI due to side effects.
To date, another major limitation to kinase-based therapy other than the adverse effects consists in the clinical resistance to kinase inhibitors, including primary resistance and the development of acquired resistance (48,49). One example of primary resistance in MTC is an in vitro study, demonstrating the RET V804M and RET V804L gatekeeper mutations confer resistance to vandetanib (50). In a recent study by Subbiah et al., the authors reported a clinical case illustrating the development of an acquired resistance, where the RET V804M mutation was identified in a MTC patient following several multikinase inhibitor regimens (51). Since expression of miR-153-3p was significantly associated with RET activity, the therapeutic potential of miR-153-3p in modulating cell responses to cabozantinib was investigated further. Additional introduction of miR-153-3p to xenografts with an existing cabozantinib treatment led to an immediate drop in tumor volume and sustained tumor stabilization for the period of treatment in contrast to continuous tumor growth under cabozantinib treatment alone. Further investigations, such as the examination of the expression and the phosphorylation status of the key downstream elements of the RET pathway, along with the examination on the activation of bypass signaling tracks among all the treatment groups, might elucidate the molecular mechanisms underlying the development of cabozantinib resistance and reversal of resistance by miRNAs.
In addition to the therapeutic properties, a deeper understanding of miRNA modulation during TKI treatment can also provide important potential as a biomarker for monitoring treatment progression and assisting patient stratification. Cappuzzo et al. recently identified a distinctive miRNA cluster (Let-7c/miR-99a/miR-125b) in metastatic colorectal cancer to predict the treatment responses with anti-EGFR antibodies (cetuximab or panitumumab) (52).
A potential limitation of overexpression of miRNAs in the clinical setting is the possibility of systemic off-target effects. A number of miRNA delivery systems have been explored. However, most of methods, including polypeptides, adenovirus, and lipids, deliver miRNAs to both normal and tumor cells, leading to potential collateral, off-target effects, as well as increasing miRNA loads required to treat tumors (53 –55). EDV nanocells target tumor tissues by passive and active targeting (22,56). The size 400 nm is a distinct advantage for EDVs, which accumulate at sites of tumor-associated leaky vasculature and are too large to extravasate into non-tumor tissue where the fenestrations are <100 nm (passive targeting) (22). EDVs are also coated with bi-specific antibodies actively targeting certain cell-surface receptors, in this case EGFRs (56). In this study, no significant change of miR-153-3p and its target expression, as well as the downstream signaling marker, was detected in mouse liver or lung tissues following miR-153-3p delivery, providing preliminary evidence of negligible off-target effects for this systemic targeted miRNA replacement therapy.
Additionally, while the present results show considerable tumor stabilization and inhibition of the growth rate of xenografts derived from TT cells upon combinatorial therapy, additional models using patient-derived xenografts would be of great interest in future studies. Furthermore, while it is demonstrated in vitro that miR-153-3p exerted its tumor suppressive actions via the inactivation of RPS6KB1 and BAD proteins, the molecular profiles of xenografts showed the maximal changes in the combined treatment group. In published studies of intravenous delivery of miRNAs in xenografts of adrenocortical cancer and prostate cancer, it was found that substantial changes of miRNA molecular targets are often detected ahead of a significant tumor volume change (57,58). Expanded experiments in ongoing studies will test various time points for xenograft collections to identify the maximal changes of miRNA molecular targets in vivo.
Several molecular targets of miR-153-3p, such as hypoxia-inducible factor 1-alpha in HEK293 cells in the study of temporal-lobe epilepsy (59) and Snail family transcriptional repressor 1 in gastric cancer (25) and pancreatic cancer (60), have been experimentally validated. The expression of these miR-153-3p targets in MTC will be tested further in in vitro gain-of-function studies, as well as in vivo studies following the systemic delivery of miR-153-3p.
In summary, the present data conclusively demonstrate for the first time in MTC that RET-regulated miR-153-3p exerts a tumor suppressive role via inhibition of mTOR signaling. miR-153-3p replacement therapy in combination with cabozantinib leads to enhanced inhibition of tumor growth. The introduction of miR-153-3p, when MTC cells halt to respond to cabozantinib, holds the potential to increase therapeutic efficacy. These data reveal a potential novel mechanism and therapeutic strategy for the treatment of patients with advanced MTC.
Footnotes
Acknowledgments
We thank Justin S. Gundara and Anthony R. Glover for being involved in ongoing discussion of this project. Completed clinical data were collated with the help of Ahmad Aniss who is the manager of the University of Sydney, Endocrine Surgical Unit database. We thank Cameron Wood, who is the senior hospital scientist of the NSW Health Pathology, Endocrine Laboratory, for assisting in the measurement of serum calcitonin. Lauren Joo is a recipient of Sydney Vital Research Scholar Award of 2016 and 2018, as well as EnGeneIC Foundation Research Support for 2017.
Author Disclosure Statement
Jennifer MacDiarmid and Himanshu Brahmbhatt have ownership interests (including patents) in EnGeneIC Ltd. Jocelyn Weiss is an employee of EnGeneIC Ltd. Stan B. Sidhu is a member of a family trust, which has an ownership interest in EnGeneIC Ltd. The other authors declare no conflict of interest.
Supplementary Material
Supplementary Figure S1
Supplementary Figure S2
Supplementary Figure S3
Supplementary Figure S4
Supplementary Figure S5