
Abstract
Background:
The preoperative diagnosis of thyroid follicular carcinomas (FCs) by fine-needle aspiration cytology is almost impossible. It was previously demonstrated that p53-binding protein 1 (53BP1) expression, based on immunofluorescence (IF), can serve as a valuable biomarker to estimate the malignant potential of various cancers. 53BP1 belongs to a class of DNA damage response molecules that rapidly localize to the site of DNA double-strand breaks, forming nuclear foci (NF). This study aimed to elucidate the utility of 53BP1 NF expression as a biomarker to differentiate follicular tumors (FTs).
Methods:
Associations between 53BP1 expression based on IF and histological types of FTs were analyzed using 27 follicular adenomas (FAs), 28 minimally invasive FCs, and 14 widely invasive FCs. Furthermore, the study clarified the relationship between 53BP1 NF and copy number aberrations (CNAs) based on array comparative genomic hybridization, a hallmark of genomic instability (GIN).
Results:
This study demonstrates differences in 53BP1 NF expression between FA and FC. The incidence of 53BP1 at NF significantly increased with FT progression in the following order: normal follicle < FA < minimally invasive FCs < widely invasive FCs. In contrast, no significant differences were observed in CNAs among the FT samples. Furthermore, there was no significant correlation between CNAs and 53BP1 at NF in FTs. Thus, based on a comparison of these two indicators of GIN, 53BP1 NF (by IF) was better able to estimate the malignancy of FTs compared to CNA (by array comparative genomic hybridization). Interestingly, IF revealed a heterogenous distribution of 53BP1 NF, which occurred more frequently in the invasive or subcapsular area than in the center of the tumor, suggesting intratumoral heterogeneity of GIN in FTs.
Conclusions:
It is proposed that IF analysis of 53BP1 expression could be a novel diagnostic method to estimate the malignant potential of FTs. Because 53BP1 NF reflect DNA double-strand breaks, it is hypothesized that the incidence of 53BP1 at NF can represent the level of GIN in tumor cells. IF analysis of 53BP1 expression will not only be an auxiliary histologic technique to diagnose FTs accurately, but also a novel technique for preoperative diagnosis using fine-needle aspiration cytology.
Introduction
Follicular carcinoma (FC) is the second most common type of thyroid carcinoma and must be differentiated from more common follicular adenoma (FA) (1). It is almost impossible to diagnose thyroid follicular tumors (FTs) preoperatively by fine-needle aspiration cytology (FNAC) because the criteria for distinguishing these lesions are based on histological evidence such as capsular/vascular invasion or metastasis and not on cytologic features, as is the case for papillary thyroid carcinoma (PTC) (2,3). According to The Bethesda System for Reporting Thyroid Cytology, almost all FCs are category III, which is defined as atypia of undetermined significance or follicular lesions of undetermined significance (AUS/FLUS) or category IV, which is defined as follicular neoplasm or suspicious for follicular neoplasm (FN/SFN). For these categories, the estimated risk of malignancy is 5–15% or 15–30%, respectively (4). Thus, to avoid unnecessary surgery, several patients with FC, especially those cases including vascular invasion, are required to undergo a completion total thyroidectomy after a preceding histological diagnostic hemithyroidectomy.
Several molecular techniques have been proposed for the preoperative diagnosis of FTs (5 –7), but there is no definite method that can clearly distinguish benign tumors from malignancy. It was previously demonstrated that an immunofluorescence (IF)-based method to detect p53-binding protein 1 (53BP1) expression can serve as a valuable molecular marker to estimate the malignant potential of various cancers, including cancers of the thyroid (8), skin (9), and uterine cervix (10). 53BP1 belongs to a family of evolutionarily conserved DNA damage response (DDR) molecules that are rapidly recruited to the site of DNA double-strand breaks (DSBs) as a downstream effector of γ-H2AX (11). These molecules then form nuclear foci (NF) to activate p53 cooperatively with other kinases (12 –14). The recruitment of 53BP1 protects the damaged end of DNA from undergoing resection, which in turn prevents error-free homologous recombination repair and instead promotes error-prone non-homologous end joining (15 –19). The expression of 53BP1 at NF has been found to reflect ionizing radiation-induced DSBs, which increase linearly with radiation dose (12). Genomic instability (GIN) is considered an important hallmark of malignant tumors and is occasionally evident in the precancerous stage of carcinogenesis. Given that one manifestation of GIN is the induction of the endogenous DDR (20), it is proposed that 53BP1 NF, based on IF, might be a useful tool to estimate the level of GIN, as well as the malignant potential of human tumors.
To elucidate the utility of 53BP1 expression as a biomarker to differentiate thyroid FTs, this study analyzed associations between 53BP1 expression and histological types such as FAs, minimally invasive FCs (MFCs), and widely invasive FCs (WFCs). Furthermore, to validate the significance of 53BP1 NF in estimating GIN among FTs, this study also clarified the relationship between 53BP1 NF and copy number aberrations (CNAs) detected by array comparative genomic hybridization (aCGH), which is a well-known hallmark of GIN during carcinogenesis (13,14).
Methods
Thyroid tissues
A total of 69 surgically resected, formalin-fixed, paraffin-embedded (FFPE) thyroid FTs, including 27 conventional-type FAs, 28 MFCs, and 14 WFCs, were used in this study. The diagnoses of all patients were histologically and macroscopically confirmed by a pathologist specializing in thyroid oncology (M.H. or M.N.). Any controversial cases were excluded from the analysis. As a normal control, seven non-tumorous follicular tissues surrounding FTs were also evaluated. Clinicopathologic factors and preoperative cytological diagnoses of these cases are summarized in Table 1. This study was retrospectively conducted in accordance with the tenets of the Declaration of Helsinki and approved by the institutional ethical committee for medical research at Nagasaki University (approval date: July 24, 2015; #1506265). Following the guidelines of the ethical committee's official informed consent and disclosure system, detailed information regarding the study is available online at the Nagasaki University Department of Tumor and Diagnostic Pathology website. Patients were able to opt out of the study by following the instructions on the faculty Web site. All samples were resected from patients at the Nagasaki University Hospital from 1994 to 2012 and the Kuma Hospital from 2010 to 2012.
Comparisons of Clinicopathologic Factors Among Follicular Tumors Used in This Study
Data are shown as the mean ± standard deviation.
By Kruskal–Wallis test.
By Cochran–Armitage test.
By Jonckheere–Tapstra test.
WFC, widely invasive follicular carcinoma; MFC, minimally invasive follicular carcinoma; FA, follicular adenoma; Indeterminate, including both atypia of undetermined significance or follicular lesion of undetermined significance, and follicular neoplasm or suspicious for a follicular neoplasm according to The Bethesda System for Reporting Thyroid Cytology.
IF analysis of 53BP1 expression
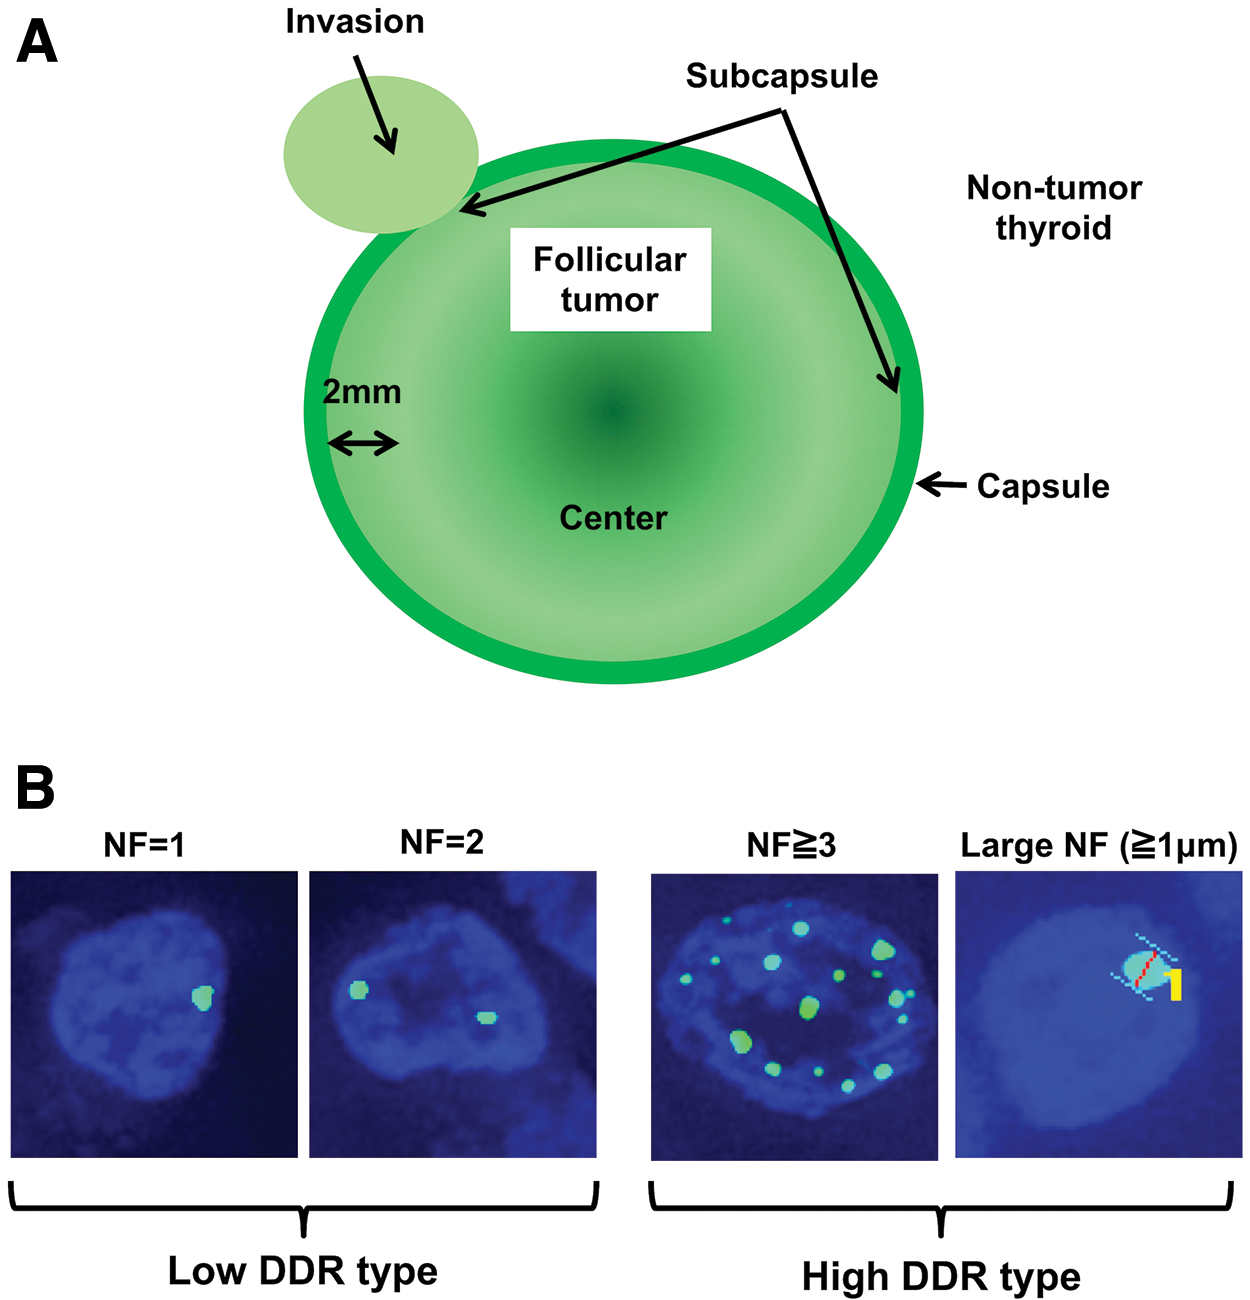
After antigen retrieval by microwaving in citrate buffer, deparaffinized 4 μm sections were preincubated with 10% normal goat serum. Tissue sections were then incubated with an anti-53BP1 rabbit polyclonal antibody (A300-272A; Bethyl Labs, Montgomery, TX) at a 1:200 dilution for one hour at room temperature. The slides were subsequently incubated with Alexa Fluor 488-conjugated goat anti-rabbit antibody (Molecular Probes Inc., Eugene, OR). Specimens were counterstained with 4′,6-diamidino-2-phenylindole dihydrochloride (Vysis Inc., Downers Grove, IL), analyzed, and photographed using a High Standard All-in-One Fluorescence Microscope (Biorevo BZ-9000; KEYENCE Japan, Osaka, Japan) in Z-stack mode, accumulating images from 20 to 30 slices. Signals were analyzed from more than 15 viewing areas of subcapsular parts per case at a 1000-fold magnification, as shown in Figure 1A. The 53BP1 immunoreactivity pattern was classified into three types based on the number and size of NF: (i) stable type: faint nuclear staining; (ii) low DDR type: one or two discrete NF; and (iii) high DDR type: three or more discrete NF, or discrete NF that are >1.0 μm in the minor axis (Fig. 1B). The percentage of follicular cells expressing each type of 53BP1 staining pattern was calculated for each case.
Definition of (
Validation of IF analysis of 53BP1 expression using FFPE tissues
IF analysis of 53BP1 expression was also performed to determine whether 53BP1 NF can be specifically detected in FFPE sections using thyroid tissues after irradiation. Seven-week-old male Wistar rats were used for this. All animals received whole-body irradiation using a Toshiba ISOVOLT TITAN32 X-ray at 200 kV and a dose rate of 0.5531 Gy/min. Two doses of 0.1 and 4 Gy were administered. Two rats in each activity group were sacrificed by deep anesthesia two hours after irradiation. Each thyroid gland was resected and immersed in neutral-buffered formalin and routinely embedded in paraffin blocks. Sections were used for IF according to the method described previously herein. Control rats were not irradiated but were otherwise handled identically. This experimental protocol was approved by the Institutional Animal Care and Use Committee at Nagasaki University Animal Center (protocol no. #1610111343).
DNA extraction
Genomic DNA was extracted from tumor areas in FFPE tissues, as reported previously (21). Tumor areas, identified using a guide slide stained with hematoxylin and eosin, were microdissected from each FFPE block using sections 10 μm × 10 μm thick and were transferred into tubes. Paraffin removal was performed in 80% xylene. Then, tissues were washed twice with absolute ethanol, and deparaffinized tissue pieces were centrifuged at 15,000 g for 10 minutes at room temperature. After drying, pellets were re-suspended in 180 μL of buffer ATL (QIAamp DNA FFPE Kit; Qiagen, Hilden, Germany) and digested with proteinase K for 72 hours at 56°C in a rotation oven with periodic mixing and the addition of fresh proteinase K every 24 hours. DNA was collected using the QIAamp DNA FFPE Kit according to the manufacturer's instructions. Extracted DNA was quantified using a NanoDrop ND-1000 spectrophotometer (NanoDrop Technologies, Wilmington, DE). The concentration of double-stranded DNA (dsDNA) in each sample was quantitated using a Qubit dsDNA HS Assay Kit (Life Technologies, Carlsbad, CA), following the manufacturer's instructions, as an indicator of DNA quality for aCGH analysis.
aCGH analysis
aCGH analyses were performed, as described previously (15). The Genomic DNA ULS Labeling Kit (Agilent Technologies, Santa Clara, CA) was used to label chemically 500 ng of DNA from tumor samples and reference female genomic DNA (Promega, Madison, WI) with Cy5 or Cy3 dyes, respectively, for 30 minutes at 85°C, which was followed by purification using Agilent-KREApure™ columns. The degrees of Cy5 and Cy3 labeling were calculated using a NanoDrop ND-2000 spectrophotometer (NanoDrop Technologies). Purified, labeled samples were then combined and mixed with human Cot-1 DNA (Invitrogen, Carlsbad, CA), Agilent 10 × Blocking Agent, and Agilent 2 × Hybridization Solution. Prior to array hybridization, hybridization mixtures were denatured at 95°anfor three minutes and incubated at 37°C for 30 minutes. An Agilent CGH block was added, and samples were hybridized to the SurePrint G3 Human CGH 8 × 60 K Microarray, which contains eight identical arrays consisting of ∼63,000 in situ synthesized 60-mer oligonucleotide probes that span coding and noncoding sequences with an average spatial resolution of ∼54 kb. Hybridization was carried out at 65°C for 40 hours before washing in Agilent Oligo aCGH Wash Buffer 1 at room temperature for five minutes. This was followed by washing in Agilent Oligo aCGH Wash Buffer 2 at 37°C for one minute. Scanning and image analysis were performed using an Agilent DNA Microarray Scanner. Feature Extraction Software v9.5 was used for data extraction from raw microarray image files. The Agilent Genomic Workbench v6.5 was used to visualize, detect, and analyze chromosomal patterns using an Aberration Detection Method-2 algorithm with the threshold set to 5.5. The derivative log ratio spread (DLRSpread) of each sample, which estimates the log ratio of noise by calculating the spread of log ratio differences between consecutive probes along all chromosomes, was used as an indicator of quality for aCGH analysis. A copy number gain was defined as a log2 ratio >0.30 and a copy number loss was defined as a log2 ratio <−0.30.
Statistical analysis
Kruskal–Wallis or Cochran–Armitage tests were used to assess clinicopathologic factors of patients in this study. The Jonckheere–Terpstra test was used to assess associations between the histological type of FTs (WFC, MFC, FA) and the results of preoperative cytology, and to assess differences in the level of 53BP1 expression or the total length of CNA by aCGH and the histological type of FTs. Spearman's correlation coefficients based on rank tests were used to assess the correlation between 53BP1 expression and the total length of CNA by aCGH. The PHREG procedure in SAS v8.2 (SAS Institute, Cary, NC) was used for calculations. All tests were one-tailed, and a p-value of <0.05 was considered statistically significant.
Results
53BP1 expression in thyroid FTs
Representative images of the staining pattern of 53BP1 expression based on IF are shown in Figure 2. The IF analysis of 53BP1 expression revealed the heterogeneous distribution of 53BP1 NF in FT sections. Specifically, more frequent expression of 53BP1 NF was found in the invasive front or subcapsular area compared to that in the center portion of FTs, which were defined as shown in Figure 1. Therefore, 53BP1 expression was clarified at the site of the subcapsular areas of FTs. Based on these results, a significant difference was found in the number of 53BP1 NF among different histological types of FTs. Representative images of IF analysis of 53BP1 expression in each FT histological type are presented in Figure 3. The median incidences of follicular cells expressing 53BP1 NF were 6.9%, 20.9%, 28.3%, and 36.4% in non-tumor follicles (NTFs), FAs, MFCs, and WFCs, respectively. Furthermore, the median incidences of follicular cells expressing the high DDR type were 0%, 4.3%, 6.4%, and 9.9% in NTFs, FAs, MFCs, and WFCs, respectively. Statistical analysis revealed a significant association between 53BP1 NF/high DDR type and the histological type of FTs (p < 0.001, Figs. 4 and 5, respectively). The incidence of 53BP1 NF and high DDR type was significantly increased with disease progression in the following order: NTFs, FAs, MFCs, and WFCs. Adopting 3.1% as a cutoff value to distinguish FC from FA, the sensitivity and specificity values were 90.5% and 77.8%, respectively (Fig. 5).
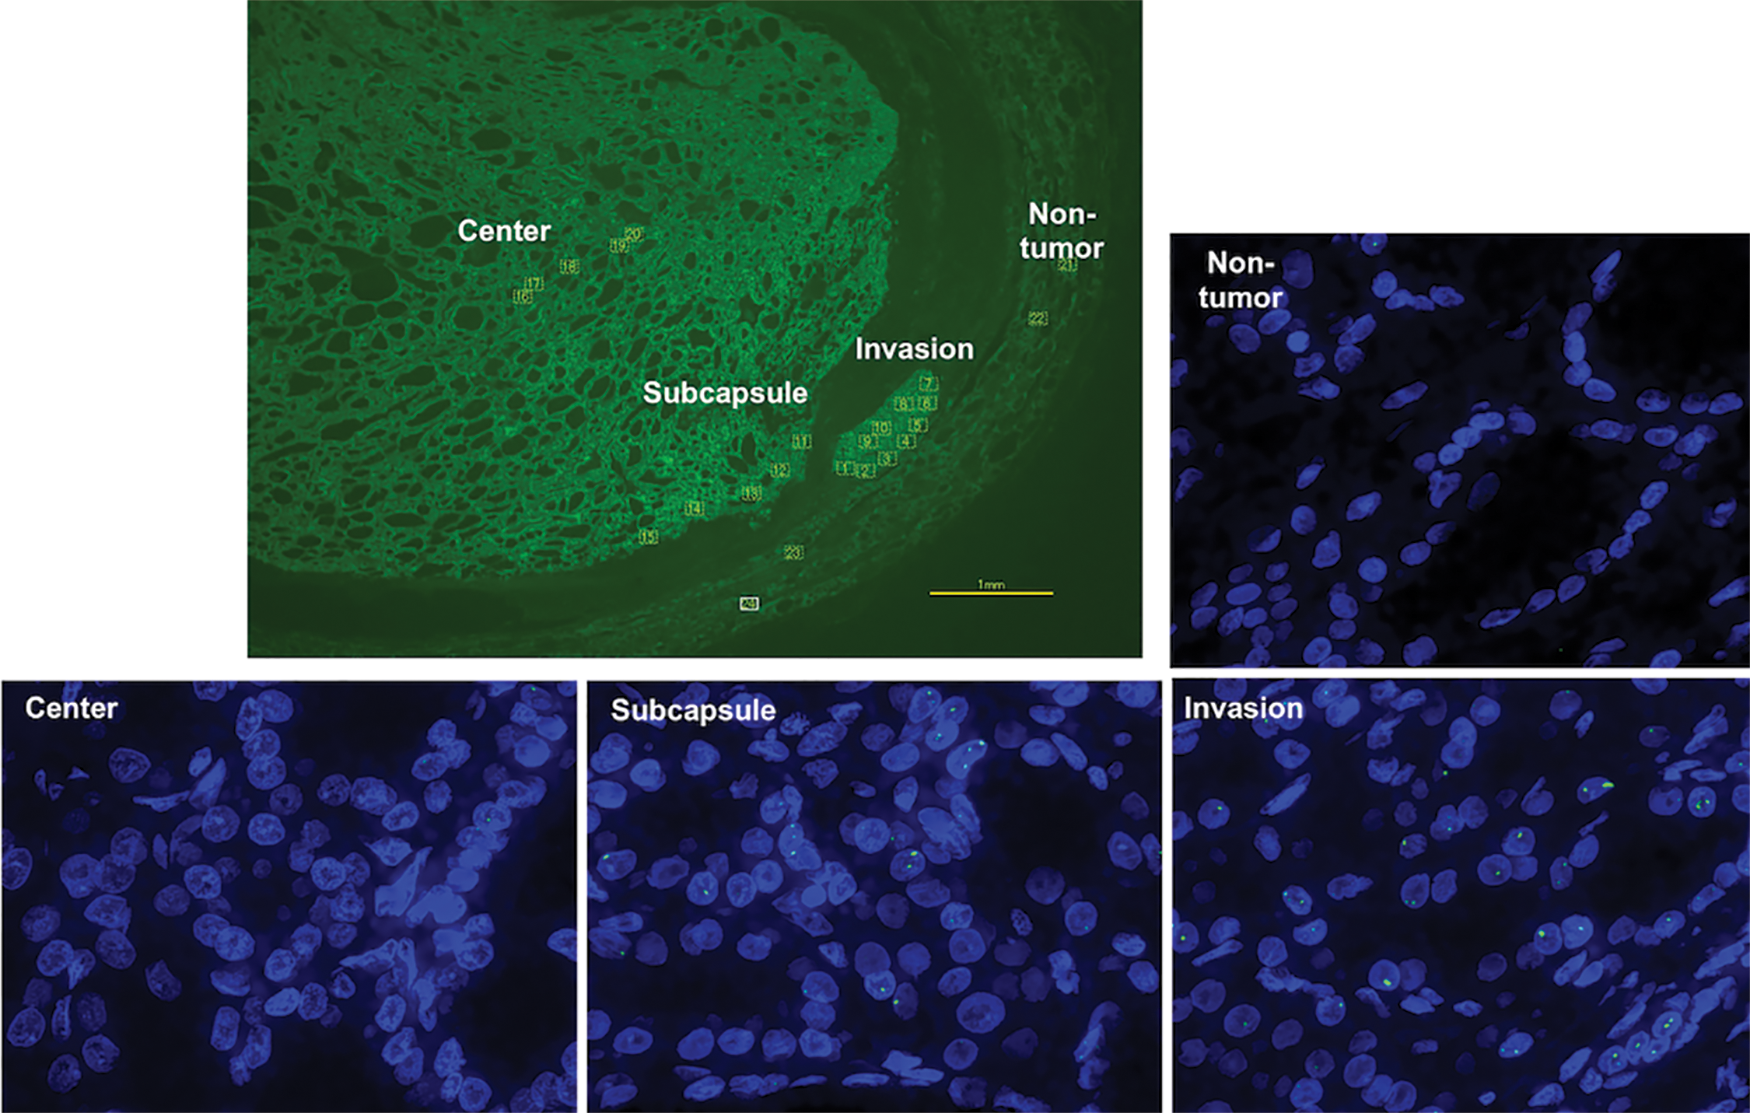
Representative images of immunofluorescence analysis of 53BP1 expression in a FT. The incidence of 53BP1 NF was higher with invasion and in subcapsular areas compared to that in the center of the tumor or non-tumor thyroid. Color images are available online.
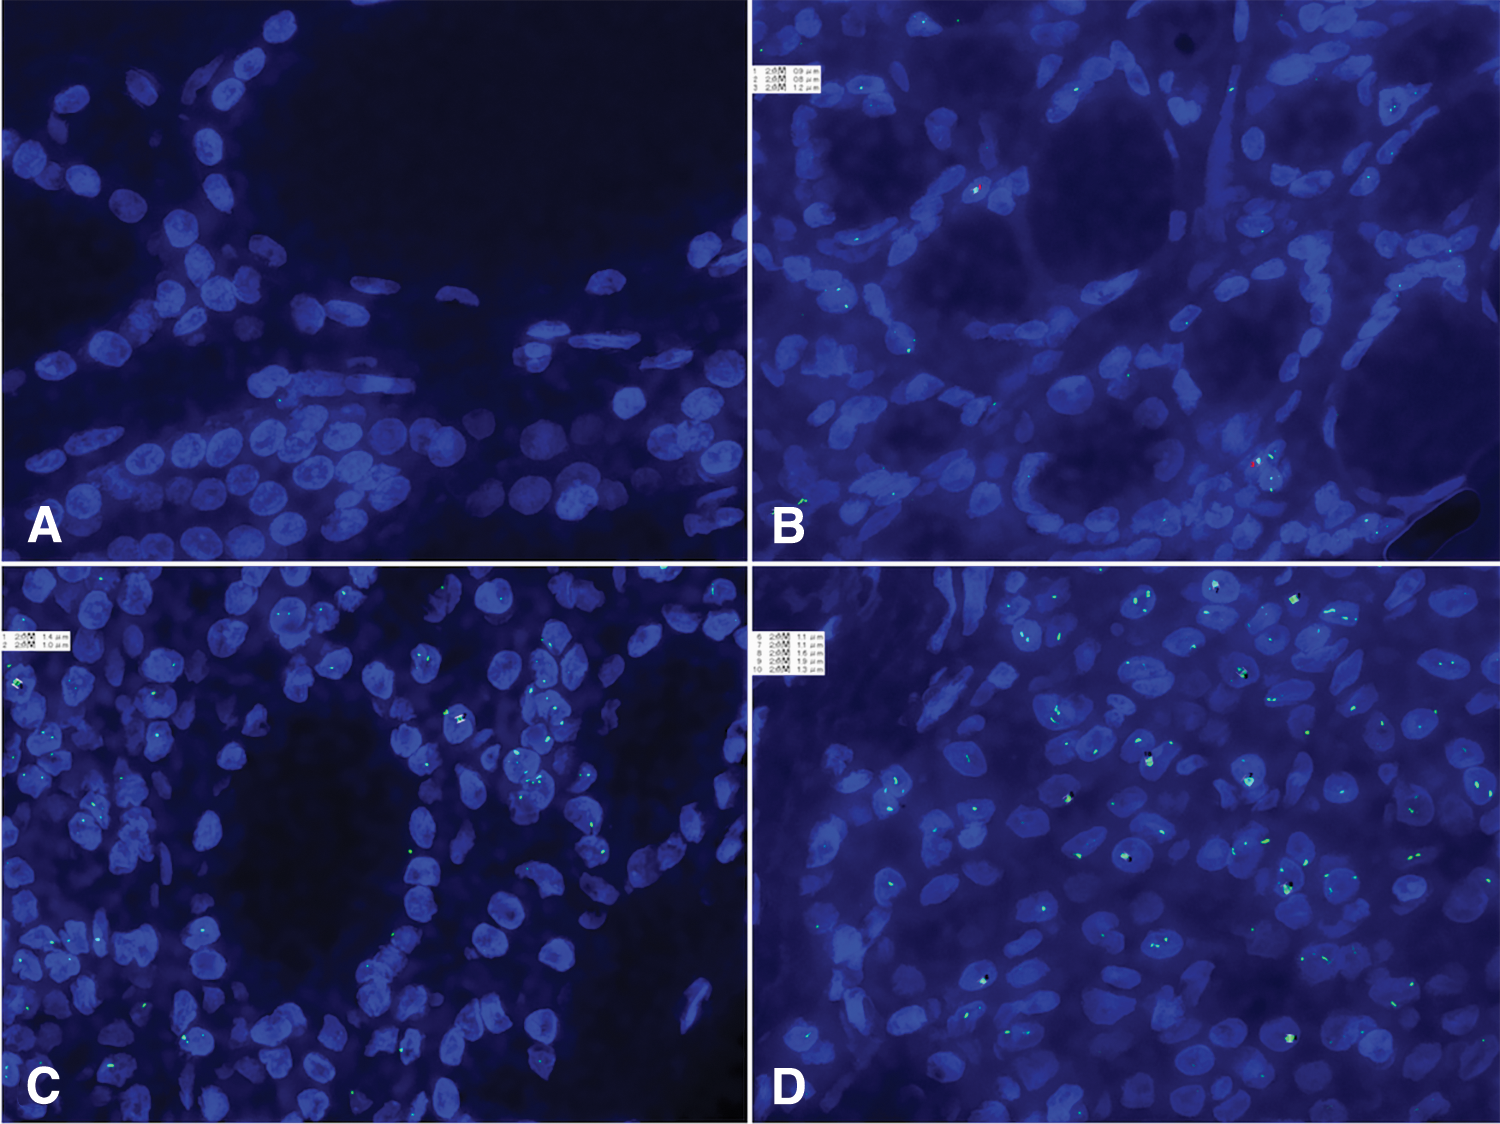
Immunofluorescence analysis of 53BP1 expression in FTs of the thyroid. The incidence of 53BP1 NF in follicular cells was increasingly observed with FT progression based on the following order: (
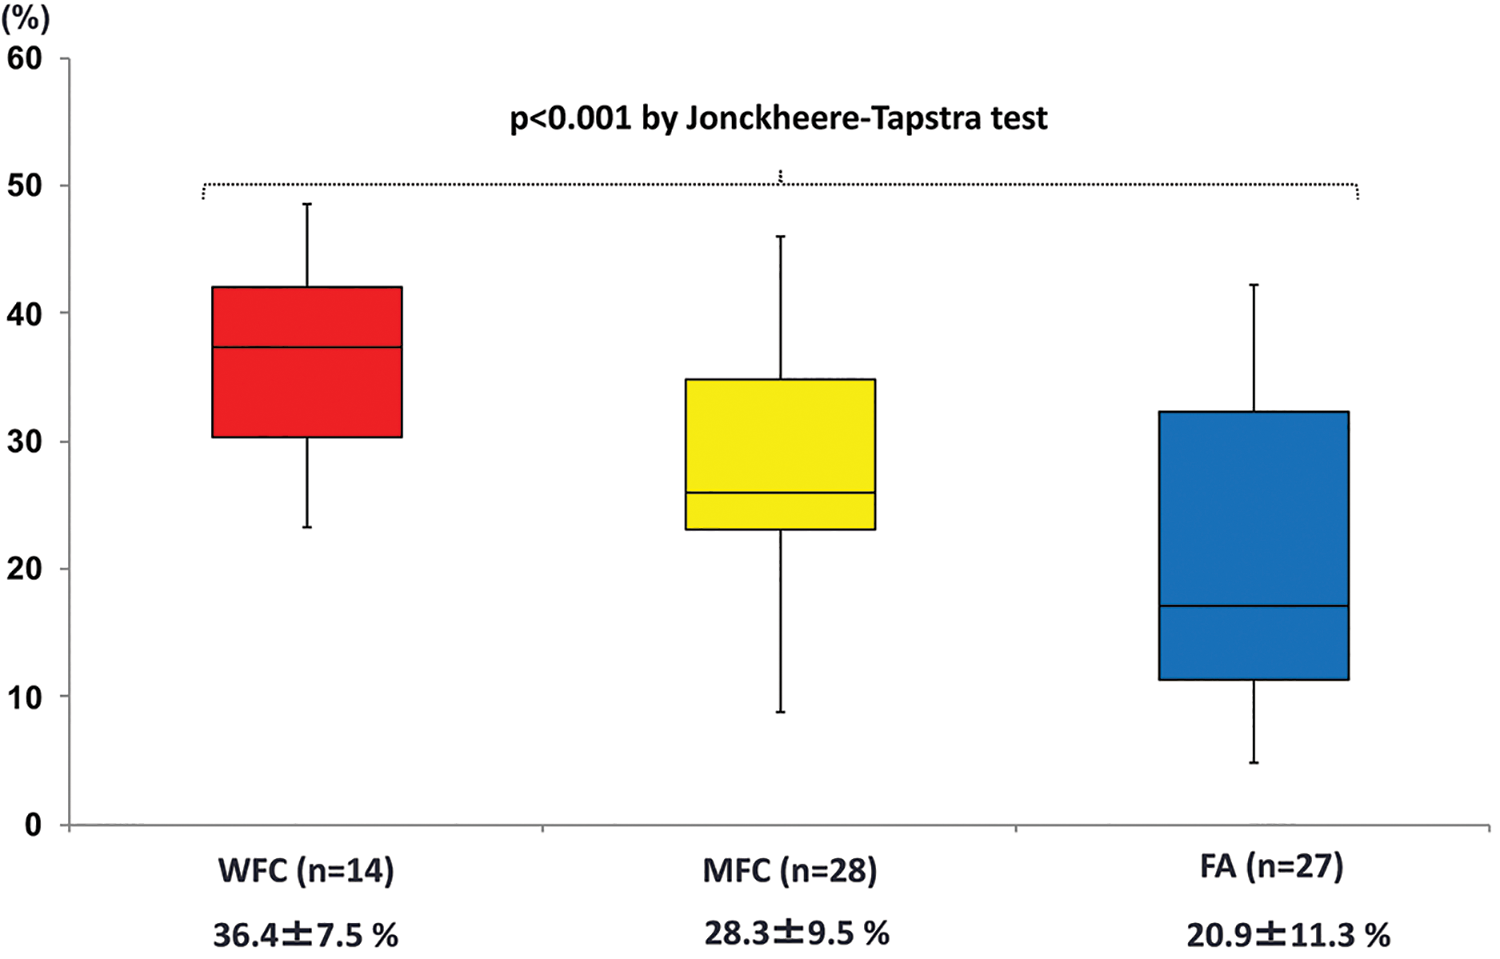
Comparison of median incidences of follicular cells expressing 53BP1 NF among FTs of the thyroid. The incidence of 53BP1 NF, which was measured in the subcapsular area of tumors, significantly (p < 0.001) increased in the following order: FA, MFC, and WFC. Color images are available online.
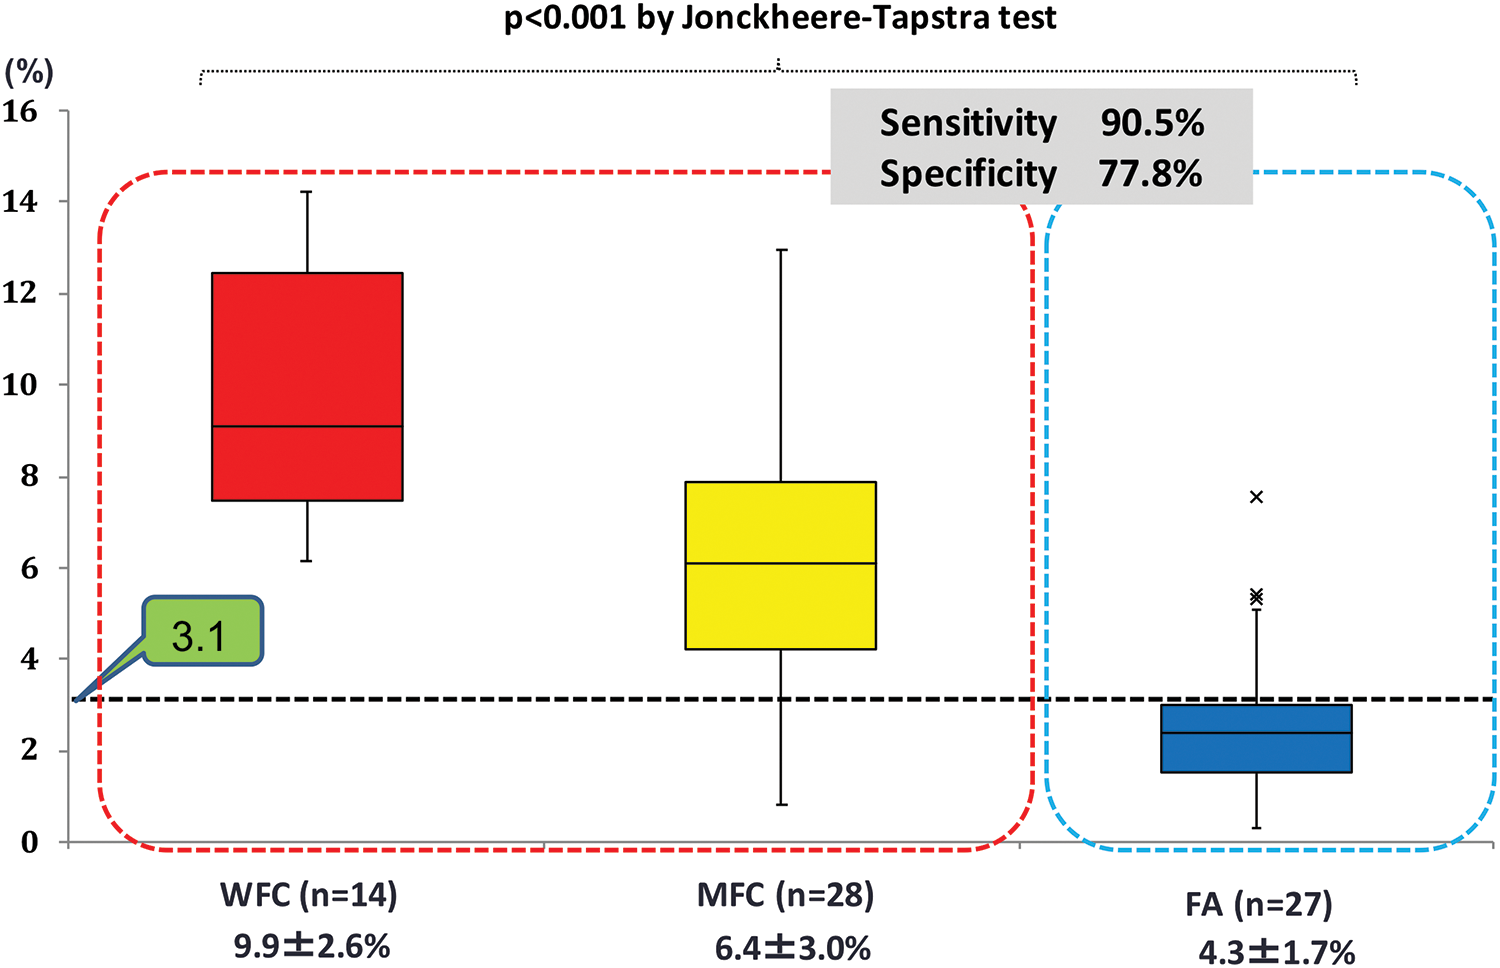
Comparison of median incidences of follicular cells expressing the high DDR type of 53BP1 among FTs of the thyroid. The incidence of high DDR type 53BP1 expression, which was measured in the subcapsular areas of tumors, significantly (p < 0.001) increased in the following order: FA, MFC, and WFC. Upon adopting a 3.1% cutoff value for the incidence of the high DDR type, this model could differentiate FC or FA among 69 FT cases with a sensitivity of 90.5% and a specificity of 77.8%. Color images are available online.
Validation of IF analysis for 53BP1 expression to detect DNA DSBs using FFPE sections
As shown in Figure 6, the IF method for assessing 53BP1 expression clearly demonstrated NF in rat thyroid follicular cells after irradiation. No 53BP1 NF were found in non-irradiated rat thyroid glands, whereas the number of NF per cell was increased in a dose-dependent manner, suggesting the specific detection of 53BP1 NF at sites of irradiation-induced DSBs in FFPE sections.
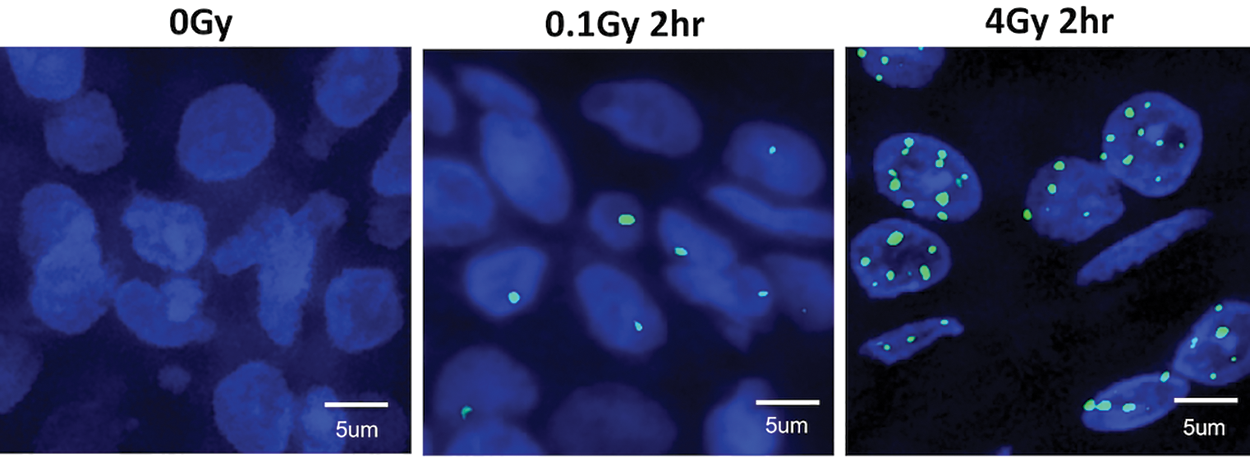
Immunofluorescence analysis of 53BP1 expression in irradiated rat thyroid tissues to detect DNA double-strand breaks (DSBs) using formalin-fixed paraffin-embedded sections. No 53BP1 NF were observed in non-irradiated thyroid tissues, whereas the number of NF per cell was increased with irradiation in a dose-dependent manner. Color images are available online.
Correlation between type of 53BP1 expression and CNA by aCGH
The correlation between the type of 53BP1 expression and CNA was further examined as another hallmark of GIN. The degree of CNA was measured by aCGH in FFPE samples that met the DNA quality standard for this assessment, which included eight FAs, 10 MFCs, and nine WFCs in our series. The quality of aCGH data was considered acceptable, with a DLRSpread of 0.38 (range 0.20–0.69). The mean total numbers of CNAs were 25.7, 32.2, and 120.8 Mbp in FAs, MFCs, and WFCs, respectively, which was not significantly different based on FT histologic type (p = 0.656; Fig. 7). Furthermore, the correlation diagram comparing the total number of CNAs and the proportion of tumor cells expressing 53BP1 NF is shown in Figure 8. Statistical analysis of Spearman's correlation coefficients based on the rank test revealed no significant correlation between the degree of CNA and 53BP1 NF or the high DDR type in FTs (p = 0.226 and 0.779, respectively). According to CNA at the single chromosome level, the results identified a gain of 19p13.2 in 4/8 (50%) FAs, and a gain of 8q24.3 in 3/8 (37.5%) FAs, 6/10 (60%) MFCs, and 4/9 (44%) WFCs. However, significant correlations were not found between these alterations and the type of 53BP1 expression.

Comparison of the mean total number of copy number aberrations (CNAs) by array comparative genomic hybridization (aCGH) among FTs of the thyroid. No significant differences in CNAs were observed among histologic types of FTs, including FA, MFC, and WFC (p = 0.656). Color images are available online.
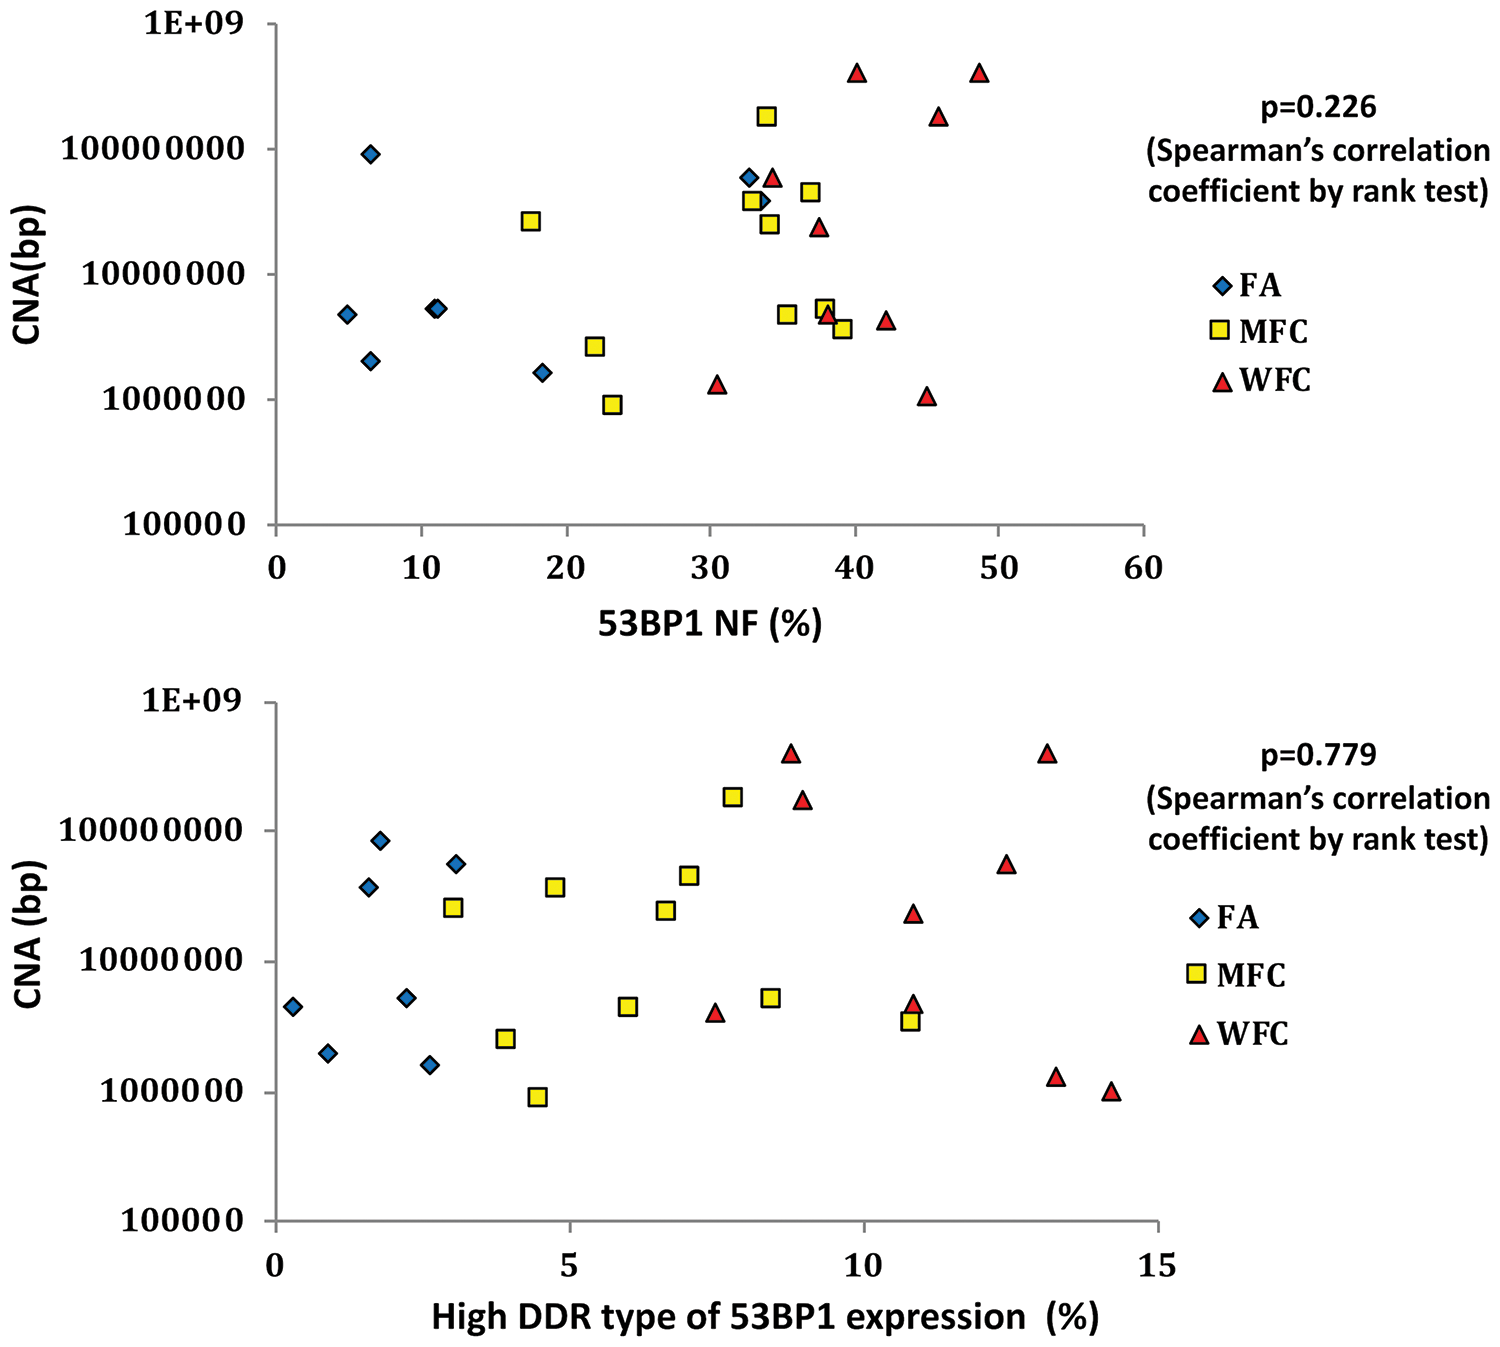
Diagram of the correlation between total number of CNAs, based on aCGH, and the incidence of tumor cells expressing 53BP1 NF in FTs. No significant correlation between the number of CNAs and the expression of 53BP1 NF or the high DDR type was observed in FTs, including FA, MFC, and WFC (p = 0.226 and 0.779, respectively). Color images are available online.
Discussion
The present study clearly demonstrates the existence of differences in 53BP1 expression at NF, particularly with respect to the incidence of tumor cells expressing the high DDR type, between FA and FC. The prevalence of the high DDR type of 53BP1 immunoreactivity in follicular cells appeared to increase with FT progression. As evident in a validation experiment using irradiated rat thyroid glands, the presence of NF or DDR type 53BP1 immunoreactivity was found to be concordant with the induction of DNA DSBs in follicular cells. Furthermore, a supplementary experiment based on double IF analysis revealed a frequent co-localization of 53BP1 and γ-H2AX NF in all examined FTs (10 cases), as well as in irradiated rat thyroid glands, suggesting that endogenous activation of the DDR in tumor cells is a hallmark of GIN (Supplementary Fig. S1). These results indicate a higher level of GIN in FCs compared to that in FAs. However, although CNAs (based on aCGH analysis), as another hallmark of GIN and representing chromosomal loss and gain (13,14,21 –23), tended to increase with FT progression, no significant difference was observed among FA, MFC, and WFC samples. Previous reports also suggested no significant differences in CNAs between FC and FA (24,25). Furthermore, we could not demonstrate a significant correlation between CNA levels and the DDR type of 53BP1 immunoreactivity in FTs. Thus, upon comparing these two indicators of GIN, the incidence of 53BP1 NF, reflecting endogenous DNA DSBs, based on IF, could be more accurate in estimating the malignant potential of FTs compared to that with CNA-based aCGH analysis. Interestingly, the IF analysis revealed a heterogenous distribution of 53BP1 NF, which was more frequent in the invasive front or the subcapsular area compared to that in the center of the tumor, suggesting intratumoral heterogeneity of GIN in FTs. Thus, the intratumoral heterogeneity based on CNA levels should be further elucidated. A a previous study suggested the presence of tumor heterogeneity in FC based on aCGH (26).
According to the 2017 Bethesda System for Reporting Thyroid Cytology, in the cases of category III or IV, molecular testing is recommended to obtain further diagnostic information. Several molecular techniques have been developed for the preoperative diagnosis of FTs (5 –7), but there is no definitive method that can clearly distinguish between benign tumors and malignancy. Although there are several publications analyzing differences in CNAs among FTs by aCGH (25 –32), to the best of the authors' knowledge, any specific features that can distinguish FA or FC, which can be reliably used in clinical practice, have not yet been identified. The gene expression classifier Afirma® Thyroid FNA Analysis is available for the preoperative risk assessment of thyroid nodules with indeterminate FNAC in clinical practice (33). This diagnostic test is based on a microarray gene expression assay measuring the expression of 167 genes using FNAC samples and was found to identify 78/85 nodules correctly as suspicious for malignancy (92% sensitivity), with a specificity of 52% among 265 cytologically indeterminate nodules (33). For nodules classified as FN/SFN, the sensitivity was 90% and the specificity was 49%, suggesting difficulties in correctly recognizing benign FT with this assay (33). More recently, the next-generation sequencing (NGS)-based ThyroSeq® using FNAC samples was also made available (34). The ThyroSeq v2.1 panel detects known thyroid cancer-associated molecular alterations, including 14 genetic point mutations and 42 types of fusion genes (34). By analyzing 462 AUS/FLUS nodules of thyroid follicular cells, this test revealed that 31 (6.7%) were positive for mutations. Among them, 26 (84%) were surgically removed, and 20 (77%) malignant and six (23%) benign lesions were histologically confirmed. Based on these results, all 20 malignant nodules were PTC, including 18 follicular variants. The authors finally concluded that ThyroSeq v2.1 was able to classify 20/22 cancers correctly, showing a sensitivity of 90.9%, a specificity of 92.1%, a positive predictive value of 76.9%, and a negative predictive value of 97.2%, with an overall accuracy of 91.8%. Thus, although the accuracy of molecular assays using FNAC samples has recently improved, it is still difficult to predict FCs correctly with a cytology in the Bethesda categories III (AUS/FLUS) and IV (FN/SFN), even by using modern techniques, and thus these methodologies require further improvements.
In summary, this retrospective study suggests that the incidence of high DDR type 53BP1 immunoreactivity in FTs could be an attractive candidate biomarker to distinguish FC from FA. Indeed, when 3.1% was adopted as a cutoff value for the incidence of high DDR type, this test could differentiate FC or FA among 69 FFPE FT samples with a sensitivity of 90.5% and a specificity of 77.8%. Although it is limited by the lower specificity, which means that a significant fraction of FA is not distinguishable, it is proposed that IF analysis of 53BP1 expression could represent a novel diagnostic method to estimate the malignant potential of thyroid FTs based on postoperative FFPE samples. Because 53BP1 NF reflect spontaneously occurring DNA DSBs, it is hypothesized that the incidence of these foci can represent the level of GIN in tumor cells. IF analysis is associated with a much lower cost and is technically easier compared to microarray gene expression assays or NGS assays. It can also be used with both FFPE and FNAC samples. Thus, IF analysis of 53BP1 expression will not only be an ancillary histologic technique to diagnose FTs accurately, but also a novel technique to make preoperative diagnoses based on FNAC from the invasive front or subcapsular portion of FTs. Further studies using cytologic specimens are required to confirm this notion in the near future.
Footnotes
Acknowledgments
This work was supported in part through the Atomic Bomb Disease Institute, Nagasaki University, by a Grant-in-Aid for Scientific Research from the Japanese Ministry of Education, Science, Sports and Culture (No. 24590414, No. 26461951), and by the Program of the Network-Type Joint Usage/Research Center for Radiation Disaster Medical Science.
Author Disclosure Statement
The authors have stated that they have no conflicts of interest.
Supplementary Material
Supplementary Figure S1