
Abstract
Background:
Anaplastic thyroid carcinoma (ATC) is one of the most aggressive malignancies, with no effective treatment currently available. The molecular mechanisms of ATC carcinogenesis remain poorly understood. The objective of this study was to investigate the mechanisms and functions of super-enhancer (SE)-driven oncogenic transcriptional addiction in the progression of ATC and identify new drug targets for ATC treatments.
Methods:
High-throughput chemical screening was performed to identify new drugs inhibiting ATC cell growth. Cell viability assay, colony formation analysis, cell-cycle analysis, and animal study were used to examine the effects of drug treatments on ATC progression. Chromatin immunoprecipitation sequencing was conducted to establish a SE landscape of ATC. Integrative analysis of RNA sequencing, chromatin immunoprecipitation sequencing, and CRISPR/Cas9-mediated gene editing was used to identify THZ1 target genes. Drug combination analysis was performed to assess drug synergy. Patient samples were analyzed to evaluate candidate biomarkers of prognosis in ATC.
Results:
THZ1, a covalent inhibitor of cyclin-dependent kinase 7 (CDK7), was identified as a potent anti-ATC compound by high-throughput chemical screening. ATC cells, but not papillary thyroid carcinoma cells, are exceptionally sensitive to CDK7 inhibition. An integrative analysis of both gene expression profiles and SE features revealed that the SE-mediated oncogenic transcriptional amplification mediates the vulnerability of ATC cells to THZ1 treatment. Combining this integrative analysis with functional assays led to the discovery of a number of novel cancer genes of ATC, including PPP1R15A, SMG9, and KLF2. Inhibition of PPP1R15A with Guanabenz or Sephin1 greatly suppresses ATC growth. Significantly, the expression level of PPP1R15A is correlated with CDK7 expression in ATC tissue samples. Elevated expression of PPP1R15A and CDK7 are both associated with poor clinical prognosis in ATC patients. Importantly, CDK7 or PPP1R15A inhibition sensitizes ATC cells to conventional chemotherapy.
Conclusions:
Taken together, these findings demonstrate transcriptional addiction in ATC pathobiology and identify CDK7 and PPP1R15A as potential biomarkers and therapeutic targets for ATC.
Introduction
Anaplastic thyroid carcinoma (ATC) is one of the most aggressive cancers in humans, with a median survival of six months regardless of stage (1). Although ATC is rare and represents only 1–2% of clinically recognized thyroid cancers, it accounts for 15–39% of thyroid cancer–related deaths (1). At the time of diagnosis, for most patients with ATC, the tumor has grown beyond the thyroid gland and invaded surrounding tissues of the neck, making complete resection of tumors impossible. The conventional therapeutic strategies for thyroid cancers, including radioiodine therapy, chemotherapy, and radiotherapy, fail to prevent ATC progression or mortality (2). In addition, ATC patients receive marginal survival benefits from current targeted therapies, including tyrosine kinase inhibitors, histone deacetylase inhibitors, antiangiogenic therapy, vascular disrupting agents, and peroxisomal proliferator-activated receptor-γ agonists (2 –4). Therefore, understanding of the molecular mechanisms underlying ATC pathogenesis and identification of novel drug targets are urgently needed for developing effective therapeutic interventions.
Transcriptional dysregulation is a hallmark of cancer (5). The aberrant transcriptional programs cause cancer cells to become highly addicted to certain regulators of gene transcription (6). Gene transcription is regulated by a group of cyclin-dependent kinases (CDKs), termed transcriptional CDKs (CDK7, CDK8, CDK9, CDK12, and CDK13). These transcriptional CDKs, especially CDK7 and CDK9, function to facilitate transcription initiation and promote productive elongation by phosphorylating carboxy-terminal domain (CTD) of RNA polymerase II (RNAPII). Recent studies have identified a subset of aggressive cancers with exceptional sensitivity to CDK7 inhibition, including triple-negative breast cancer, T-cell acute lymphoblastic leukemia, small-cell lung cancer, MYCN-dependent neuroblastoma, esophageal squamous-cell carcinoma, nasopharyngeal carcinoma, and aggressive ovarian cancer (7 –14). Vulnerability of these malignant tumors to CDK7 inhibition has been shown to be mediated by super-enhancer (SE)-driven oncogenic transcriptional programs. SEs are defined as large clusters of enhancers that are densely loaded with master transcription factors, mediator complex, and chromatin regulators (15). In many cancers, the key oncogenic drivers, including oncogenic transcriptional regulators, are frequently associated with SEs (15,16). Thus, SE profiling might serve as a useful approach to identify pivotal cancer genes.
Prior studies have characterized the ATC mutational landscape via genome-wide sequencing analyses (17 –19). Several transcriptional regulators, such as TP53, subunits of SWI/SNF chromatin remodeling complex, and histone methyltransferases, are among the most frequently mutated genes (19). Mutations of these transcriptional regulators may produce a profound change in the transcriptional programs, thereby driving the cancer state of ATC. Therefore, it was hypothesized that targeting the misregulated transcriptional programs may represent a novel therapeutic strategy for ATC.
This study identified THZ1, a covalent CDK7 inhibitor, as a highly potent anti-ATC compound. Moreover, the SE landscape was characterized in ATC cells, and it was found that THZ1 inhibits ATC growth by suppressing the SE-linked oncogenic transcriptional addiction in ATC.
Methods
Cell culture
8505C and CAL-62 cell lines were kindly provided by Professor Haixia Guan (The First Hospital of China Medical University, P.R. China). K1, BCPAP, and 8305C cell lines were purchased from Guangzhou Cellcook Biotech Co. (Guangzhou, P.R. China). C643, Hth-7, KMH-2, and KTC-1 cell lines were purchased from the Chinese Academy of Science (Shanghai, P.R. China). K1, BCPAP, KTC-1, C643, 8305C, and 8505C cells were cultured in RPMI 1640 medium supplemented with 10% fetal bovine serum (FBS) and 1% penicillin/streptomycin. KMH-2 and Hth-7 cells were cultured in Dulbecco's modified Eagle's medium (DMEM) supplemented with 10% FBS. CAL-62 cells were cultured in DMEM supplemented with 20% FBS. Cells were maintained at 37°C in a humidified atmosphere with 5% CO2. All cell lines were authenticated by short tandem repeat (STR) analysis performed by Guangzhou Cellcook Biotech Co., Shanghai Biowing Biotechnology Co. (Shanghai, P.R. China), or GENEWIZ, Inc. (Guangzhou, P.R. China). The STR profile of 8505C cells yields an 88.88% match to the reference cell line in the Cellosaurus database. The STR profiles of other cell lines are 100% matched to the published data. The STR profiling reports are included in Supplementary Data S1.
Cell viability assay
Cells were seeded on 96-well plates at a density of 2000 cells/well. After 12 hours, cells were treated with drugs. After 48 hours of incubation, cells were analyzed for cell viability using the CellTiter 96®AQueous One Solution Cell Proliferation Assay and CellTiter-Glo® Luminescent Cell Viability Assay (Promega, Madison, WI). Dose–response curves were generated using GraphPad Prism version 6.02 (GraphPad Software, Inc., La Jolla, CA). All assays were performed in biological triplicate.
The drug library was purchased from TargetMol (Wellesley Hills, MA). Guanabenz acetate was purchased from Selleck Chemicals (Houston, TX). Doxorubicin hydrochloride and paclitaxel were purchased from MedChemExpress (Monmouth Junction, NJ).
Drug combination
Cells were seeded in 96-well plates at a density of 2000 cells/well. After 12 hours, cells were treated with the indicated doses of drugs for 48 hours, and cell viability was measured. CalcuSyn version 2.1 (BIOSOFT, Cambridge, United Kingdom) was used to determine synergism and antagonism. A combination index (CI) plot is a Fa–CI plot in which CI <1, = 1, and >1 indicate synergism, additive effect, and antagonism, respectively. Fa indicates the fraction that is inhibited by the drug.
Cell apoptosis assay
Cells were seeded on a six-well plate at 30% confluency. After 12 hours, cells were treated with THZ1. Cell death was assessed using a FITC Annexin V/PI Apoptosis Detection kit (BD Biosciences, San Jose, CA) according to the manufacturer's protocol. Data were generated using FlowJo version 7.6.1 (FlowJo, LLC, Ashland, OR).
Cell-cycle analysis
Cells were seeded on a six-well plate at 40% confluency. After 12 hours, cells were treated with THZ1. Cells were first fixed with 80% ethanol at −20
Colony formation assay
Cells were seeded on six-well plates at a density of 500 cells/well. After five days, cells were treated with THZ1 for another five days, with media being replaced by fresh growth media every four days until colonies were visible. Cells were stained with crystal violet solution, and colonies with >50 cells were manually counted. For the long-term clonogenic assays, BCPAP and CAL-62 cells were treated with vehicle or THZ1 (50 nM) for 12 days. Cells were then given fresh medium and allowed to grow for 10 days. Colonies of cells were stained with crystal violet.
Plasmids
LentiCas9-Blast (#52962) and LentiGuide-Puro (#52963) constructs were purchased from Addgene (Watertown, MA). Single guide RNAs (sgRNAs) were designed using sgRNA Designer (Broad Institute). The sgRNA sequences were chosen that match the early coding exons of targeted genes and are listed in Supplementary Table S1.
Immunoblotting analysis
Cells were lysed in RIPA buffer supplemented with proteinase inhibitor cocktail (Roche, Basel, Switzerland) and a phosphatase inhibitor cocktail (Roche). Equal amounts of total protein were separated by sodium dodecyl sulfate polyacrylamide gel electrophoresis, transferred to nitrocellulose membranes, and immunoblotted with the indicated primary antibodies. The sources of antibodies were: RNAPII CTD Ser2P (cat. # 04-1571; Millipore, Burlington, MA), RNAPII CTD Ser5P (cat. # 04-1572; Millipore), RNAPII CTD Ser7P (cat. # 04-1570; Millipore), RNAPII (cat. # ab-817; Abcam, Cambridge, United Kingdom); CDK7 (cat. # 2916; Cell Signaling Technology, Beverly, MA), PARP (cat. # 9542; Cell Signaling Technology), and α-tubulin (cat. # 11224-1-AP; Proteintech, Wuhan, P.R. China).
Animal studies
Suspensions of 2 × 10⁶ CAL-62 or 8505C cells were injected subcutaneously into the flank of six-week-old female BALB/c nude mice (Charles River Laboratories, Beijing, P.R. China). Tumors were measured with a caliper. Tumor volume was calculated using the formula: V = 0.5 × length × width × depth. When the tumor volumes reached approximately 20 mm3, animals were randomly divided into two groups. The animals were then treated with THZ1 (10 mg/kg) or vehicle intraperitoneally twice daily. Tumors were measured every three days. Upon harvest, tumors were fixed in formalin overnight for immunohistochemistry analysis. All the animal studies were approved by the institutional ethical committee of Tianjin Medical University (permit # SYXK 2009-0001).
Immunohistochemistry
The human ATC tissue microarrays were perfused with 10% formalin overnight and paraffin embedded. Tissue specimens were blocked with 3% H2O2 for 15 minutes followed by 5% bovine serum albumin for one hour. Tissue sections were incubated with primary antibodies against CDK7 (cat. # 2916; Cell Signaling Technology), PPP1R15A (cat. # 10449-1-AP; Proteintech), Ki67 (cat. # 9027; Cell Signaling Technology), and CC3 (cat. # 9664; Cell Signaling Technology). Sections were incubated with anti-mouse/rabbit horseradish peroxidase at room temperature for one hour followed by staining with DAB substrate. Samples were counterstained with hematoxylin for three minutes. Immunostaining was evaluated using the H-score method. The immunostaining intensity was graded as low (score 1), moderate (score 2), or strong (score 3). The H-score was calculated by multiplying the percentage of positive cells and immunostaining intensity. Thus, the range of possible scores was from 0 to 300. Scoring <100 was defined as low expression, and scoring 100–300 was defined as high expression. The protocols and informed consent were approved by Tianjin Medical University Cancer Institute and Hospital Ethics Committee.
RNA isolation and quantitative polymerase chain reaction
Total RNA isolation was performed using TRIzol (Invitrogen, Carlsbad, CA). Following isolation, total RNA was reverse transcribed using the cDNA Synthesis Kit (Roche). Gene-specific primer pairs are listed in Supplementary Table S2.
RNA sequencing analysis
Total RNAs from cultured cells were subjected to Oligo dT selection and adaptor ligation. Sequencing was performed on the BGISEQ-500 platform (BGI Group, Shenzhen, P.R. China). Low-quality reads were filtered using internal software SOAPnuke. Clean reads were assembled into unique genes. Clean reads were mapped to reference sequences using Bowtie2. Differential expressed genes between samples were generated by DESeq2 algorithms. Sequencing data were deposited in the Gene Expression Omnibus (GSE120177).
Chromatin immunoprecipitation sequencing and data analysis
BCPAP and CAL-62 cells were cross-linked with 1% formaldehyde for 10 minutes at room temperature. The cross-link was stopped by adding 1/20 volume of 2.5 M glycine. Cells were washed with PBS and harvested using chromatin immunoprecipitation (ChIP) lysis buffer. Cells were then sonicated to obtain fragments (100–500 bp) with a Bioruptor Sonicator. Immunoprecipitation was performed with an H3K27ac antibody (cat. # ab4729; Abcam). After elution and reversal cross-linking, DNA was purified and sequenced on the BGISEQ-500 platform.
ChIP sequencing (ChIP-Seq) data were mapped to the GRCh37/hg19 human reference genome by SOAPaligner/SOAP2 (Short Oligonucleotide Analysis Package). No more than two mismatches were allowed in the alignment. Reads mapped only once at a given locus were allowed for peak calling. ChIP-Seq peaks were generated using the peak finding algorithm Model-based Analysis for ChIP-Seq (MACS) v1.4.2. Big-wig files were generated by MACS v1.4.2. ChIP-Seq tracks were visualized in IGVtools v2.4.5. The total signal of H3K27ac ChIP-Seq is expressed in units of RPM per bin. Peaks within a 12.5 kb interval were merged and stitched using Homer. Stitched enhancers were assigned to the most proximal genes and classified as SEs or TEs by ranking the H3K27ac signal. Sequencing data were deposited in the Gene Expression Omnibus (GSE120177).
Gene ontology analysis and gene set enrichment analysis
Gene ontology (GO) analysis was performed using the DAVID web-tool. Significantly enriched molecular function terms were defined as p < 0.01. Gene set enrichment analysis (GSEA) was performed using the GSEA stand-alone desktop program. Significant enrichment was defined by a false discovery rate value of <0.25.
Statistical analysis
Statistical analyses were performed using IBM SPSS Statistics for Windows v22.0 (IBM Corp., Armonk, NY) or GraphPad Prism v6.02 (GraphPad Software, La Jolla, CA). The results were repeated in at least three independent experiments and are shown as the mean ± standard deviation. An unpaired two-tailed Student's t-test was used to calculate p-values between different treatment cohorts. Two-way analysis of variance was used to compare multiple groups. A Mann–Whitney U-test was used to compare significantly downregulated transcripts in CAL-62 and BCPAP cells.
Results
High-throughput chemical screening identifies THZ1 as a potent inhibitor of ATC
To investigate the roles of transcriptional dysregulation in ATC pathogenesis and discover novel therapeutics, a high-throughput screening was performed in an ATC cell line (CAL-62). A library of 177 compounds was used, with the main focus on targeting transcriptional regulators, including transcriptional CDKs, transcription factors, transcriptional cofactors, and chromatin regulators (Fig. 1A). The sensitivity of CAL-62 cells to each compound was measured by cell viability assay. A total of 27 compounds decreased cell viability by 50% or more at 1 μM comparing to vehicle control (Fig. 1B and Supplementary Table S3). Among the hit compounds, two HDAC inhibitors (Panobinostat and CUDC-907) have previously been shown to possess cytotoxic properties against ATC (20,21), thereby validating this screening approach. To confirm the anti-ATC properties of these compounds further, the cell viability measurement was expanded in four different ATC cell lines (CAL-62, 8505C, 8305C, and C643). All four ATC cell lines showed high sensitivity to THZ1, a newly developed covalent inhibitor of CDK7 (Fig. 1C and Supplementary Table S4). It was further observed that THZ1 suppressed ATC cell growth in a dose-dependent manner (Fig. 1D). Notably, although dimethyl sulfoxide–treated ATC cells proliferated rapidly during three days of culture, the ATC cells ceased growing immediately upon treatment with low nanomolar concentrations of THZ1 treatment (Fig. 1D), thereby identifying THZ1 as a novel potent anti-ATC agent.
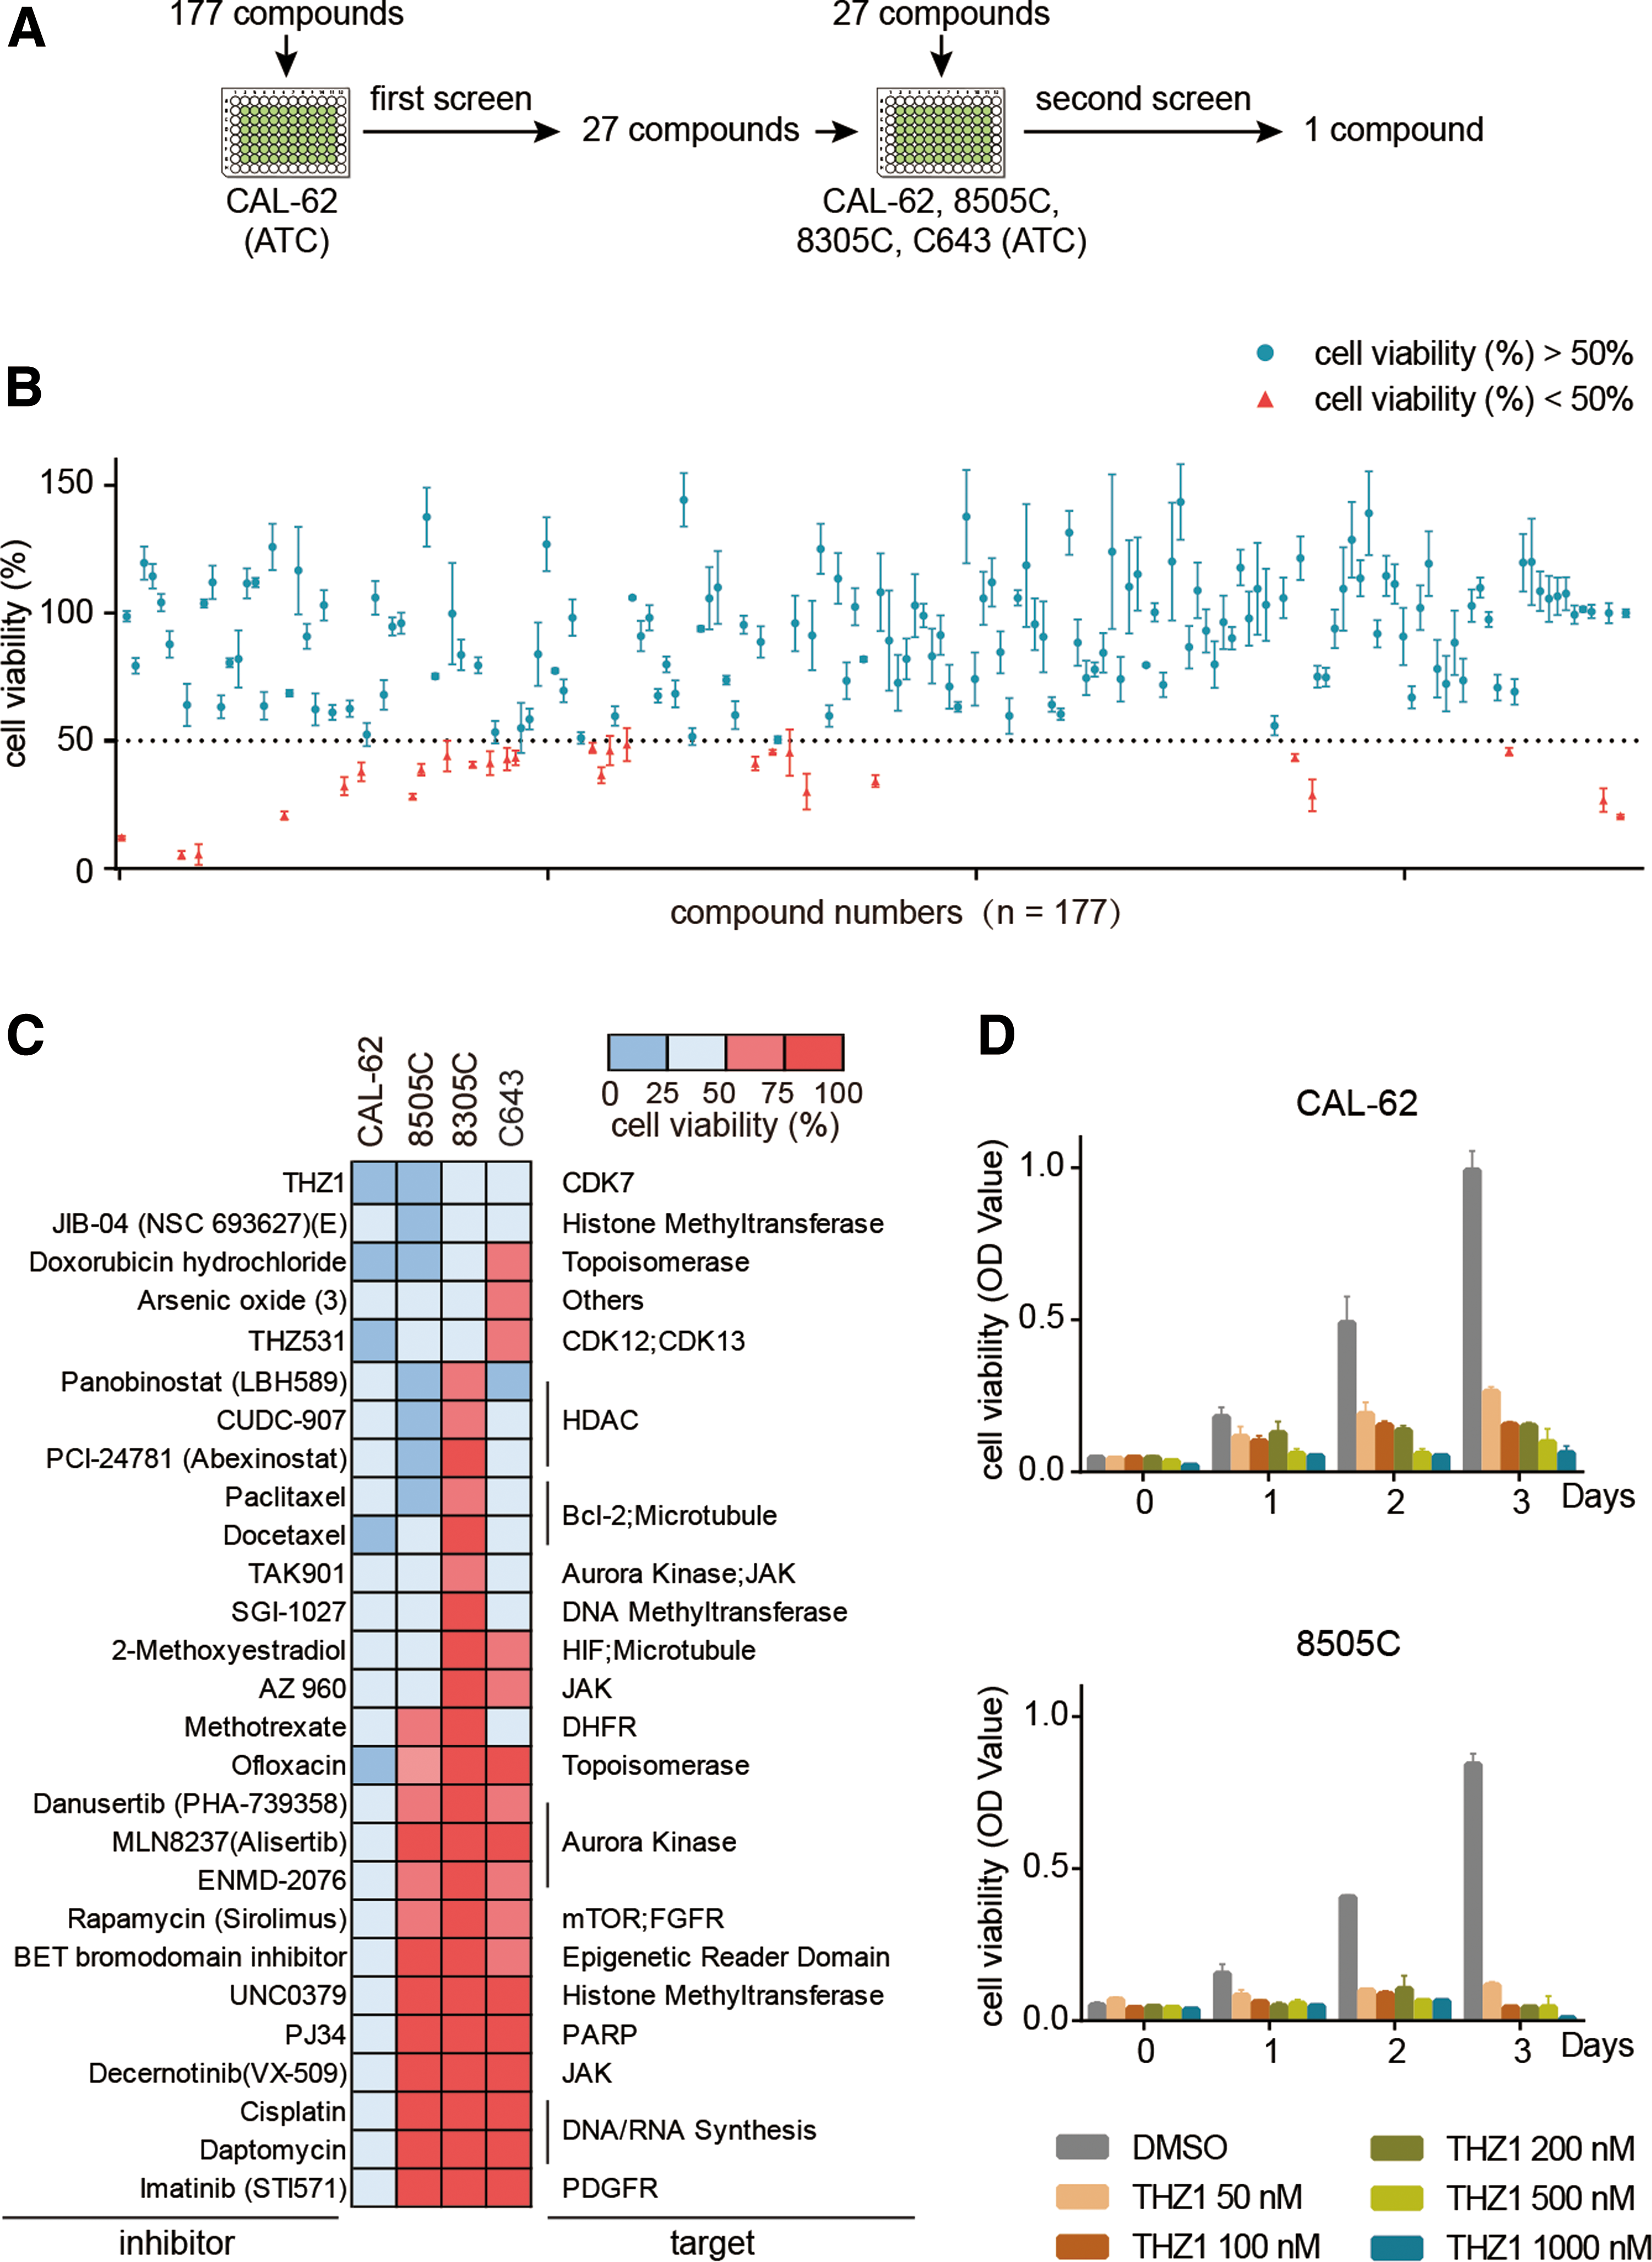
High-throughput small-molecule screen identified THZ1 as a potent inhibitor of anaplastic thyroid carcinoma (ATC) cells. (
THZ1 inhibits ATC cell growth both in vitro and in vivo
It has been reported that some aggressive cancers are highly dependent on the transcriptional function of CDK7, and therefore are exceptionally sensitive to THZ1 treatment. To test whether THZ1 exhibits selective potency in ATC, the effect of THZ1 treatment was analyzed in eight different thyroid cancer cell lines: five ATC cell lines (C643, Hth-7, KMH-2, CAL-62, and 8505C) and three papillary thyroid carcinoma (PTC) cell lines (KTC-1, BCPAP, and K1). As shown in Figure 2A, ATC cells were much more sensitive to low-dose THZ1, with IC50 values averaging five times lower than those of PTC cells. Cell-cycle analysis showed that low-dose THZ1 treatment induced G2/M phase arrest in representative ATC cells but not in PTC cells (Fig. 2B). Consistent with this, colony formation experiments demonstrated that THZ1 selectively blocked the colony formation of ATC cells (Fig. 2C). To evaluate the long-term effect of THZ1, clonogenic grow-out experiments were performed. As shown in Supplementary Figure S1A, THZ1 also selectively inhibited the colony growth of representative ATC cells compared to PTC cells. It was also observed that THZ1 induced massive apoptosis of ATC cells, as analyzed by Annexin V staining and PARP cleavage (Fig. 2D and E). The proliferation rate did not vary significantly between ATC and PTC cells, suggesting drug sensitivity does not correlate with the cell proliferation rate (Supplementary Fig. S1B). Taken together, these results indicate that THZ1 induces selective cytotoxicity in ATC cells.
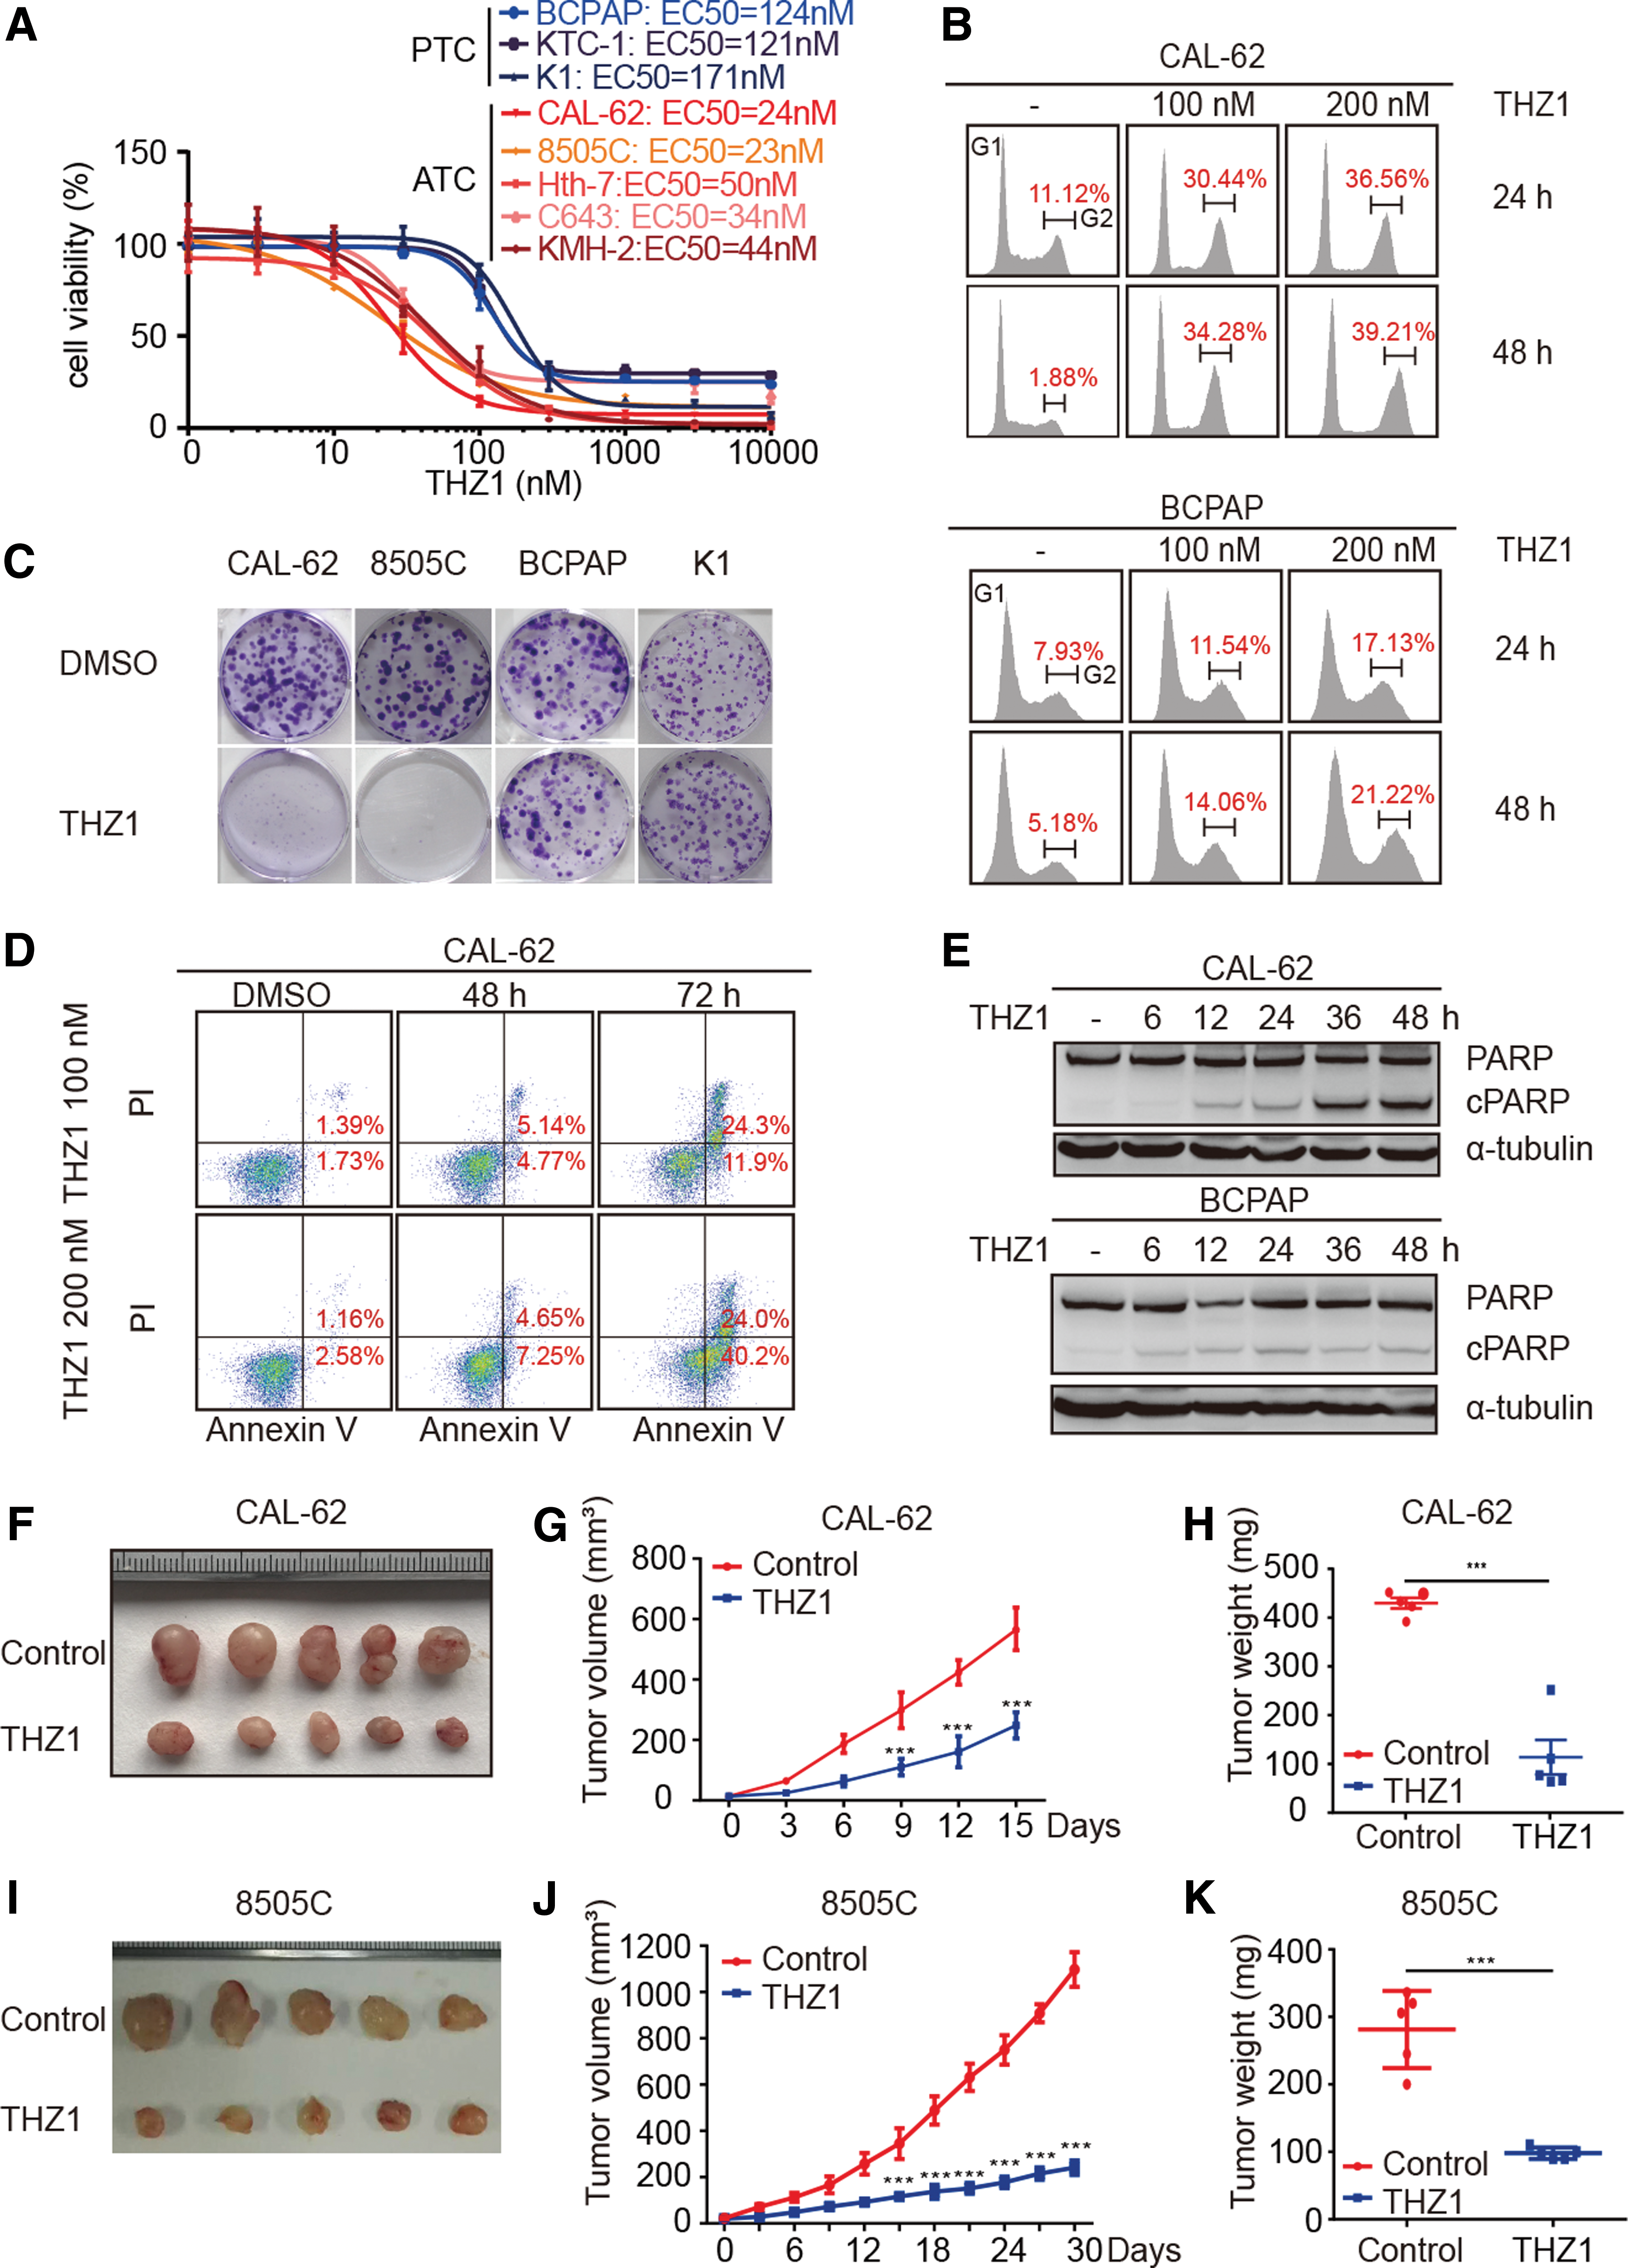
THZ1 exhibits high potency against ATC both in vitro and in vivo. (
Next, the study sought to examine the in vivo anticancer efficacy of THZ1. To do this, a nude mice xenograft model implanted with CAL-62 or 8505C cells was used. The animals were treated with vehicle or THZ1 intravenously twice daily (10 mg/kg). As shown in Figure 2F–K, THZ1 markedly reduced tumor growth in mice. No systemic toxicity was observed, such as body weight loss or behavioral changes (data not shown). Xenografts isolated from THZ1-treated mice had significantly fewer proliferating cells and more apoptotic cells than those derived from vehicle-treated mice, as measured by Ki67 and cleaved caspase-3 (CC3) staining, respectively (Supplementary Fig. S1C–H). Altogether, these results demonstrate that THZ1 has potent anti-ATC activities both in vitro and in vivo.
CDK7 is essential for ATC cell growth and its elevation is associated with poor prognosis in patients with ATC
To corroborate the pharmacological studies, the impact of CDK7 depletion on the biological behaviors of ATC cells was investigated by CRISPR/Cas9-mediated gene editing. The infection with a lentivirus carrying CDK7 sgRNA markedly decreased the abundance of CDK7 protein and Serine 5 phosphorylation of Pol II CTD (Fig. 3A). Notably, depletion of CDK7 reduced cell viability, decreased colony formation, caused G2/M arrest, and induced massive cell apoptosis in ATC cells (Fig. 3B–E). These findings suggest that CDK7 is the pharmacological target of THZ1 in ATC cells.
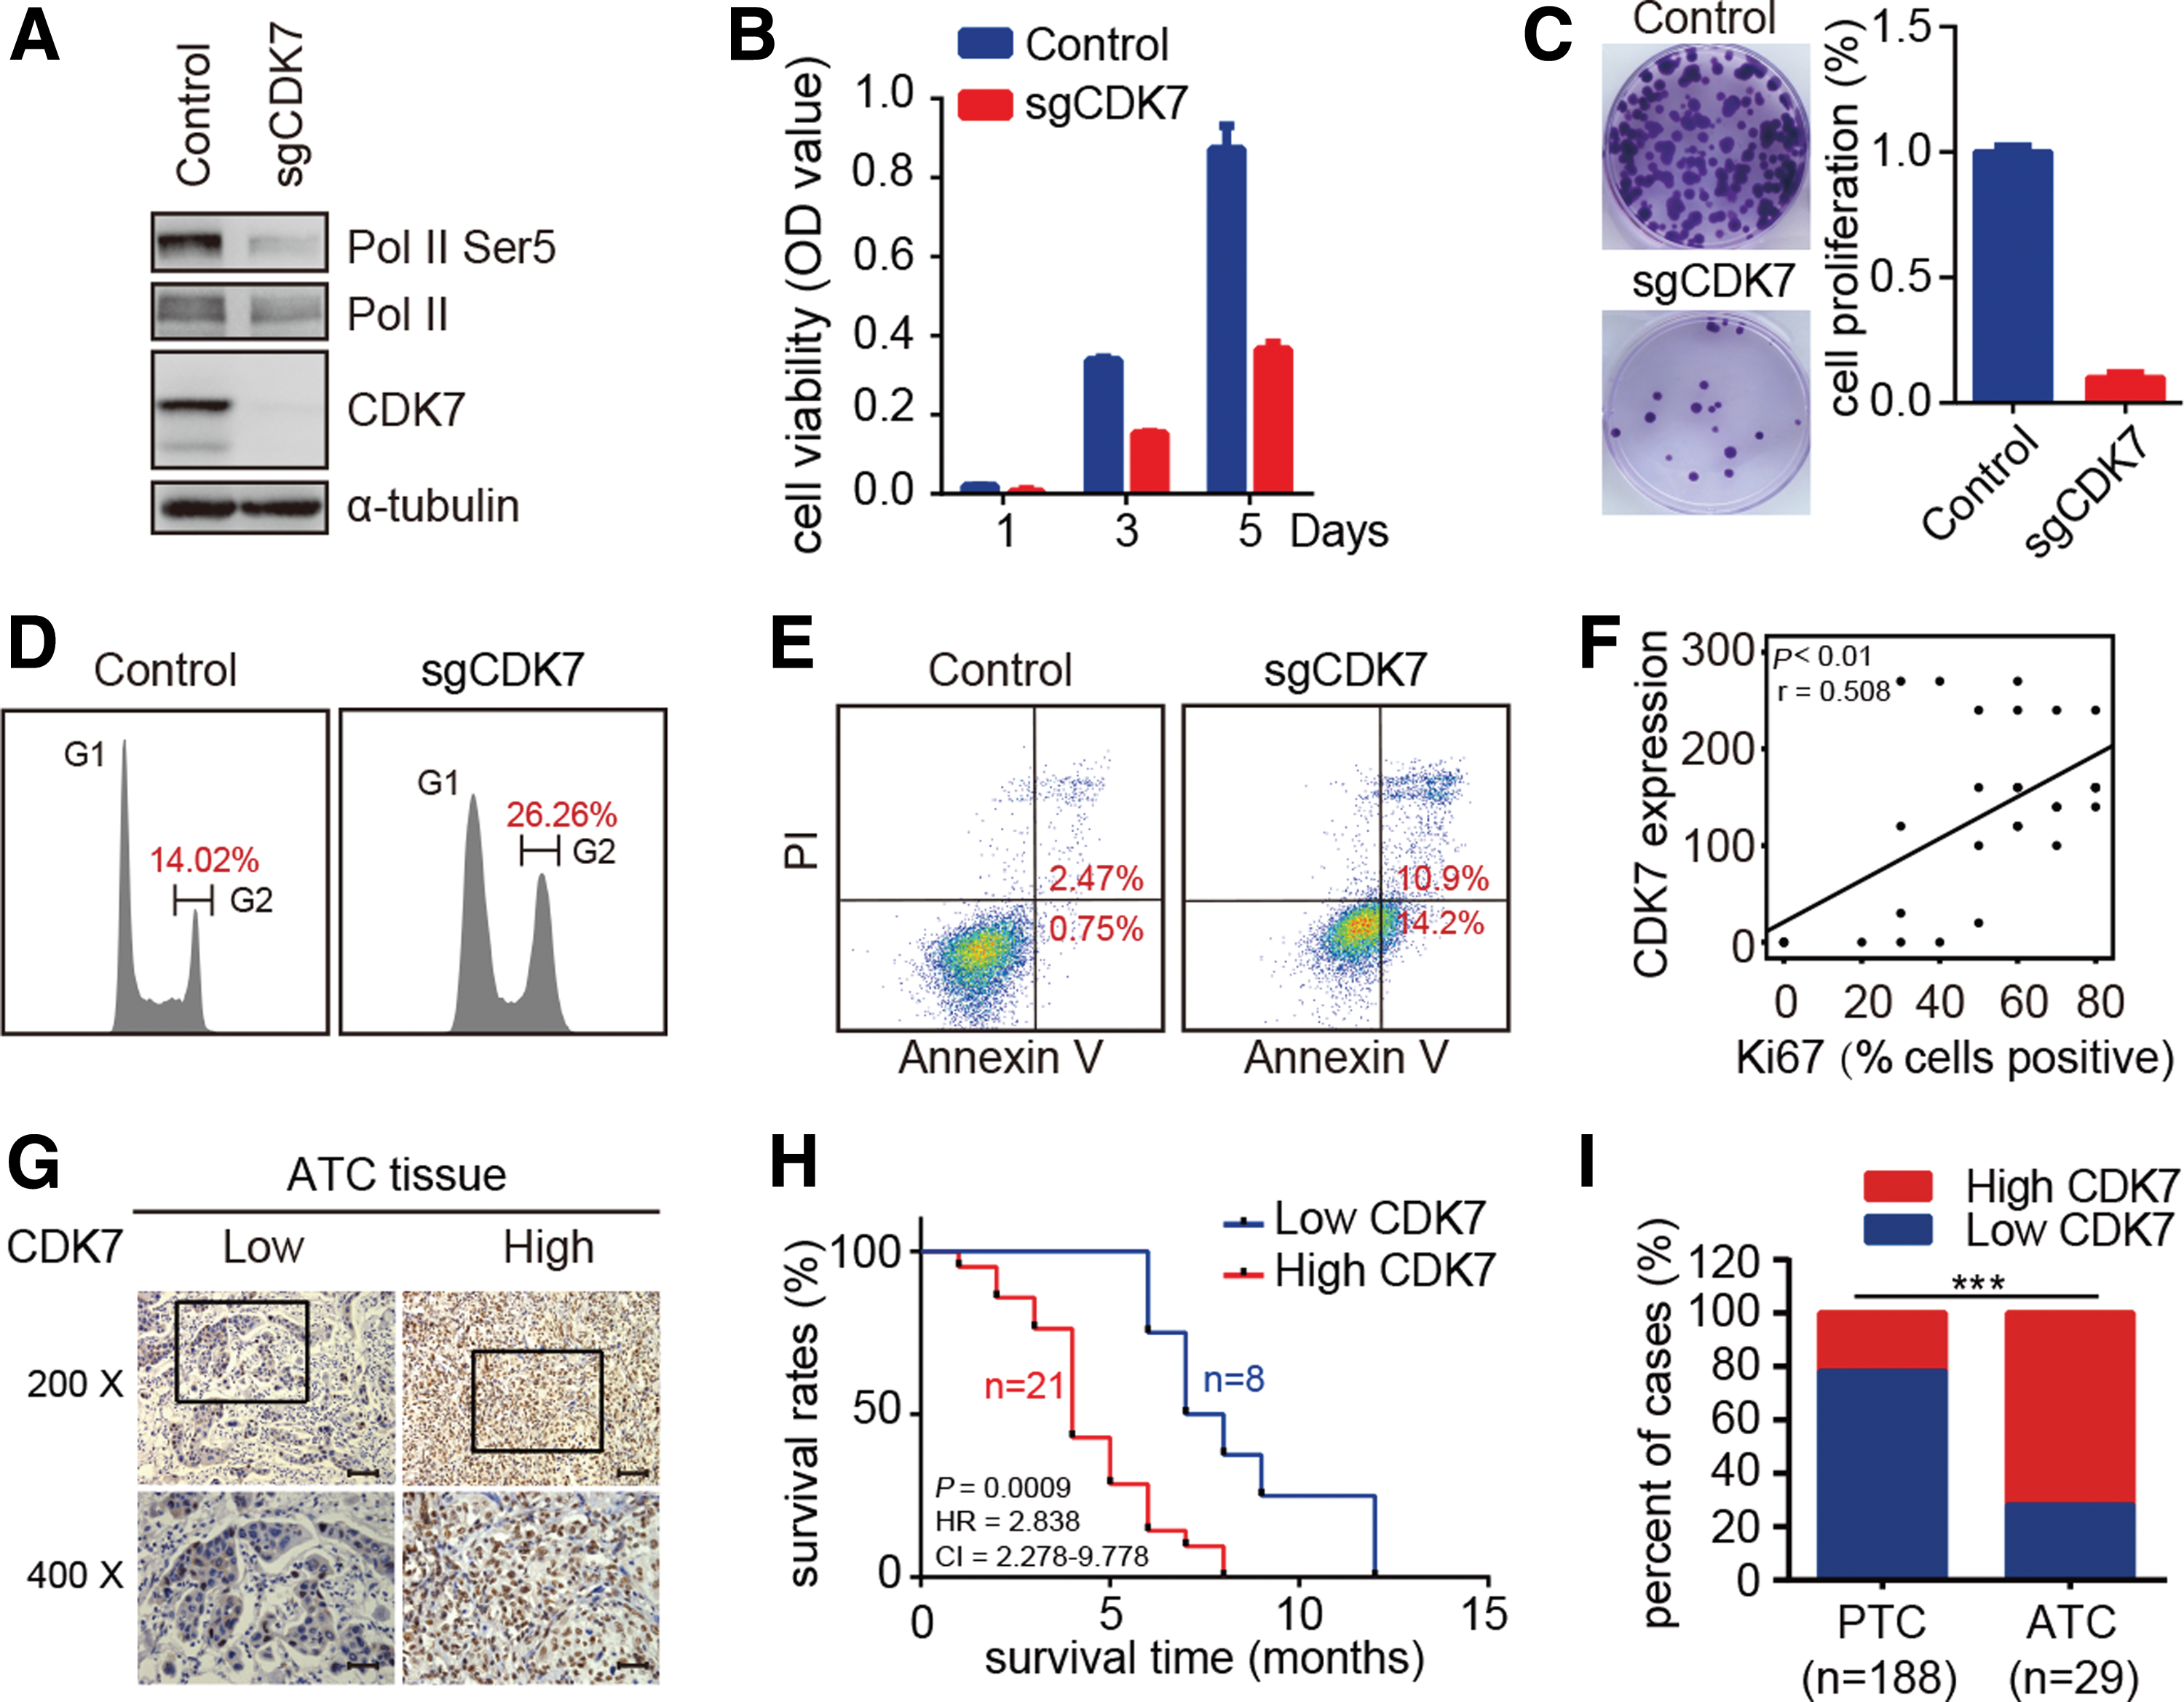
Depletion of CDK7 inhibits ATC cell growth, and elevation of CDK7 expression is correlated with poor prognosis. (
Since ATC cells are highly dependent on CDK7, next the study investigated the clinical relevance of CDK7 expression in ATC patients. First, the CDK7 and Ki67 protein expression was examined by immunohistochemical staining in tissue samples derived from ATC (a total of 29 cases). As shown in Figure 3F, CDK7 expression correlated with Ki67 staining, supporting that CDK7 may participate in the proliferation of ATC. All ATC tissues were divided into two groups: low CDK7 expression and high CDK7 expression (Fig. 3G). Both groups were subsequently assessed for associations with survival outcomes of ATC patients. A high CDK7 expression correlated significantly with a decreased survival time (Fig. 3H). CDK7 staining was further performed in 188 PTC patient samples. As shown in Figure 3I, CDK7 expression is significantly higher in ATC samples compared to PTC samples. The above data indicate that the elevated CDK7 expression could be a candidate biomarker of poor clinical prognosis in patients with ATC.
Preferential repression of transcription regulators by CDK7 inhibition in ATC cells
As a transcriptional kinase, CDK7 activates RNAPII-mediated transcription by phosphorylating the Serine 5 and Serine 7 (initiation-associated) and Serine 2 (elongation associated) of the RNAPII CTD (22,23). First, the CDK7 expression and CTD phosphorylation were examined in PTC and ATC cells. As shown in Supplementary Figure S2, the expression level of CDK7 was correlated with Serine 5 phosphorylation. Importantly, a higher expression of CDK7 and Serine 5 phosphorylation was observed in ATC cells compared to PTC cells, suggesting that ATC cells possess elevated CDK7 kinase activity. Indeed, THZ1 decreased the CTD phosphorylation at Serine 5, Serine 7, and Serine 2 in a dose-dependent manner in all four thyroid cancer cell lines (Fig. 4A). However, the phosphorylation of RNAPII CTD in ATC cells was much more sensitive to THZ1 treatment than that in PTC cells. Treatment with 100 nM THZ1 greatly reduced the CTD phosphorylation in ATC cells but not in PTC cells (Fig. 4A).
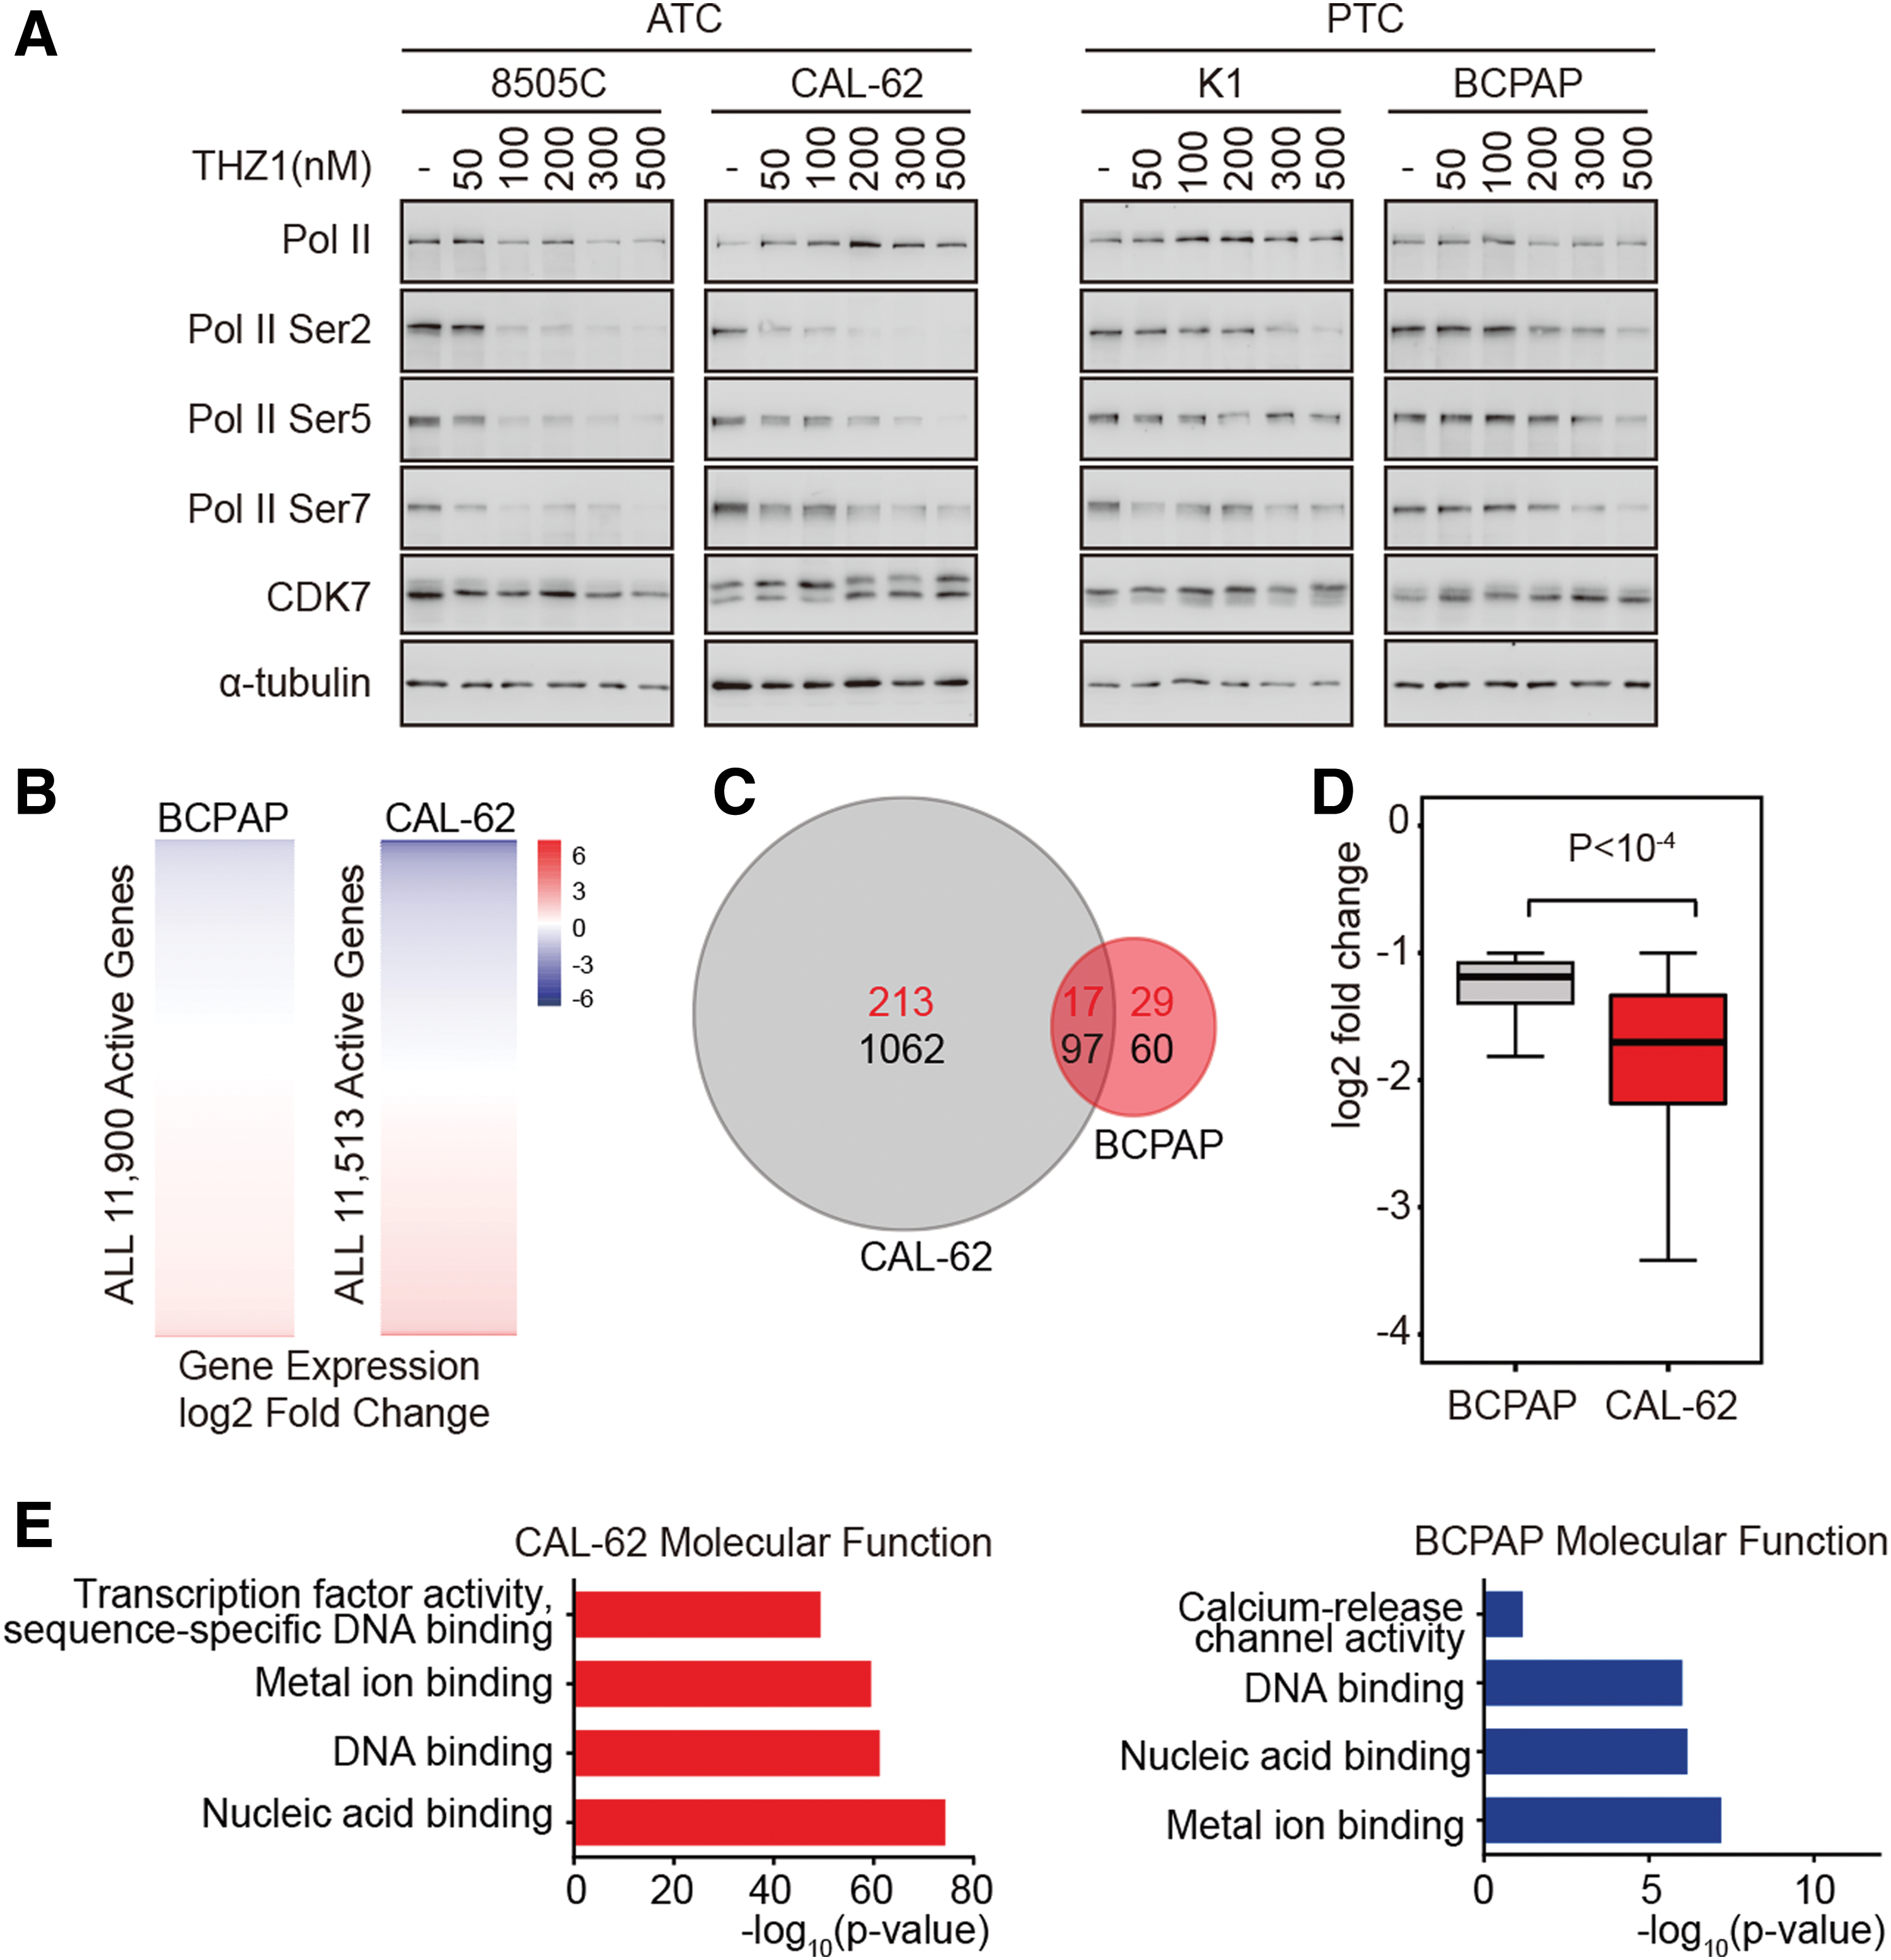
THZ1 preferentially downregulates transcription-regulating genes in ATC cells. (
Since THZ1 preferentially downregulates RNAPII CTD phosphorylation in ATC cells, it was hypothesized that THZ1 may selectively inhibit RNAPII-mediated transcriptional programs in ATC cells. To test this hypothesis, whole-transcriptome sequencing (RNA-Seq) was performed in both ATC and PTC cells. The genome-wide gene expression analyses revealed that low-dose THZ1 had a much stronger impact on the transcriptional program of representative ATC cells than PTC cells (Fig. 4B and C and Supplementary Table S5). In ATC cells, 1159 genes were found to be sensitive to THZ1 treatment (repressed more than twofold), including some well-studied cancer genes, such as XBP1 (24), TSPYL5 (25), SPC24 (26), FOSL1 (27), MCL1 (28,29), and NEAT1 (30). However, THZ1 treatment only caused the suppression of 157 genes in PTC cells. Moreover, the THZ1-sensitive genes in ATC cells were repressed at a higher degree by THZ1 treatment than in PTC cells (Fig. 4D). A small group of genes (230 in ATC cells and 46 in PTC cells) were found to be upregulated by THZ1 treatment (Fig. 4C), which was due to either negative feedback or treatment-induced stress response.
Further analysis of the gene expression profiles of ATC cells showed that THZ1 repressed gene expression in a gene-selective fashion. GO analysis revealed that THZ1-sensitive transcripts were significantly enriched for genes encoding transcription factors and other nuclear proteins (DNA binding and nucleic acid binding) in ATC cells (Fig. 4E). The THZ1-sensitive genes in PTC cells were also enriched for factors with DNA and nucleic acid binding activities, but to a much lesser extent compared to those in ATC cells (Fig. 4E). These data demonstrate that THZ1 treatment preferentially targets transcription-regulating genes, and the dysregulated transcriptional programs may confer the observed sensitivity of ATC cells to CDK7 inhibition.
SEs promote the transcriptional dysregulation in ATC
Then, the study proceeded to investigate the molecular mechanisms underlying the hyper-activation of transcriptional regulators in ATC cells. Recently, it has been demonstrated that cell identity–determining genes and key oncogenic transcription regulators are frequently associated with SEs (16,31). Thus, it was wondered whether SEs promote the hyper-activation of transcriptional regulators in ATC cells. To test this, first, the SE landscape of ATC and PTC cells was characterized by ChIP-Seq analysis of H3K27ac modification, a mark of an active enhancer. A set of enhancers, loaded with significantly higher level of H3K27ac than typical enhancers (TEs), were classified as SEs. A total of 606 SE-associated genes were identified in CAL-62 cells (Fig. 5A). Among them, PAX8 is a thyroid-specific transcription factor, which is an excellent marker for carcinomas of follicular epithelial origin, including ATC (32). Several SE-associated genes with established roles in promoting ATC progression were also identified, such as EGFR (33,34) and SPC24 (26). The GO analysis of SE-associated genes showed that they were significantly enriched for genes involved in cell–cell adhesion and transcription regulation (Fig. 5B). Notably, the list of SE-associated transcription regulators contains many transcription factors with well-known oncogenic roles in other cancers, such as BMI1 (35), ETS1 (36), FOSB (37), MTA2 (38), and SMAD3 (39) (Supplementary Table S6).
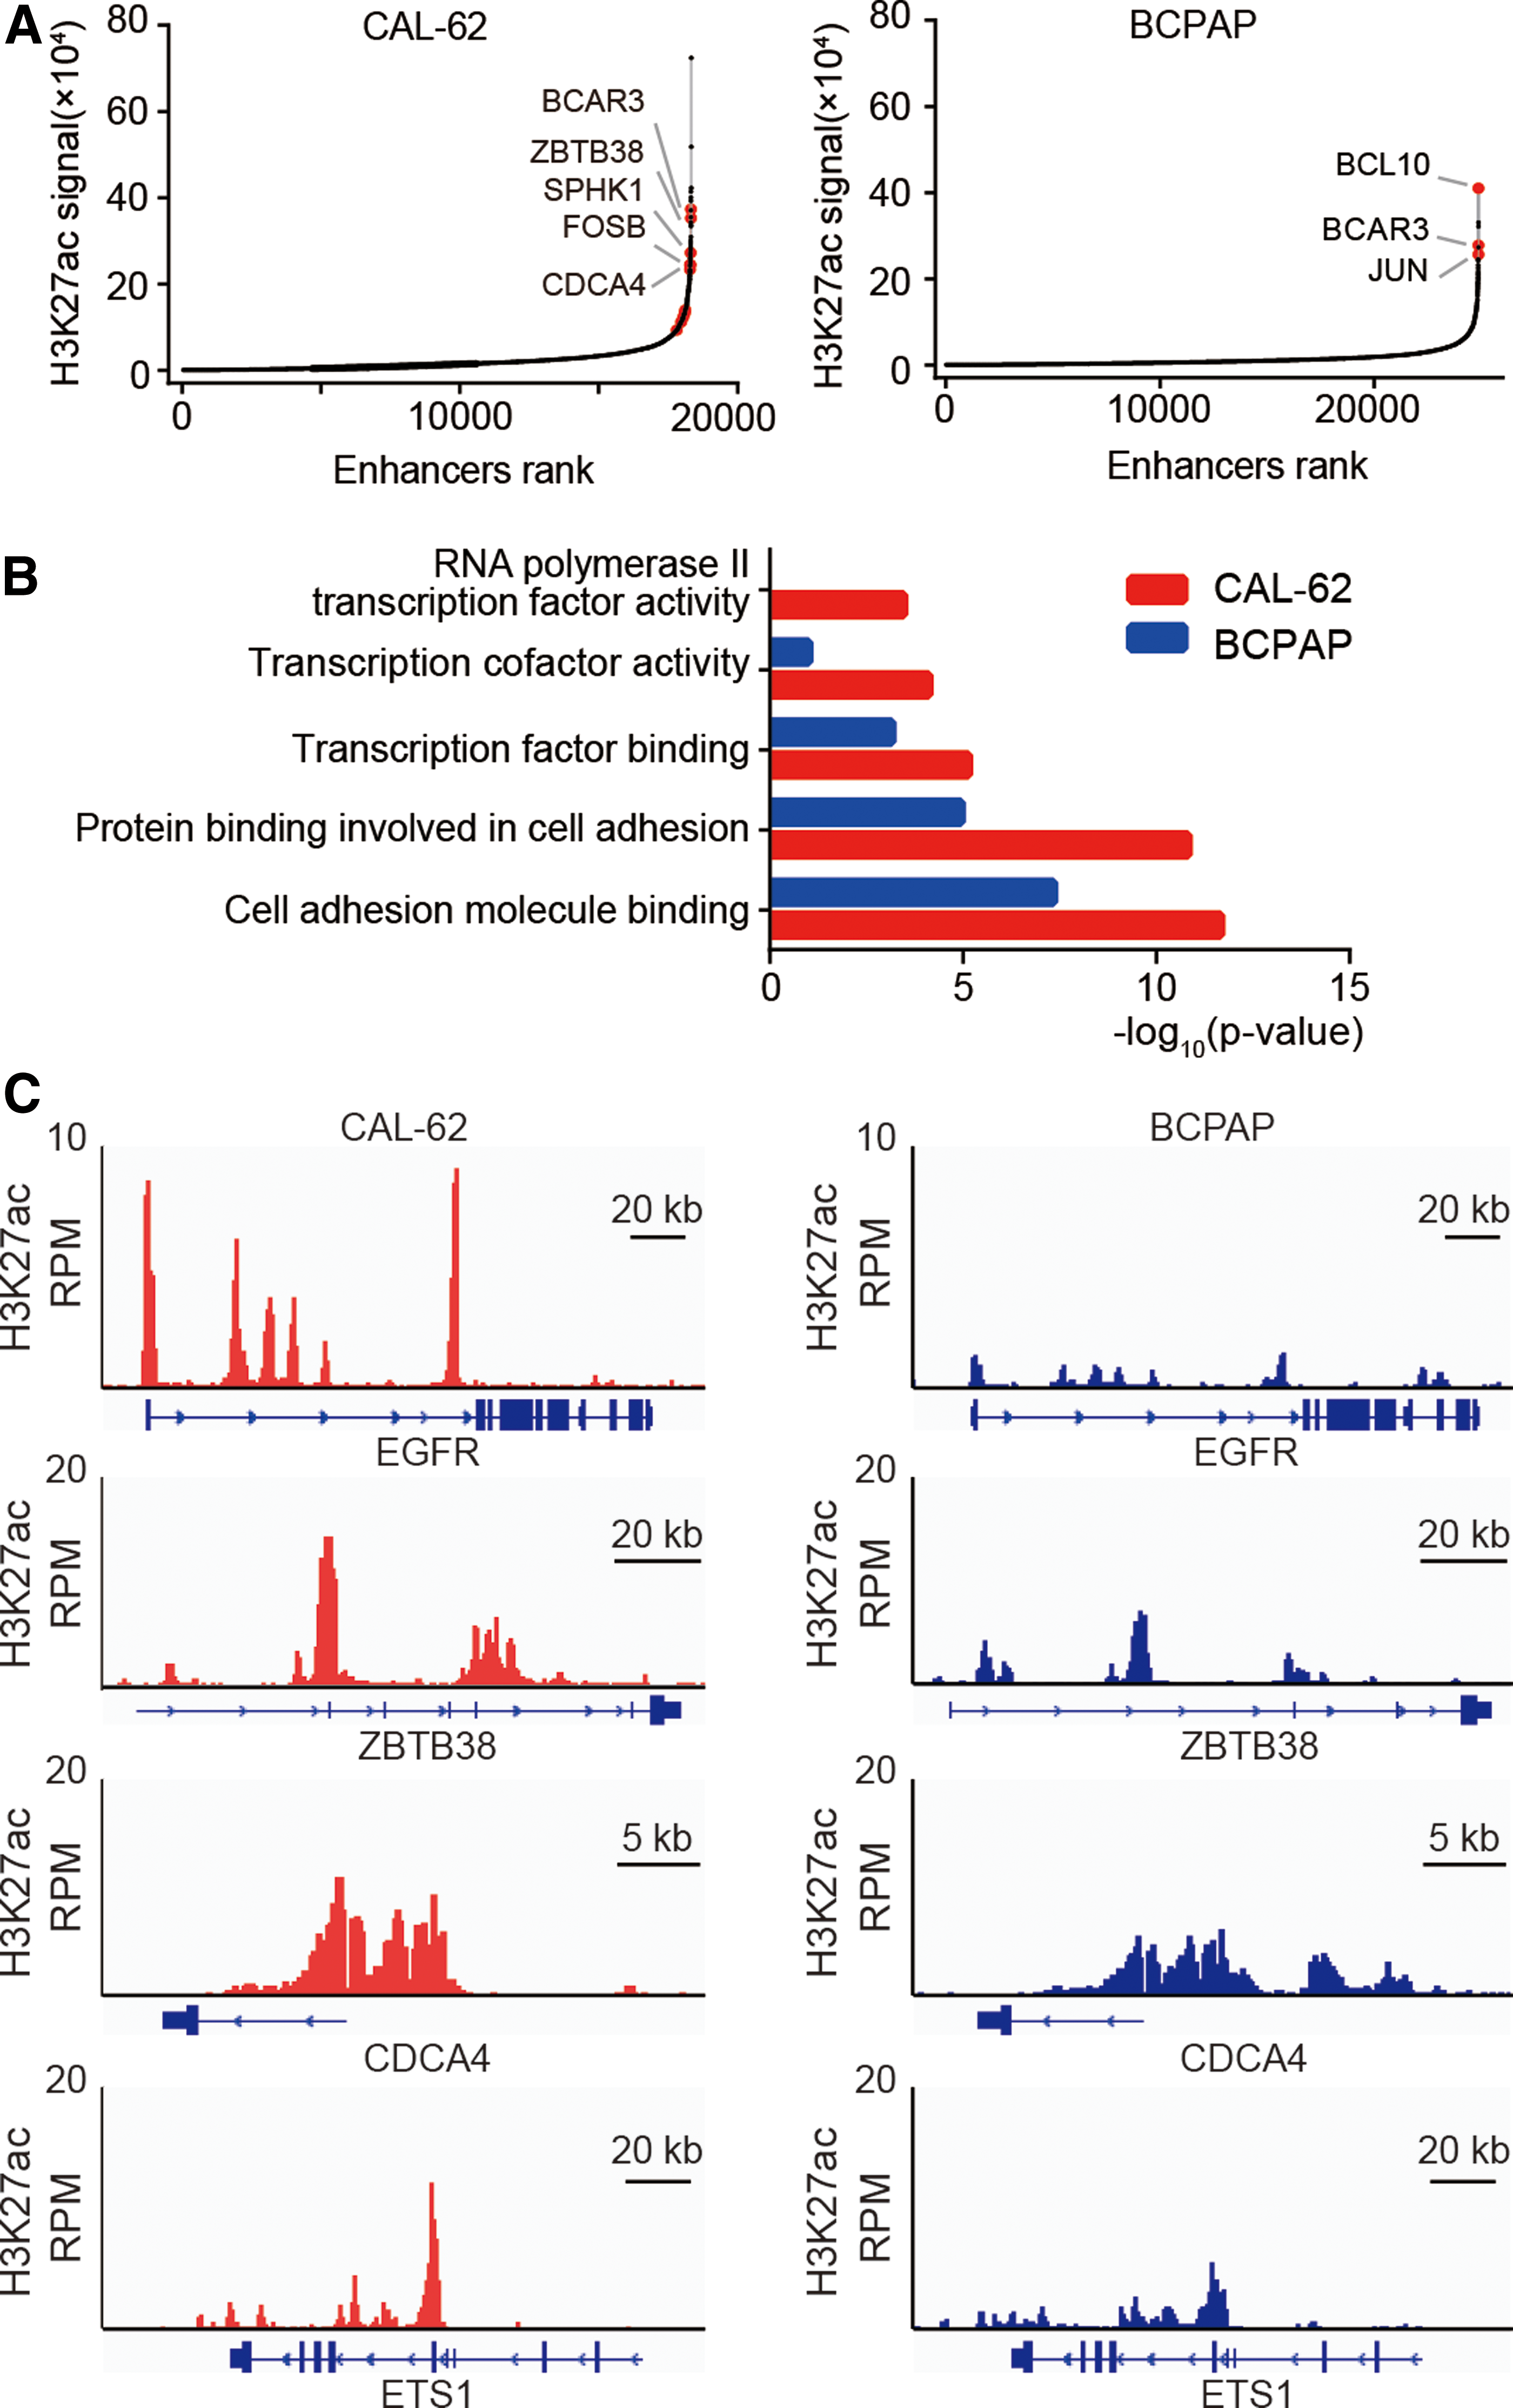
Characterization of super enhancer landscapes in CAL-62 and BCPAP cells. (
A total of 732 SE-associated genes were identified in BCPAP cells (Fig. 5A). Unlike in ATC, the SE-associated genes in PTC were not significantly enriched for genes involved in transcriptional regulation. Interestingly, they were significantly enriched for genes involved in cell–cell adhesion, which were also seen in ATC cells, indicating that cell adhesion pathways might play key roles in maintaining the cancer state of both ATC and PTC (Fig. 5B). Many SEs were either uniquely identified in ATC cells or loaded with stronger H3K27ac signals in ATC cells than in PTC cells. Four representative samples of these ATC-specific SEs are shown in Figure 5C. Taken together, these results suggest that SEs may play critical roles in activating the transcriptional regulators of ATC cells, thereby promoting the transcriptional dysregulation in ATC.
Identification of SE-associated cancer genes in ATC
To investigate the biological features of SE-associated genes further, GSEA was performed. It was observed that only SE-associated genes in ATC were significantly enriched for THZ1-sensitive transcripts (Fig. 6A). Furthermore, these SE-associated genes were repressed to a greater extent by THZ1 than genes associated with TEs (Fig. 6B).
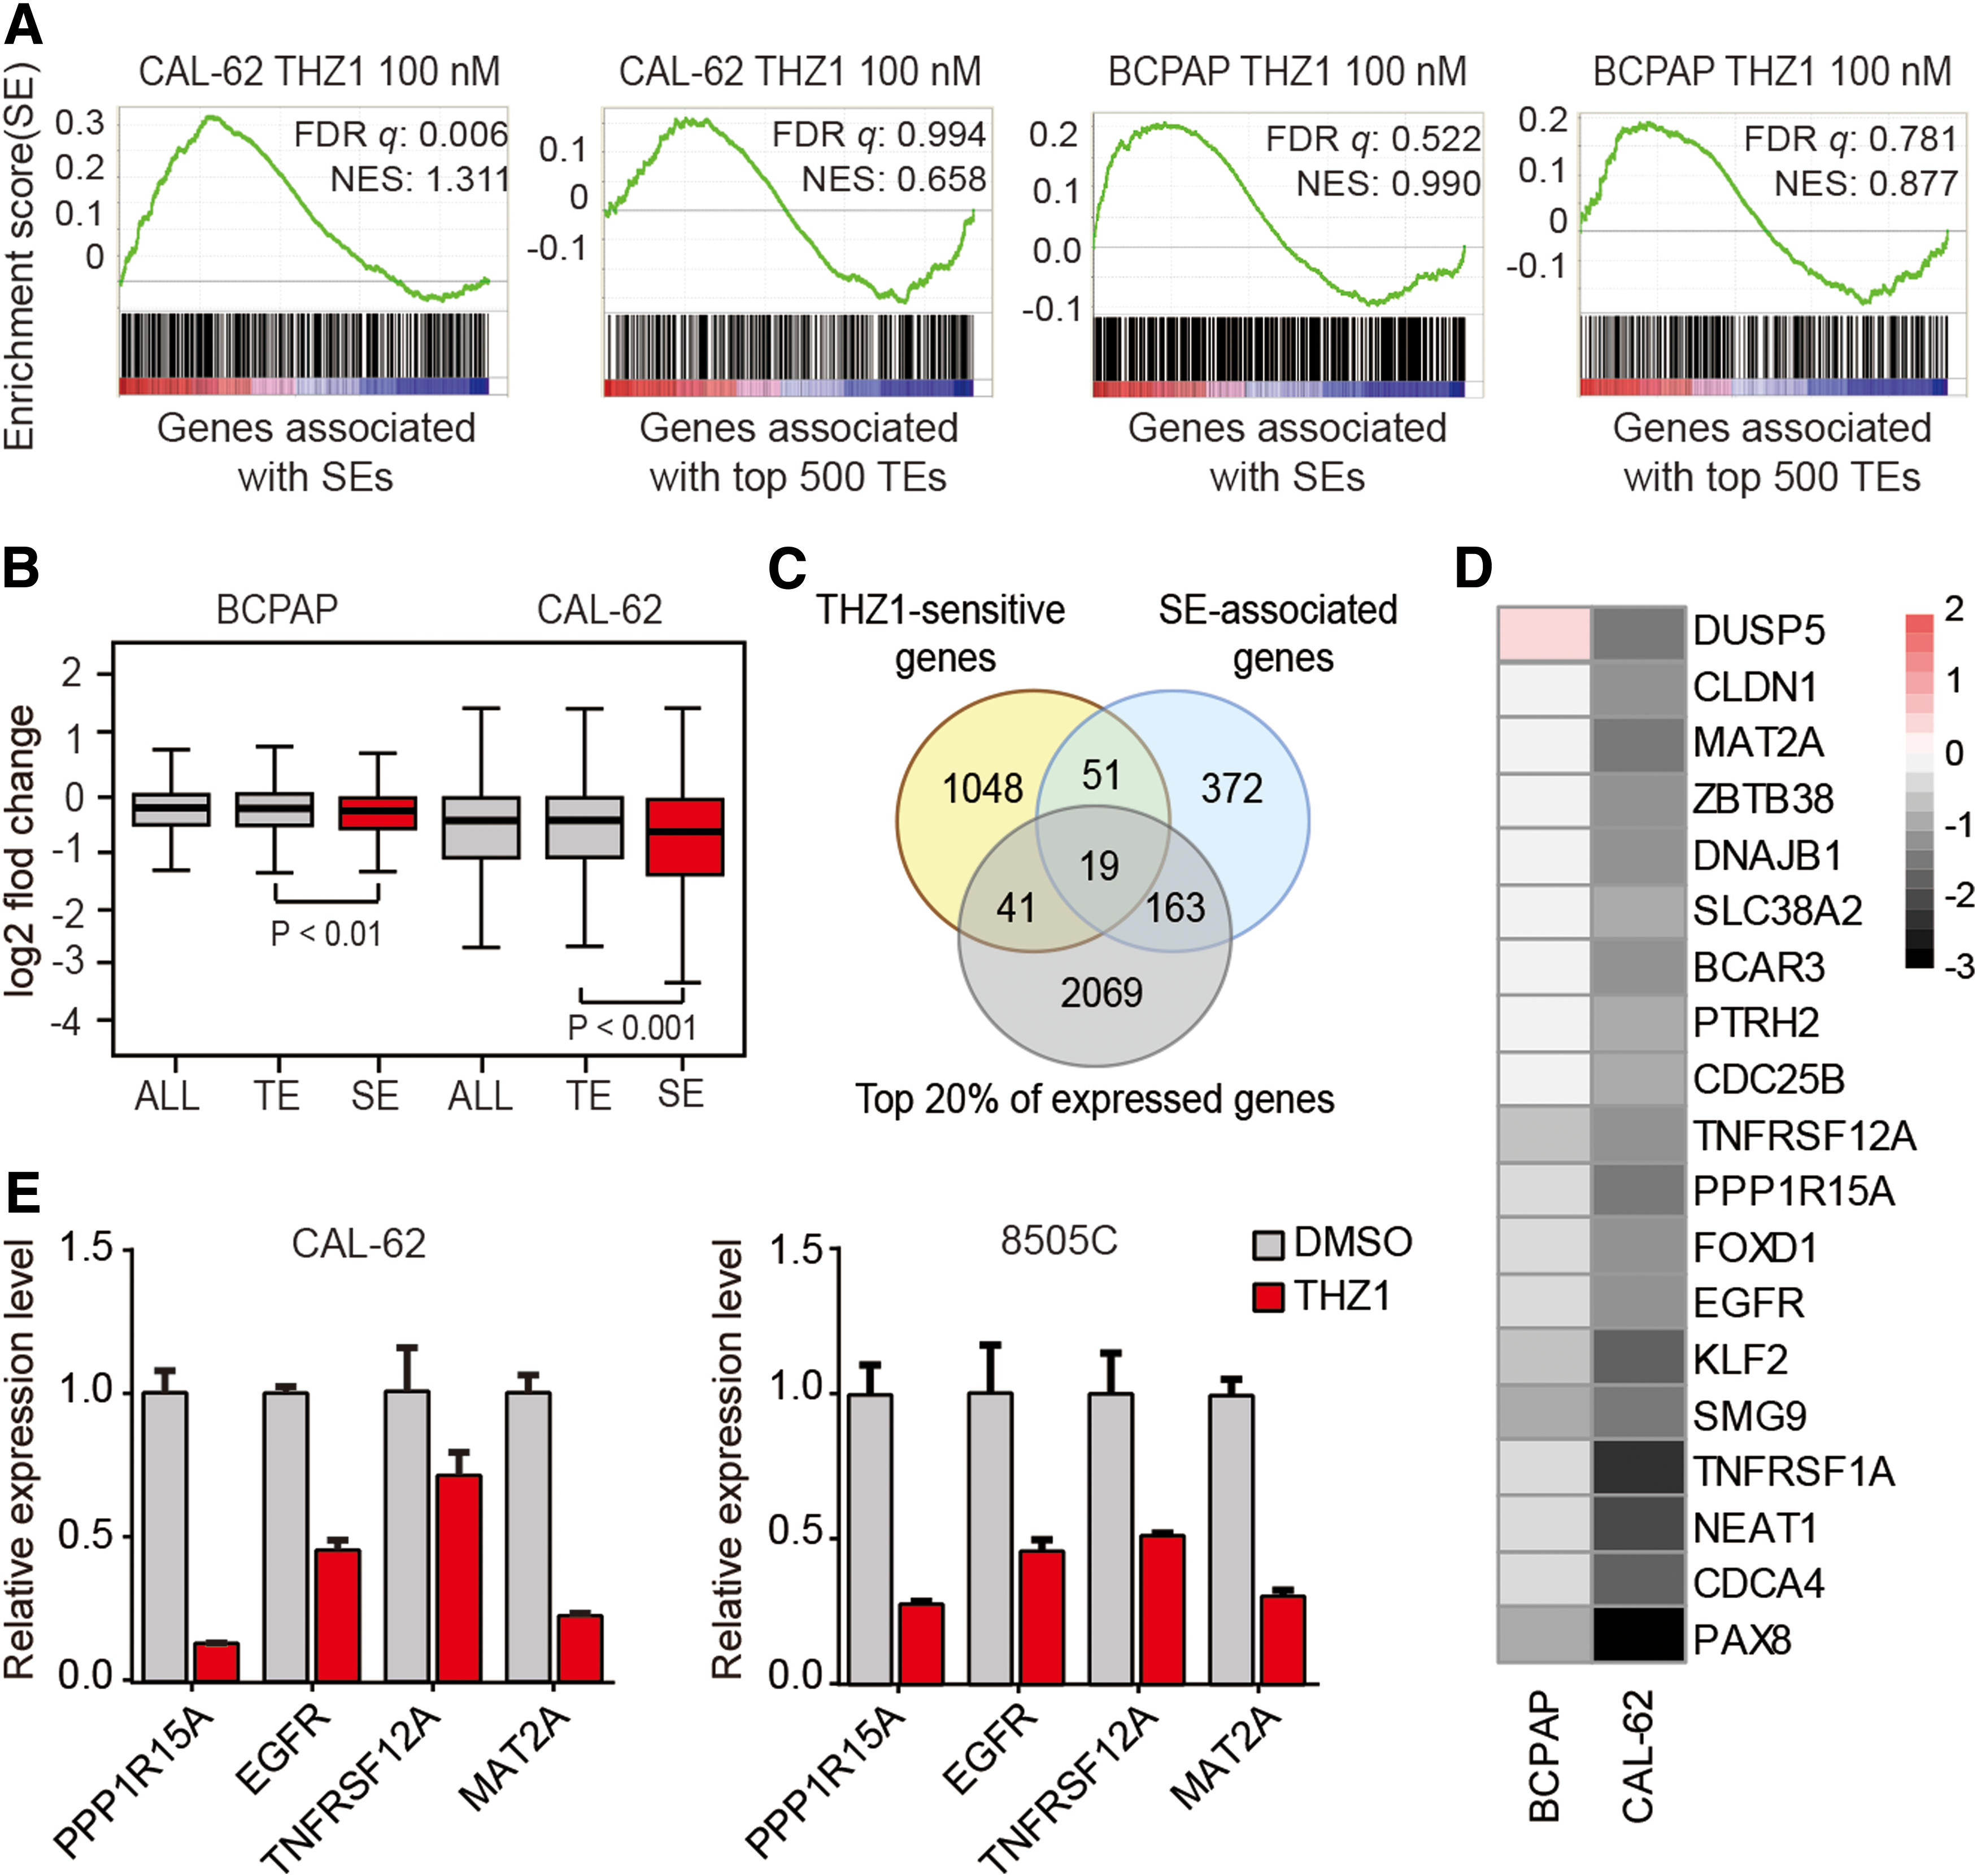
Discovery of SE-associated cancer genes in ATC. (
Several studies have demonstrated that many cancer genes are commonly associated with SEs (31,40). The SE-associated oncogenes often exhibit high expression and are highly sensitive to THZ1 treatment (7 –10). To identify the critical cancer genes in ATC, an integrative analysis of the transcriptome data and the SE profiling data obtained from ATC cells was performed. The candidate cancer genes were selected using the following criteria: (i) associated with SEs, (ii) highly sensitive to low-dose THZ1, and (iii) expression levels within the top 20% of all active transcripts. As a result, 19 candidate genes were identified (Fig. 6C). Among them were several known oncogenes, such as PAX8 (41,42), EGFR (43), and NEAT1 (30). Further analysis of RNA-Seq data revealed that THZ1 selectively repressed these genes in ATC cells but not in PTC cells (Fig. 6D). The reduction of four representative genes was confirmed by quantitative polymerase chain reaction analysis (Fig. 6E). Among these candidate cancer genes, EGFR has been reported to be important for ATC initiation and development (34,44).This supports the effectiveness of this approach to predict critical cancer genes.
PPP1R15A functions as a novel druggable target in ATC
To test the biological functions of these candidate genes in ATC cells, all 19 genes were silenced using CRISPR/Cas9-mediated gene editing, and ATC cell viability was assessed after gene depletion. All the mutations were validated by DNA sequencing (Supplementary Fig. S3), and the knockdown efficiency was further confirmed by Western blotting for EGFR, PAX8, MAT2A, FOXD1, and PPP1R15A (Supplementary Fig. S4A). Depletion of 12/19 candidates significantly impaired the colony formation ability of ATC cells (Fig. 7A). Silencing of PPP1R15A caused the greatest reduction of colony formation in ATC cells. PPP1R15A binds to protein phosphatase 1 (PP1), and together with PP1 forms the holo-phosphatase of eIF2α. Guanabenz (GBZ), a Food and Drug Administration (FDA)-approved drug for hypertension, selectively inhibits PPP1R15A by disrupting the interaction between PPP1R15A and PP1, and thereby prolongs the phosphorylation of eIF2α (45). Then, the anti-ATC effect of GBZ was tested. As shown in Figure 7B and Supplementary Figure S4B, GBZ inhibited cell growth in two ATC cell lines. The effect of PPP1R15A inhibition on ATC cell growth was further confirmed by Sephin1 (45), a newly developed PPP1R15A inhibitor (Fig. 7B and Supplementary Fig. S4B).
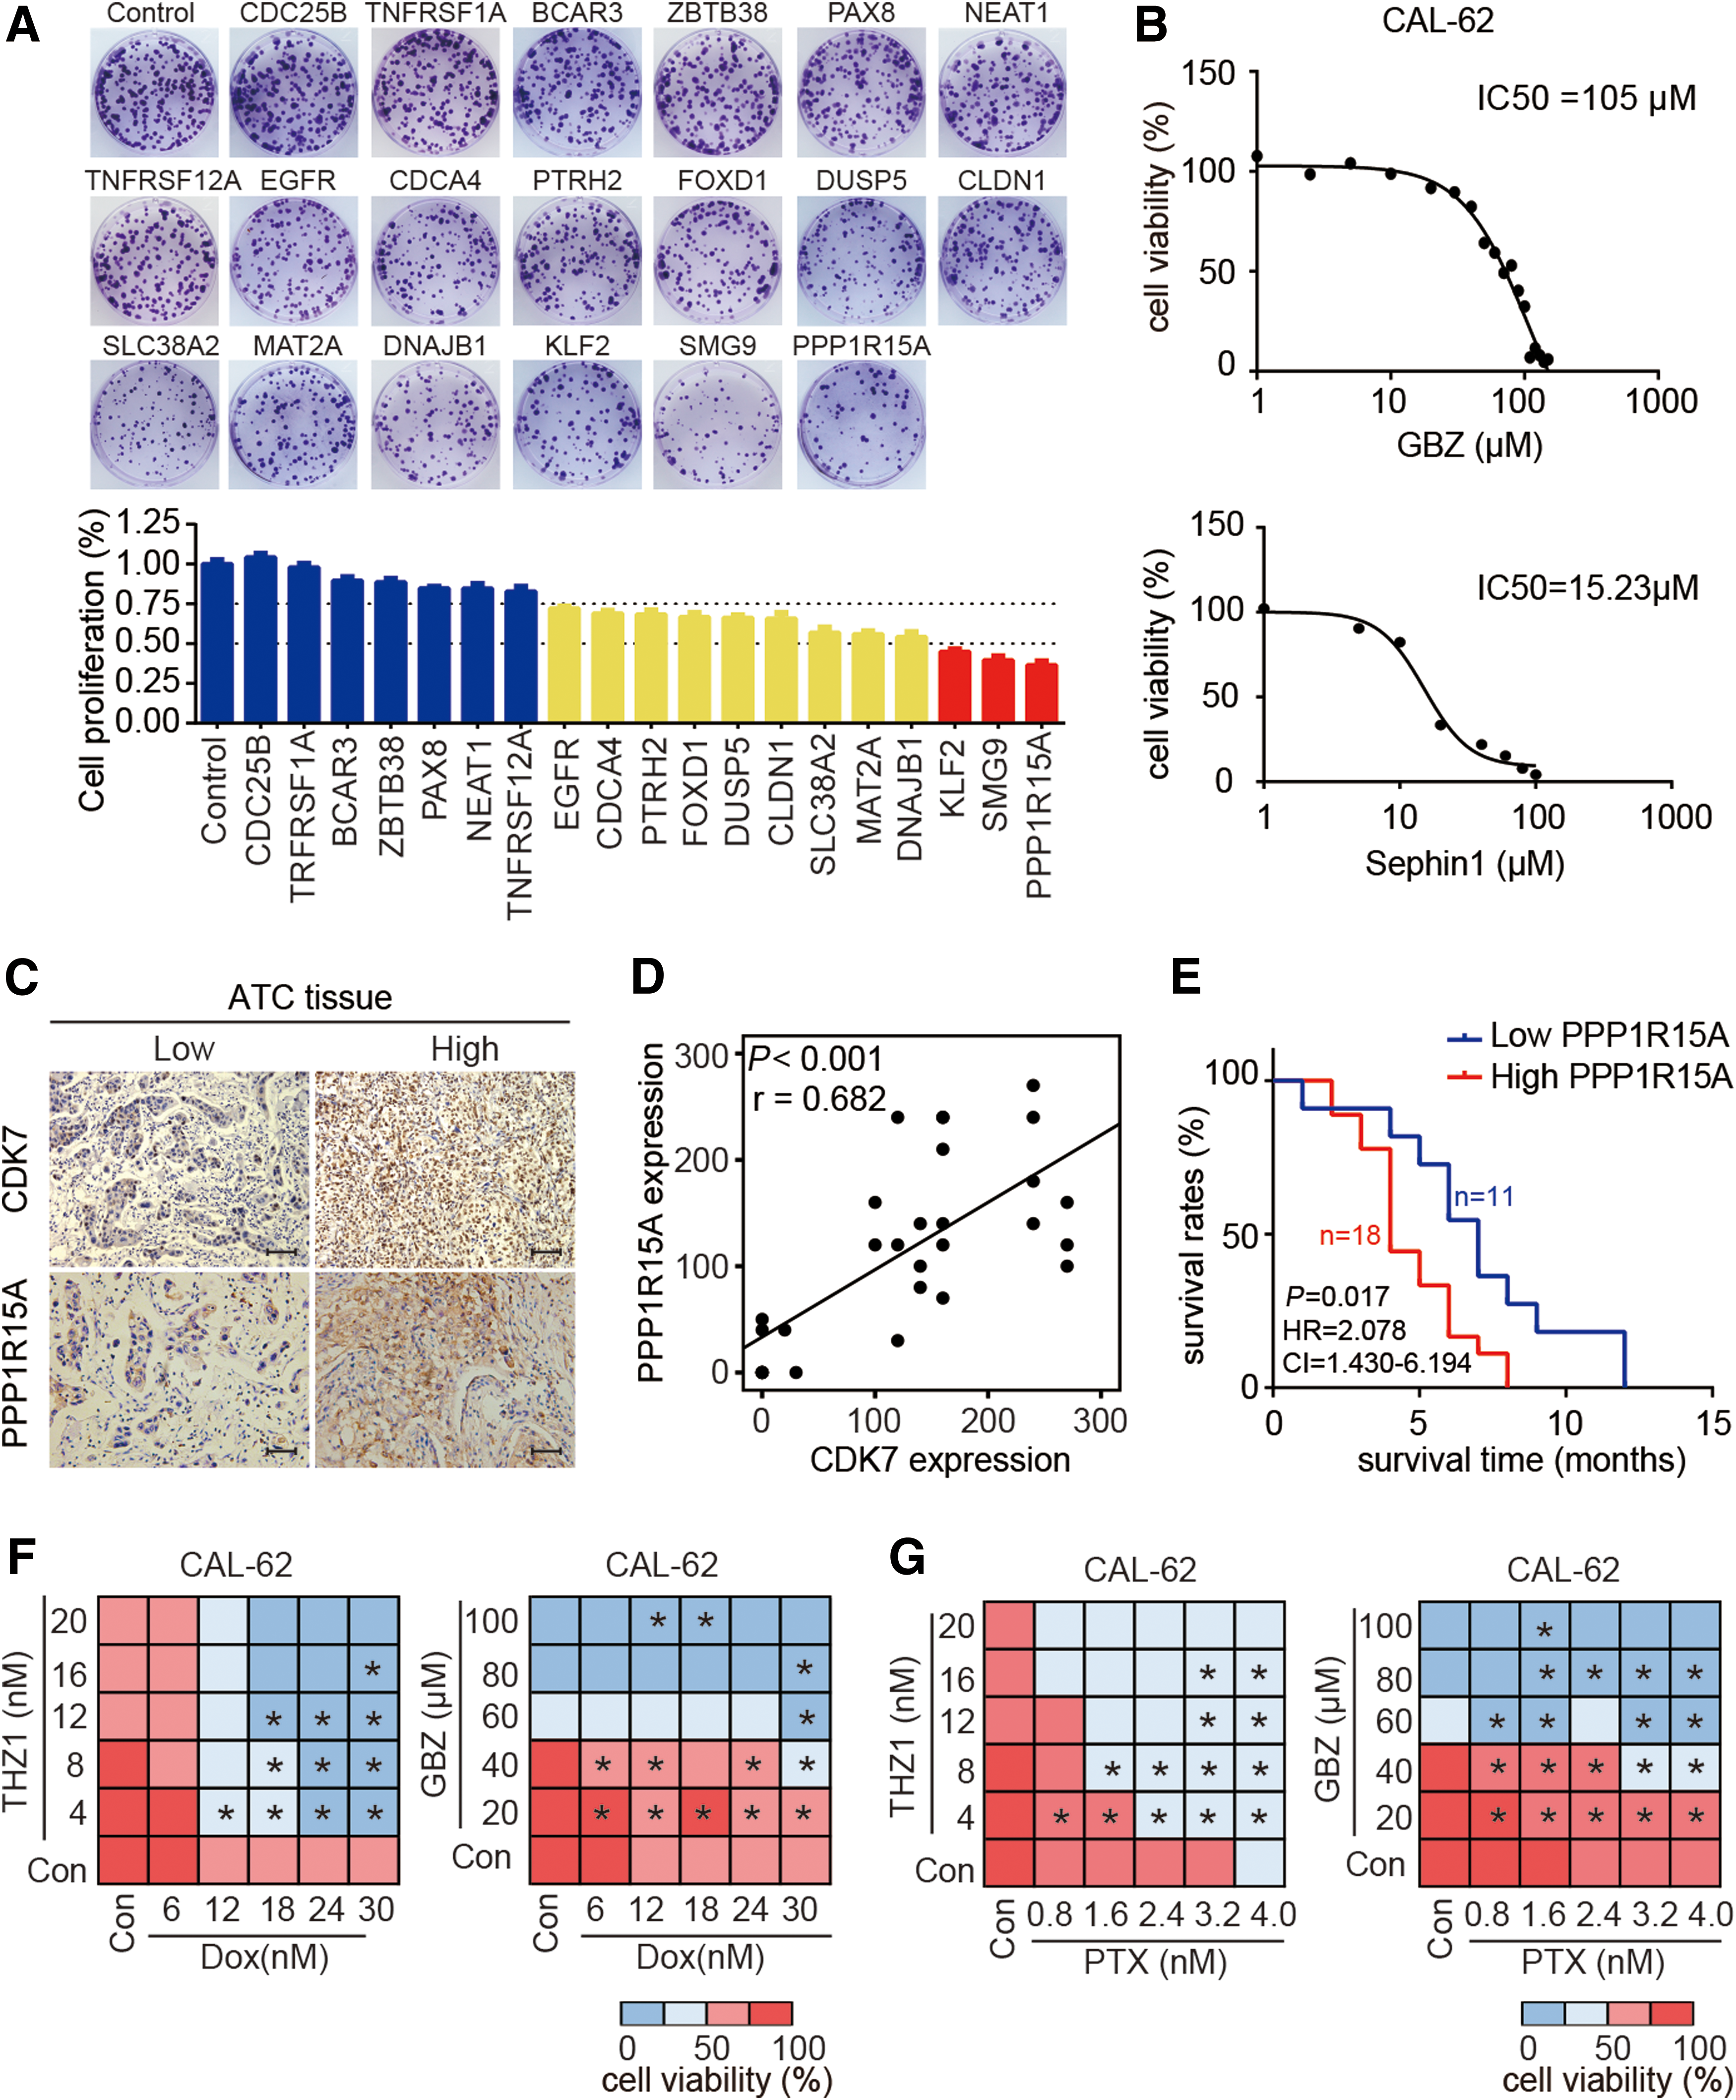
Identification of PPP1R15A as a novel druggable target and rational drug combination treatments for ATC. (
To investigate the clinical relevance of PPP1R15A in ATC, the protein expression of PPP1R15A was analyzed in ATC tissue samples. It was observed that the expression level of PPP1R15A correlated significantly with CDK7 expression (Fig. 7C and D). Similar to CDK7, a high PPP1R15A expression was significantly associated with decreased survival time of patients with ATC (Fig. 7E). Taken together, these results indicate that PPP1R15A is a critical cancer gene involved in ATC pathogenesis, and may serve as a candidate drug target for ATC treatment.
CDK7 or PPP1R15A inhibition sensitizes the ATC cells to conventional chemotherapy
Doxorubicin (DOX) is the only cytotoxic agent that is approved by the FDA as single-drug chemotherapy for ATC treatment (46). Unfortunately, the response rate is <22%, and a high dose of DOX can cause severe side effects (47). Thus, searching for better therapeutic combinations to improve DOX effects has been an urgent need. Since THZ1, GBZ, and Sephin1 effectively inhibited ATC cell growth, it was wondered if these chemicals could improve the poor outcomes of conventional chemotherapies for ATC. To test this, the efficacy of combination treatment of DOX with these drugs was evaluated. THZ1 significantly enhanced the anti-ATC effect of DOX (Fig. 7F). Similarly, combining DOX with GBZ or Sephin1 showed synergistic anti-ATC effects (Fig. 7F and Supplementary Fig. S4C and D). Furthermore, the efficacy of a combination treatment of paclitaxel (PTX) with THZ1 or GBZ was evaluated. THZ1 or GBZ significantly enhanced the anti-ATC effects of PTX (Fig. 7G), suggesting the synergistic effects are not limited to genotoxic agents. Altogether, these results indicate that inhibition of CDK7 or PPP1R15A strongly enhances the potency of conventional chemotherapy in ATC cells.
Discussion
ATC is the most aggressive subtype of thyroid cancer and lacks effective treatments. Recent large-scale genome analysis established the mutational landscape of ATC, which is characterized by a greater mutational burden and intertumoral heterogeneity compared to other types of thyroid cancer (17 –19). The high genetic complexity and scarce actionable driver mutations have greatly limited the development of effective targeted therapies. The present study addresses this high therapeutic need. It is demonstrated that targeting the transcriptional dysregulation, instead of specific genomic mutations, might be an effective alternative approach against ATC. The study found that ATC cells are exceptionally sensitive to THZ1. Functional studies validate the high dependency of ATC cells on CDK7. Mechanistic analyses revealed that SE-driven hyper-activation of transcriptional regulators confer the exceptional sensitivity of ATC cells to CDK7 inhibition. The underlying mechanisms may include: (i) the SE-driven hyper-activation of transcriptional regulators promotes continuously active transcription in ATC cells, thereby supporting the high expression of cancer genes; (ii) the adaptation of ATC cells to this highly active transcription makes them more vulnerable to transcriptional perturbation elicited by CDK7 inhibition than other types of thyroid cancer.
Prior studies have demonstrated that some transcription-targeting drugs exhibited anti-ATC activity by inhibiting transcriptional cofactors, such as HDACs and BRD4 (20,21,48 –51). However, these drugs showed much lower potency than THZ1 in our chemical screen. By inhibition of CDK7, THZ1 directly targets RNAPII transcription machinery. Thus, THZ1 treatment represses the cancer genes addicted to continuously active transcription more effectively and confer higher sensitivity than other agents.
The knowledge about critical cancer genes involved in ATC pathogenesis is limited. This study identified 14 candidate cancer genes by integrative analysis of transcriptome data, SE profiling data, and functional assays. One of the candidates, EGFR, had been reported to play critical roles in ATC progression (33,34). Unfortunately, an oral EGFR kinase inhibitor, Gefitinib, showed poor efficacy in an ATC clinical trial (52). The reason for this discrepancy may be explained by the existence of kinase-independent roles of EGFR in ATC pathogenesis. Furthermore, integrative analysis also identified another actionable candidate cancer gene, PPP1R15A.
Depletion of PPP1R15A shows the strongest reduction in ATC cell viability among all the candidate cancer genes. Inhibition of PPP1R15A by GBZ causes a profound decrease in ATC cell proliferation. Further investigations of THZ1 and GBZ in clinical studies are needed. At present, despite the poor response rate, DOX-mediated chemotherapy is still the first-class treatment for patients with ATC (1,47,53). The present data suggest potential roles for THZ1 and GBZ in modulating the sensitivity of ATC cells to DOX treatment. This may provide new therapeutic strategies for the fraction of ATC patients with poor response to conventional chemotherapies.
Due to the complex and heterogeneous genetic changes, limited success has been achieved regarding biomarker identification in ATC. This study demonstrates that the high expression of CDK7 and PPP1R15A correlate with poor prognosis of patients with ATC. Thus, this work not only identifies CDK7 and PPP1R15A as promising therapeutic targets, but also highlights their value as potential prognostic biomarkers in ATC.
In summary, the current study demonstrates that targeting transcriptional addiction by CDK7 inhibition is a promising therapeutic strategy for ATC. Moreover, by characterizing the transcriptional profile and SE landscape of ATC, this work provides significant insights into the molecular pathogenesis of ATC.
Footnotes
Acknowledgments
This work was supported by grants (81872169 to X.Z., 81472580 to M.G., 31571336 to L.Z., and 81770658, and 31571337 to Y.C.) from the National Natural Science Foundation of China, and grants (17YFZCSY00690 to M.G., 15JCYBJC54100 to L.Z., and 15JCYBJC54000 to Y.C.) from Tianjin Municipal Science and Technology Commission.
Author Disclosure Statement
No competing financial interests exist.
Supplementary Material
Supplementary Data S1
Supplementary Figure S1
Supplementary Figure S2
Supplementary Figure S3
Supplementary Figure S4
Supplementary Table S1
Supplementary Table S2
Supplementary Table S3
Supplementary Table S4
Supplementary Table S5
Supplementary Table S6