
Abstract
Background:
Radioactive iodine (RAI) therapy is an important strategy in the treatment of thyroid cancer. However, anaplastic thyroid cancer (ATC), a rare malignancy, exhibits severe dedifferentiation characteristics along with a lack of sodium iodide symporter (NIS) expression and function. Therefore, RAI therapy is ineffective and contributes toward poor prognosis of these patients. Recently, small-molecule tyrosine kinase inhibitors (TKIs) have been used to treat thyroid cancer patients for restoring NIS expression and function and RAI uptake capacity. However, most results reported thus far are associated with differentiated thyroid cancer. In this study, we identified a new TKI and investigated its effects on cell redifferentiation, NIS function, and RAI therapy in ATC.
Methods:
We identified a new TKI, “5-(5-{4H, 5H,6H-cyclopenta[b]thiophen-2-yl}-1,3,4-oxadiazol-2-yl)-1-methyl-1,2-dihydropyridin-2-one” (CTOM-DHP), using a high-throughput screening system. CTOM-DHP was exposed to 8505C ATC cells at different concentrations and time points. Concentrations of 12.5 and 25 μM and an incubation time of 72 hours were chosen as the conditions for subsequent NIS promoter assays and NIS mRNA and protein expression experiments. In addition, we examined factors related to iodide metabolism after CTOM-DHP treatment as well as the signaling pathways mediating the effects of CTOM-DHP on endogenous NIS expression. RAI uptake and 131I cytotoxicity effects caused by CTOM-DHP pretreatment were also evaluated in vitro and in vivo.
Results:
Promoter assays as well as mRNA and protein expression analyses confirmed that NIS expression was augmented by treatment of 8505C ATC cells with CTOM-DHP. Moreover, CTOM-DHP treatment robustly increased the expression of other thyroid-specific proteins and thyroid transcription factors related to iodide metabolism. Enhancement of NIS function was demonstrated by an increase in 125I uptake and 131I cytotoxicity. Increased endogenous NIS expression was associated with the inhibition of PI3K/Akt and MAPK signaling pathways. In vivo results also demonstrated an increase in NIS promoter activity and RAI avidity in response to CTOM-DHP treatment. Furthermore, 131I-mediated therapeutic effects preferentially improved in a tumor xenograft mice model.
Conclusions:
CTOM-DHP, a new TKI identified in this study, enhances endogenous NIS expression and thereby is a promising compound for restoring RAI avidity in ATC.
Introduction
To date, thyroidectomy, followed by radioactive iodine (RAI) therapy, and, if needed, therapy with kinase inhibitors have been the commonly adopted strategies for increasing the survival rate of thyroid cancer patients (1). Anaplastic thyroid cancer (ATC) is a dedifferentiated cancer that is commonly accompanied by the destruction of adjacent structures and distant metastases (2). Although among all types of thyroid cancers, ATC has a low incidence and contributes to 50% of mortality incidences associated with thyroid cancers (3). Several genetic studies have proposed that differentiated thyroid cancers with BRAF or RAS mutations progress to ATC owing to additional genetic aberrations in the TERT promoter and PIK3CA, PTEN, and TP53 mutations (4,5). This suggests that ATC evolves from differentiated thyroid cancers with additional genetic abnormalities, which have prognostic and therapeutic relevance (6,7).
ATC has been known to have a poor prognosis despite multimodality therapies, including surgery, RAI therapy, and systemic therapy (8,9). Recently, the United States Food and Drug Administration approved the combined use of dabrafenib and trametinib for BRAFV600E -mutated ATC treatment. This combination treatment elicited a considerably good response rate but only for a limited duration (8). More effective therapeutic strategies are warranted to overcome incurable ATC.
The sodium iodide symporter (NIS; SLC5A5; solute carrier family 5, member 5) is an intrinsic transmembrane glycoprotein that mediates active iodide transport through the basolateral membrane and has the highest expression level in the thyroid gland (10). NIS-mediated transport of several radioactive isotopes is the underlying mechanism of several diagnostic and therapeutic modalities (11). 131I, which emits both β and γ rays, has been used as a diagnostic and therapeutic radionuclide for differentiated thyroid cancers. However, ATC, which exhibits dedifferentiation characteristics and disrupted endogenous NIS expression, does not respond to RAI therapy (12). Therefore, redifferentiation to restore NIS expression, followed by RAI therapy, is a potentially promising therapeutic strategy for ATC treatment.
In preclinical studies, retinoic acids, histone deacetylase inhibitors, and PPAR-γ agonists have been used as redifferentiation agents for dedifferentiated thyroid cancers, but they have not been successfully used in clinical trials (13). Recently, several studies have demonstrated the effectiveness of MAPK signaling pathway inhibitors, such as PD0325901 (MEK inhibitor), PLX4720 (BRAF inhibitor), and LY294002 (PI3K-Akt inhibitor), in the restoration of thyroid-specific gene expression in thyroid cancer cells (14,15). Ho et al. reported promising results with improved 124I uptake owing to the use of selumetinib (an MEK inhibitor) for redifferentiation in a clinical trial (16). In another clinical study, dabrafenib (BRAF inhibitor) showed redifferentiation effects in BRAFV600E -mutated thyroid cancer (17).
Numerous studies have demonstrated that a deficiency of both thyroid-specific genes and thyroid transcription factors is closely connected to RAI avidity. Impairment of these genes is often associated with BRAFV600E mutation in thyroid cancer, which, in turn, activates MAPK signaling pathway (18 –20). Moreover, Kogai et al. reported that an inhibitor of the PI3K/Akt signaling pathway (LY294002) increases NIS expression in rat thyroid cells and papillary thyroid cancer (PTC) cells (14). These results suggest that the PI3K/Akt signaling pathway may play a crucial role in the regulation of thyroid-specific iodine metabolism genes. Therefore, blockade of MAPK and PI3K/Akt signaling pathways can be a potential strategy to reinduce NIS expression and RAI avidity through redifferentiation in dedifferentiated thyroid cancers.
In this study, we identified a new TKI that restores endogenous NIS expression primarily by blocking MAPK signaling pathways in ATC cells. Furthermore, we investigated the improvement in 131I-mediated cytotoxicity effects through enhancement of RAI avidity caused by pretreatment with TKI in vitro and in vivo.
Materials and Methods
Cell line
Cell lines, including 8505C, BHT101, CAL62, and BCPAP, were purchased from Deutsche Sammlung von Mikroorganismen and Zellkulturen (DSMZ; Braunschweig, Germany); Nthy-ori 3-1, Hth7, TPC-1, and SW1736 were gifts given by Dr. Minho Shong (School of Medicine, Chungnam National University). The 8505C and SW1736 cells were maintained in Roswell Park Memorial Institute-1640 medium (HyClone, Logan, UT) supplemented with 10% fetal bovine serum (FBS; Gibco, Grand Island, NY) and 1% penicillin–streptomycin (HyClone). BCPAP, CAL62, Hth7, Nthy-ori 3-1, and TPC-1 cells were maintained in Dulbecco's modified Eagle's medium (DMEM high glucose; HyClone) supplemented with 10% FBS and 1% penicillin–streptomycin. BHT101 cell line was maintained in DMEM high glucose medium (HyClone) supplemented with 20% FBS and 1% penicillin–streptomycin in a humidified incubator at 37°C with 5% CO2.
Chemicals
The kinase library used in this study was a gift given by the Korea Chemical Bank of the Korea Research Institute of Chemical Technology. Among the TKI candidates, 5-(5-{4H, 5H,6H-cyclopenta[b]thiophen-2-yl}-1,3,4-oxadiazol-2-yl)-1-methyl-1,2-dihydropyridin-2-one was selected as a hit-compound for subsequent experiments. Henceforth, this chemical will be referred to as “CTOM-DHP.” This CTOM-DHP was purchased from Enamine (Monmouth Junction, NJ). A 50 mM stock solution was prepared by dissolving CTOM-DHP in dimethyl sulfoxide and was stored at −20°C.
Bioluminescence monitoring for promoter activity
The pNIS-FL2-TurboFP635-pCMV-Rluc plasmid was constructed and transfected into 8505C cells, as previously described (21). The established stable cell line expressing the dual reporter gene system will henceforth be referred to as “8505C-PNIS-PCMV.” The 8505C-PNIS-PCMV cells were exposed to CTOM-DHP at different concentrations at multiple time points. Cell viability was monitored by adding 10 μg/mL h-coelenterazine and measuring Renilla luciferase (Rluc) activity using an IVIS Lumina III instrument (Perkin-Elmer, Wellesley, MA). Activation of NIS promoter was evaluated by adding 150 μg/mL
Cell viability assay
The half maximal (50%) inhibitory concentration (IC50) of CTOM-DHP against 8505C cells was determined using a cell counting kit-8 (CCK-8) assay. The 8505C cells (5 × 10³) were seeded in a 96-well plate and incubated for 24 hours in a humidified incubator at 37°C with 5% CO2. On the next day, various concentrations (1.5625, 3.125, 6.25, 12.5, 25, 50, and 100 μM) of CTOM-DHP were applied to cells, which were incubated for an additional 72 hours in a CO2 incubator at 37°C. After 72 hours incubation, CCK-8 reagents were added in each well, and absorbance at 450 nm was subsequently measured on a microplate reader (Bio-Rad Laboratories, Inc., Hercules, CA). IC50 value was calculated by GraphPad Prism 5 software version 5.01 (GraphPad Software, Inc., La Jolla, CA).
RNA extraction and real-time quantitative reverse transcription polymerase chain reaction analysis
The 8505C cells were exposed to fixed concentrations of CTOM-DHP for 72 hours. After CTOM-DHP treatment, total RNA was isolated from cells using TRIzol reagent (Invitrogen, San Diego, CA) according to the manufacturer's instruction. Total RNA (1 μg) was converted to cDNA using a High Capacity cDNA Reverse Transcription Kit (Applied Biosystems, Foster City, CA) according to the manufacturer's protocol. Real-time quantitative reverse transcription polymerase chain reaction (qRT-PCR) analysis was performed on a CFX96 Touch Real-Time PCR detection system (Bio-Rad Laboratories, Inc.) using SsoAdvancedTM Universal SYBR Green Supermix (Bio-Rad Laboratories, Inc.) according to the manufacturer's instructions. Primers for NIS, thyroperoxidase (TPO), thyroglobulin (Tg), TSH receptor (TSHR), thyroid transcription factor-1 (TTF-1), and paired box-8 (Pax-8) were used to analyze changes in mRNA expression levels of thyroid-specific genes after treatment of 8505C cells with CTOM-DHP. The r18s was used as an internal control for relative real-time qRT-PCR. The 2−ΔΔCt real-time qRT-PCR analysis method was used to calculate relative expression levels of the target genes. The primers used in these experiments are listed in Supplementary Table S1.
Protein extraction
Cells were cultured at fixed CTOM-DHP concentrations for 72 hours. Cell pellets were then collected, and the cells were lysed using radioimmunoprecipitation assay (RIPA) buffer (Thermo Fisher Scientific, Rockford, IL) containing a protease and phosphatase inhibitor cocktail kit (Thermo Fisher Scientific) to isolate total protein. Lysed cells were briefly vortexed thrice at 10 minutes intervals and subsequently centrifuged at 13,000 g for 20 minutes at 4°C. Membrane and cytoplasmic proteins were extracted from the soluble protein fraction using a Mem-PERTM Plus kit (Thermo Fisher Scientific) according to the manufacturer's protocol. In brief, cell pellets were washed with chilled cell wash solution and centrifuged twice at 300 g for 5 minutes. After discarding the supernatant, cell pellets were treated with a permeabilization buffer containing a protease and phosphatase inhibitor cocktail. To obtain a homogeneous cell suspension, cell pellets were vortexed and incubated at 4°C for 10 minutes under constant mixing. After incubation, cell pellets were centrifuged, and the supernatant containing cytoplasm proteins was isolated. The remaining pellets were treated with solubilization buffer containing a protease and phosphatase inhibitor cocktail for 10 minutes at 4°C under continuous mixing. After centrifugation at 300 g for 5 minutes, membrane proteins were transferred into a new tube. Protein samples were quantified using the bicinchoninic acid (BCA) protein assay kit (Thermo Fisher Scientific). For subsequent Western blot analysis, frozen tumor tissues were ground and the T-PER Tissue Protein Extraction Reagent (Thermo Fisher Scientific) was used to isolate proteins according to the manufacturer's protocol.
Western blot analysis
Equal amounts of protein were electrophoresed on 10% sodium dodecyl sulfate polyacrylamide gels and transferred onto polyvinylidene fluoride membranes (Millipore, Billerica, MA). Membranes were blocked with 3% bovine serum albumin (BSA) prepared in Tris-buffered saline containing Tween-20 (TBS-T) for two hours and then probed overnight at 4°C with their respective primary antibodies diluted in 0.5% BSA. After three washes with TBS-T, membranes were probed with horseradish peroxidase (HRP)-conjugated secondary antibodies for one hour at room temperature. Membranes were then washed thrice with TBS-T and signals were visualized using an enhanced chemiluminescence detection reagent (GE Healthcare Life Sciences, Pittsburgh, PA). Protein bands were detected using a Fusion FX chemiluminescence analyzer system (Vilber Lourmat, Marne-la-Vallée, France) as per the manufacturer's instruction. Band intensities were quantified using a chemiluminescence analyzer system. The relative change in values in comparison with the values pertaining to vehicle administration was calculated. Primary antibodies used in these experiments are listed in Supplementary Table S2. Antimouse and antirabbit HRP-conjugated secondary antibodies (Cell Signaling, Danvers, MA) were used.
In vitro 125I uptake assay
The 8505C cells (5 × 10⁴) were seeded in 24-well plates and incubated with CTOM-DHP in a CO2 incubator at 37°C for 72 hours and 5% CO2. After incubation, the medium was aspirated and 8505C cells were washed with warm Hank's balanced salt solution (HBSS) containing 0.5% BSA (bHBSS). Cells were subsequently incubated with 500 μL bHBSS, 37 kBq carrier-free 125I (Perkin-Elmer, Waltham, MA), and 100 μmol/L sodium iodide (NaI, specific activity of 740 MBq/mM) in a humidified incubator at 37°C for 30 minutes. To prevent 125I uptake, 8505C cells were treated with 50 μM potassium perchlorate (KClO4), which is a competitive inhibitor of iodide transport, for 30 minutes before adding 125I. After incubation, cells were washed twice with chilled bHBSS and lysed with 500 μL of RIPA buffer. Radioactivity was measured using a Cobra II gamma counter (Canberra Packard, Mississauga, Canada). Uptake values were normalized to the total protein concentration, as determined by BCA protein assay kit. Results are represented as count per minute (cpm)/μg.
In vitro 131I clonogenic assay
The 8505C cells (1 × 10⁵) were seeded in a six-well plate and treated with CTOM-DHP for 72 hours. After CTOM-DHP treatment, the medium was aspirated, and cells were rinsed twice with bHBSS. Thereafter, cells were incubated for 7 hours at 37°C with or without 50 μCi/mL 131I (KIRAMS, Seoul, Korea) supplemented with 30 μM NaI. After incubation, cells were washed twice with bHBSS, trypsinized, counted, and reseeded into a new six-well plate at a density of 1 × 10³ cells/well. Cells were then incubated at 37°C for 10 days with 5% CO2 to enable colony formation. On day 10, the medium was removed and cells were rinsed twice with PBS. Colonies formed on the six-well plates were then fixed with fixation buffer containing 1:7 acetic acid–methanol. Fixed colonies were stained with 0.05% crystal violet for one hour and immersed in tap water to rinse off the excess crystal violet. Colonies with >50 cells in each treatment group were counted. Results were reported as survival fraction (%), which was calculated as plating efficacy (PE) of the treated sample divided by PE of the vehicle.
Immunofluorescence imaging for NIS and γH2A.X foci assay
The 8505C cells (2.5 × 10⁴) were cultured for 24 hours in 4-well chamber slides at 37°C in a 5% CO2 humidified atmosphere. For NIS immunofluorescence imaging, cells were exposed to 25 μM CTOM-DHP for 72 hours. For γH2A.X foci immunofluorescence imaging, 8505C cells were treated with 25 μM CTOM-DHP or 131I alone or with a combination of both treatments. In the combination treatment group, 131I was added after 72 hours of CTOM-DHP treatment. After incubation, cells were fixed with methanol for 10 minutes at −20°C and washed thrice with PBS for 10 minutes. Cells were then permeabilized by incubating with 0.3% Triton X-100 for 90 seconds, followed by three washes with PBS for 10 minutes. Cells were blocked with 3% BSA in PBS for 1 hour and were incubated overnight at 4°C with an anti-NIS primary antibody (1:50; Abcam, Cambridge, United Kingdom). After primary antibody incubation, cells were rinsed thrice with PBS for 10 minutes and probed with Alexa-Fluor 488-conjugated secondary antibody (1:100; Thermo Fisher Scientific) for 1 hour. To detect γH2A.X foci, cells were incubated with anti-γH2A.X antibody conjugated with Dylight 488 (Abcam) at room temperature for four hours. Coverslips were mounted onto chamber slides using Vecta mounting medium containing 4′,6-diamidino-2-phenylindole (Vector Laboratories, Burlingame, CA). NIS- and γH2A.X-stained cells were observed using confocal laser microscopy (LSM 5 exciter; Zeiss, Oberkochen, Germany).
Establishment of a tumor xenograft mouse model
All animal procedures were reviewed and approved by the Kyungpook National University Animal Care and Use Committee (No. 2018-0082) and were performed in accordance with the Guiding Principles for the Care and Use of Laboratory Animals. Female five-week-old Balb/c nude mice were purchased from Hamamatsu (Shizuoka, Japan). Mice were maintained under specific pathogen-free conditions for one week to facilitate their adaptation to the experimental conditions. Throughout the experiments, animals were maintained at room temperature (20–25°C) under 40–70% relative humidity. To establish tumor xenograft mouse models, 8505C-PNIS-PCMV cells (5 × 10⁶) were mixed with Matrigel (Corning, Bedford, MA) at a 1:1 ratio and were subcutaneously injected into the right flank region. When the average tumor size of mice reached ∼50 mm3, in vivo experiments were initiated.
In vivo bioluminescence imaging and measurement of tumor volume
To determine activation of the NIS promoter, mice were divided into two groups, the vehicle group and treatment group (100 mg/kg CTOM-DHP) (n = 5 in each group). Mice were administrated 100 mg/kg of CTOM-DHP every day for 7 days through intraperitoneal (i.p.) injection and were monitored on days −1, 3, 5, and 7 during the course of CTOM-DHP treatment. To monitor Rluc activity, 15 μg/mL of h-coelenterazine was administered through intravenous (i.v.) injection, and the mice were serially imaged using an IVIS Lumina III instrument. Similar to Rluc activity experiments, Fluc activity was monitored using an IVIS Lumina III instrument after i.p. injection of mice with 150 μg/mL
123I gamma camera imaging
When the tumors attained a volume of ∼50 mm3, mice were divided into two groups (n = 8): the vehicle group and the CTOM-DHP (100 mg/kg) treatment group. CTOM-DHP was administrated every day through i.p. injection for seven days. To perform 123I gamma camera imaging, all mice were administrated 18.5–22.2 MBq 123I through i.v. injection. Imaging was performed using a two-millimeter pinhole collimator with an Infinia II gamma camera (GE Healthcare, Milwaukee, WI). The mice were maintained under isoflurane (Forane; ChoongWae Co.) anesthesia during the experiment. Quantitative analyses were performed by assessing the regions of interest (ROIs) of the tumor region in the right flank, and the values obtained were normalized with ROIs in the left flank. Data are presented as tumor/contralateral ratio.
125I biodistribution and 125I autoradiography
125I biodistribution was performed as described previously (22). In brief, the tumor-bearing mice were injected with 1.85 MBq 125I through i.v. injection on day 8 after 7 days of administration with 100 mg/kg CTOM-DHP. Four hours after 125I injection, blood samples were taken, and the mice were sacrificed. Radioactivity in the tumor, intestine, stomach, spleen, kidney, liver, heart, lungs, thyroid, brain, muscle, and bone was measured using a Cobra II gamma-counter (Canberra Packard). Data are expressed as the injected dose per gram of tissue in percentage (%ID/g). For 125I autoradiography experiments, the tumors were collected and frozen at −20°C for 2 hours. Next, frozen tumors were fixed with Tissue-Tek O.C.T compound (Sakura Finetek, Zoeterwoude, Netherlands) in a suitable tissue mold for one hour. Subsequently, specimens were cut into 20-μm-thick sections by using a cryostat and mounted on glass slides. The glass slides were exposed on an imaging plate (IP) for 24 hours; subsequently, the exposed IP was read using a fluorescent image analyzer (FLA-3000; Fujifilm, Tokyo, Japan). Quantitative IP analysis was performed using Multi Gauge V3.0 software (Fujifilm). The data were background corrected and are presented as photo-stimulated luminescence signals per square millimeter (PSL/mm2).
Immunohistochemistry
Tumors were fixed with 4% formalin overnight. Specimens were subsequently embedded in paraffin, cut into 4-μm-thick sections, and mounted on slides. Sections on slides were deparaffinized and stained using hematoxylin and eosin. Immunohistochemical staining was performed using VECTASTAIN Elite ABC HRP KIT (Vector Laboratories) according to the manufacturer's instruction. Anti-NIS (Thermo Fisher Scientific; working dilution of 1:200) and anti-γH2A.X (Abcam; working dilution of 1:200) antibodies were used. Stained slides were analyzed using light microscopy.
Statistical analysis
All data are expressed as mean ± standard deviation. Two groups of data were statistically analyzed by Student's t-test using GraphPad Prism 5 software version 5.01 (GraphPad Software, Inc.). A p-value of <0.05 was considered to be statistically significant.
Results
Identification of an NIS enhancer for ATC cells from a TKI library
To identify an effective TKI that enhances NIS promoter activity, quantitative BLI analysis was performed. Rluc activity was initially confirmed after which Fluc activity was sequentially monitored by BLI (Fig. 1A, B). The compound “5-(5-{4H,5H,6H-cyclopenta[b]thiophen-2-yl}-1,3,4-oxadiazol-2-yl)-1-methyl-1,2-dihydropyridin-2-one,” referred herein as CTOM-DHP, was identified as a hit compound that showed a higher tendency to enhance NIS promoter activity than that shown by the vehicle. In comparison with the vehicle, the selected CTOM-DHP showed a 2.67-fold increase in Fluc activity, which was normalized by Rluc activity (Fig. 1C). Detailed information about CTOM-DHP is presented in Supplementary Figure S1A. Next, 8505C cells with both NIS- and CMV-promoter–driven reporter gene systems were incubated with CTOM-DHP at different concentrations, with multiple time points to monitor NIS promoter activity. As shown in Figure 1D, 72 hours of treatment resulted in the highest Fluc activity compared with that at other time points, thereby indicating the extent of NIS promoter activity. Fluc activity also increased with increasing CTOM-DHP concentration up to 25 μM. CTOM-DHP concentrations of 6.25, 12.5, and 25 μM showed the strongest effects at the 72 hours time point. However, Fluc activity decreased on treatment with 50 μM CTOM-DHP. Rluc activity, which is reflective of cell viability, suggested that CTOM-DHP has only a small effect on cell survival (Fig. 1E). Based on Rluc activity, we determined IC50 of CTOM-DHP by performing CCK-8 assay. As shown in Supplementary Figure S1B, IC50 value was 39.05 μM (LogIC50 = 1.592 μM, R 2 = 0.8824). Normalized NIS promoter activity (Fluc activity normalized to Rluc activity) was the highest for groups that were treated with 50 μM CTOM-DHP owing to low Rluc activity. Therefore, the two CTOM-DHP concentrations (12.5 and 25 μM) showing the highest NIS promoter activity, barring 50 μM CTOM-DHP, were used for subsequent experiments (Fig. 1F).
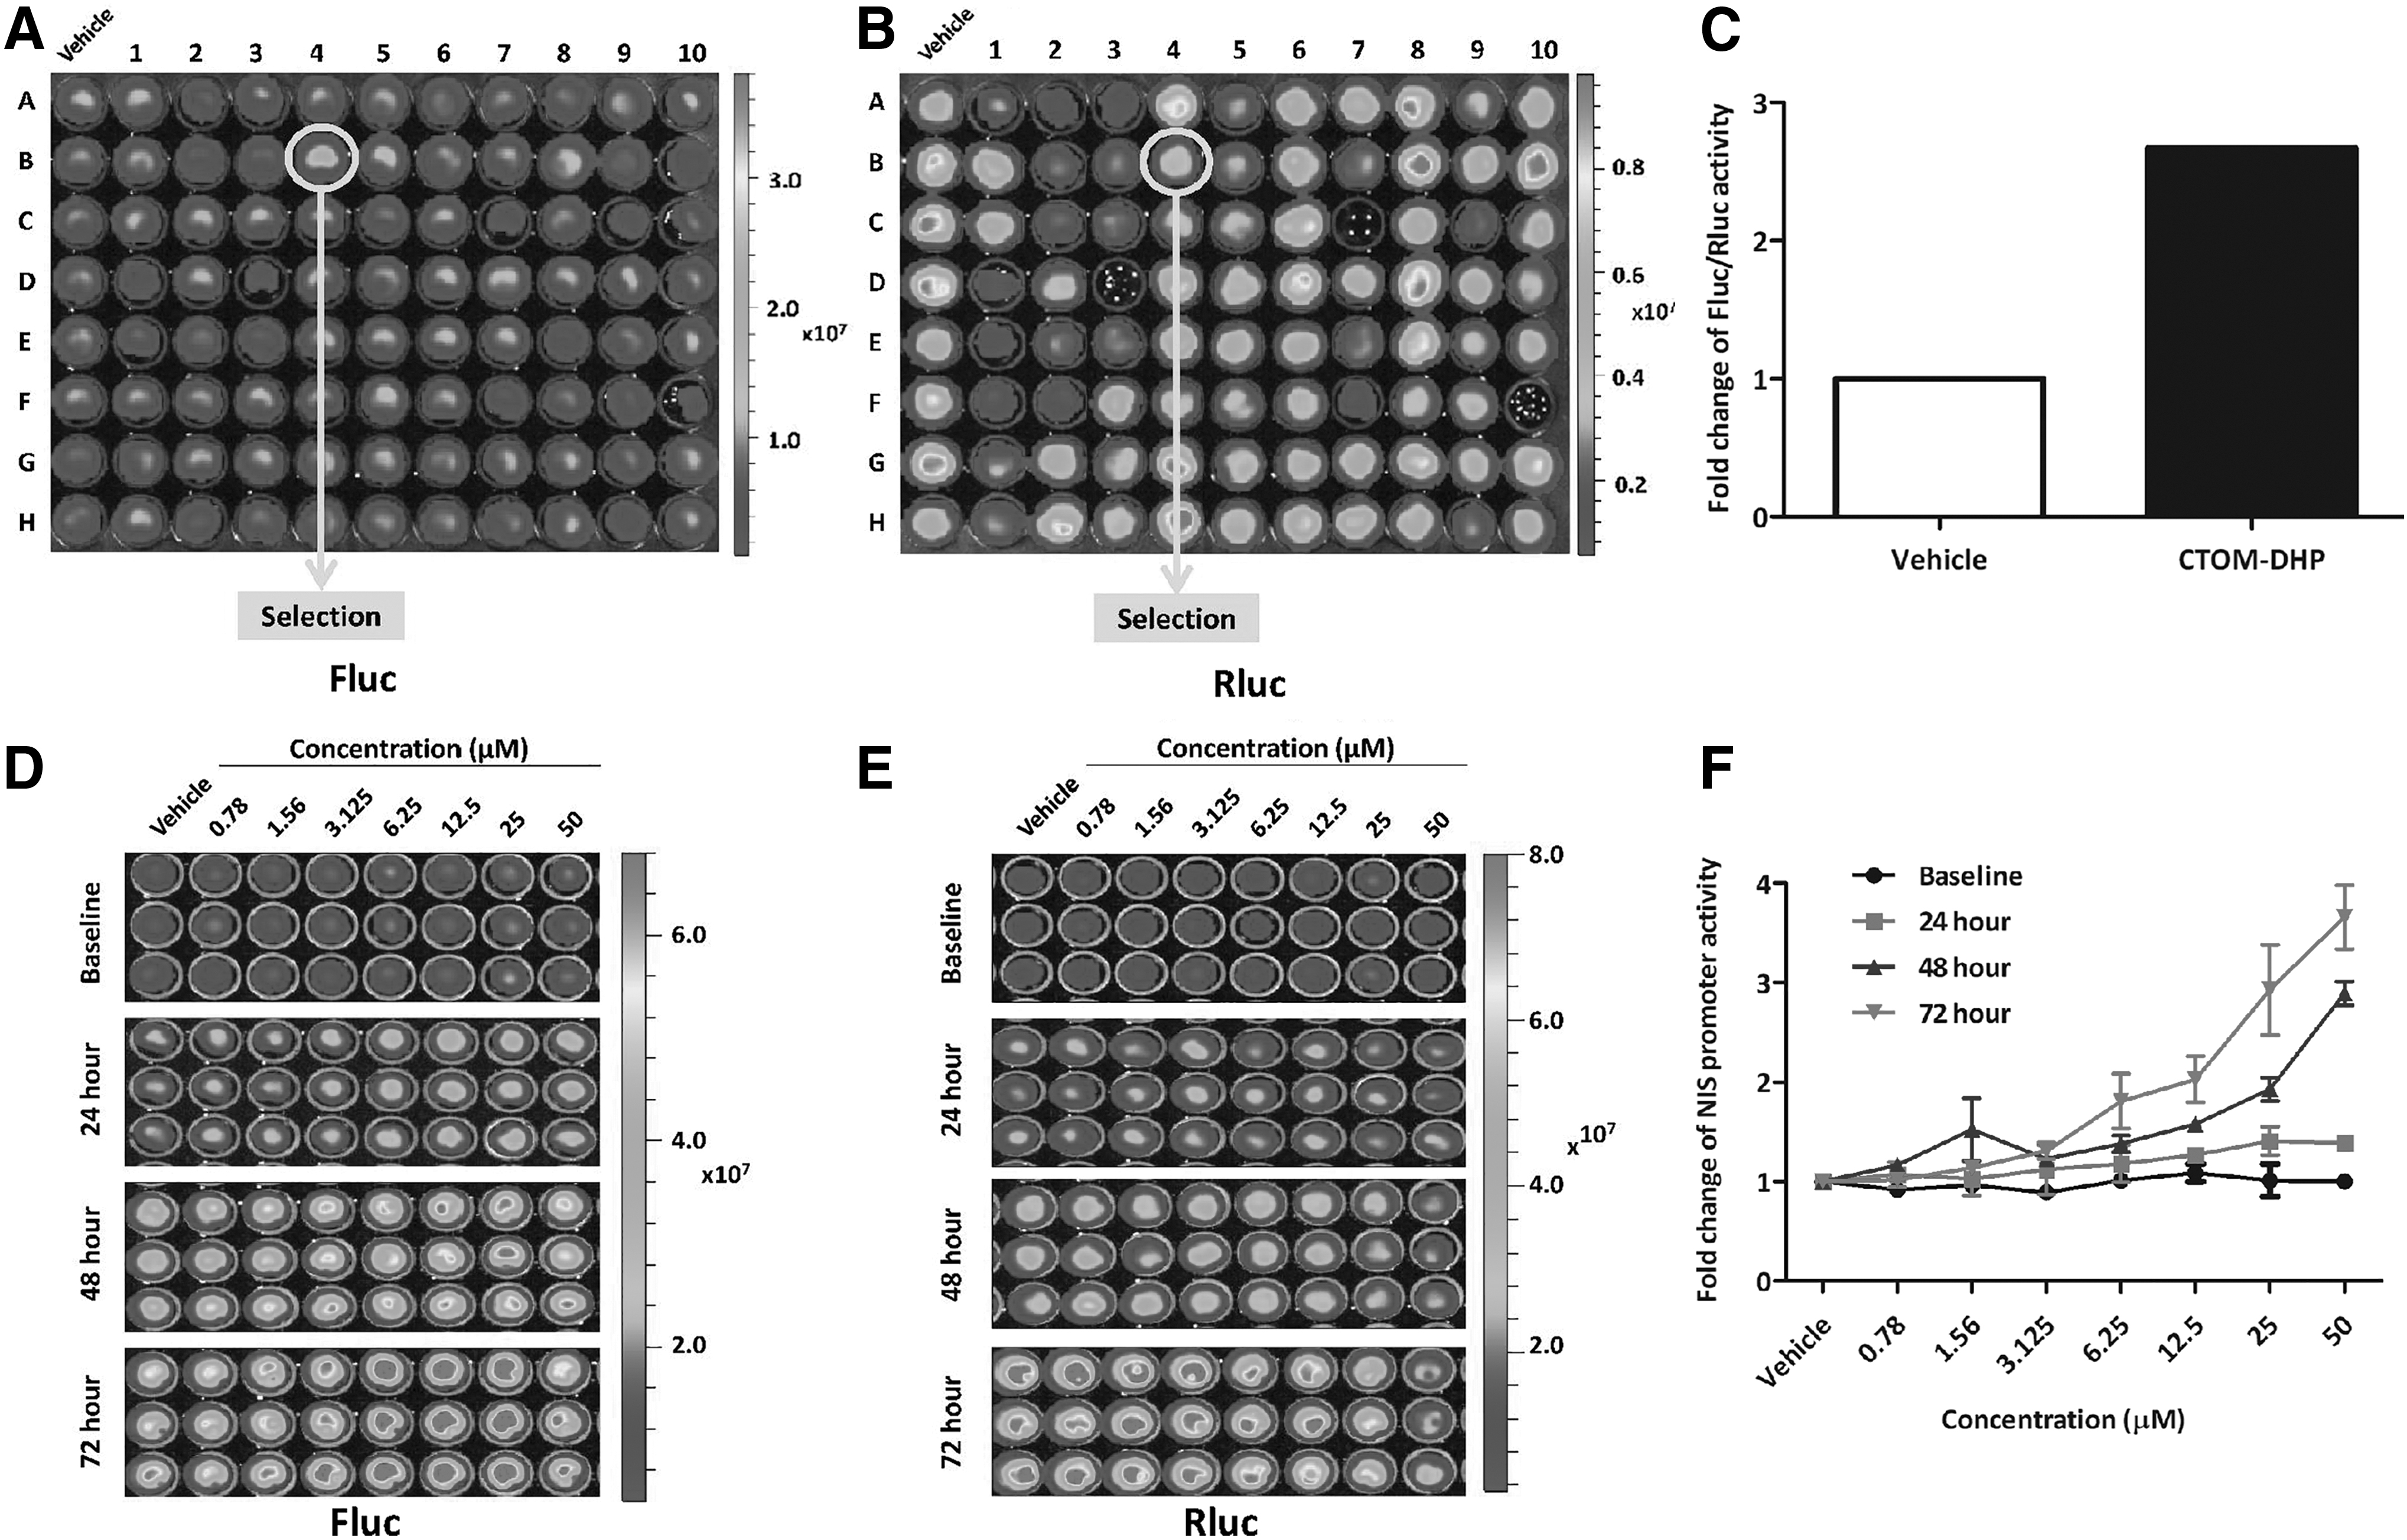
Screening of NIS promoter-enhancing TKIs and evaluation of CTOM-DHP efficacy in a time- and concentration-dependent manner in 8505C-PNIS-PCMV cells. Signal activities of Firefly luciferase (Fluc) and Renilla luciferase (Rluc) are regulated by the NIS promoter and CMV promoter, respectively. (
Robust induction of thyroid-specific genes and thyroid transcription factors by CTOM-DHP treatment in ATC cells
Because thyroid-specific genes, such as NIS, and transcription factors are important in the concentration and retention of iodine, we tested the effects of CTOM-DHP on the expression levels of these genes in 8505C ATC cells. As shown in Figure 2, NIS mRNA expression level in CTOM-DHP treatment groups significantly increased compared with the level in the vehicle group. In particular, the highest CTOM-DHP treatment concentration of 25 μM showed a 13.11-fold increase in NIS mRNA expression. The lowest CTOM-DHP treatment concentration of 12.5 μM resulted in a 2.02-fold increase. Moreover, treatment with 25 μM CTOM-DHP restored the gene expression levels of the thyroid-specific genes, namely TPO, Tg, and TSHR, to various extents as opposed to administration of vehicle (TPO: 10.08 ± 3.15, Tg: 19.08 ± 2.75, and TSHR: 12.39 ± 1.99). Furthermore, the thyroid transcription factors (TTF-1 and Pax-8) also showed increased expression after treatment with 25 μM CTOM-DHP as opposed to the expression after vehicle administration (TTF-1: 2.59 ± 0.24 and Pax-8: 12.1 ± 4.10). However, except for Tg gene expression, treatment with 12.5 μM CTOM-DHP exerted no significant effects in comparison with vehicle. In addition, treatment for 72 hours showed a greater effect on mRNA expression levels than other treatment time points (data not shown). These results revealed that treatment of CTOM-DHP sufficiently increased mRNA expression levels of thyroid-specific genes, including NIS, and thyroid transcription factors.
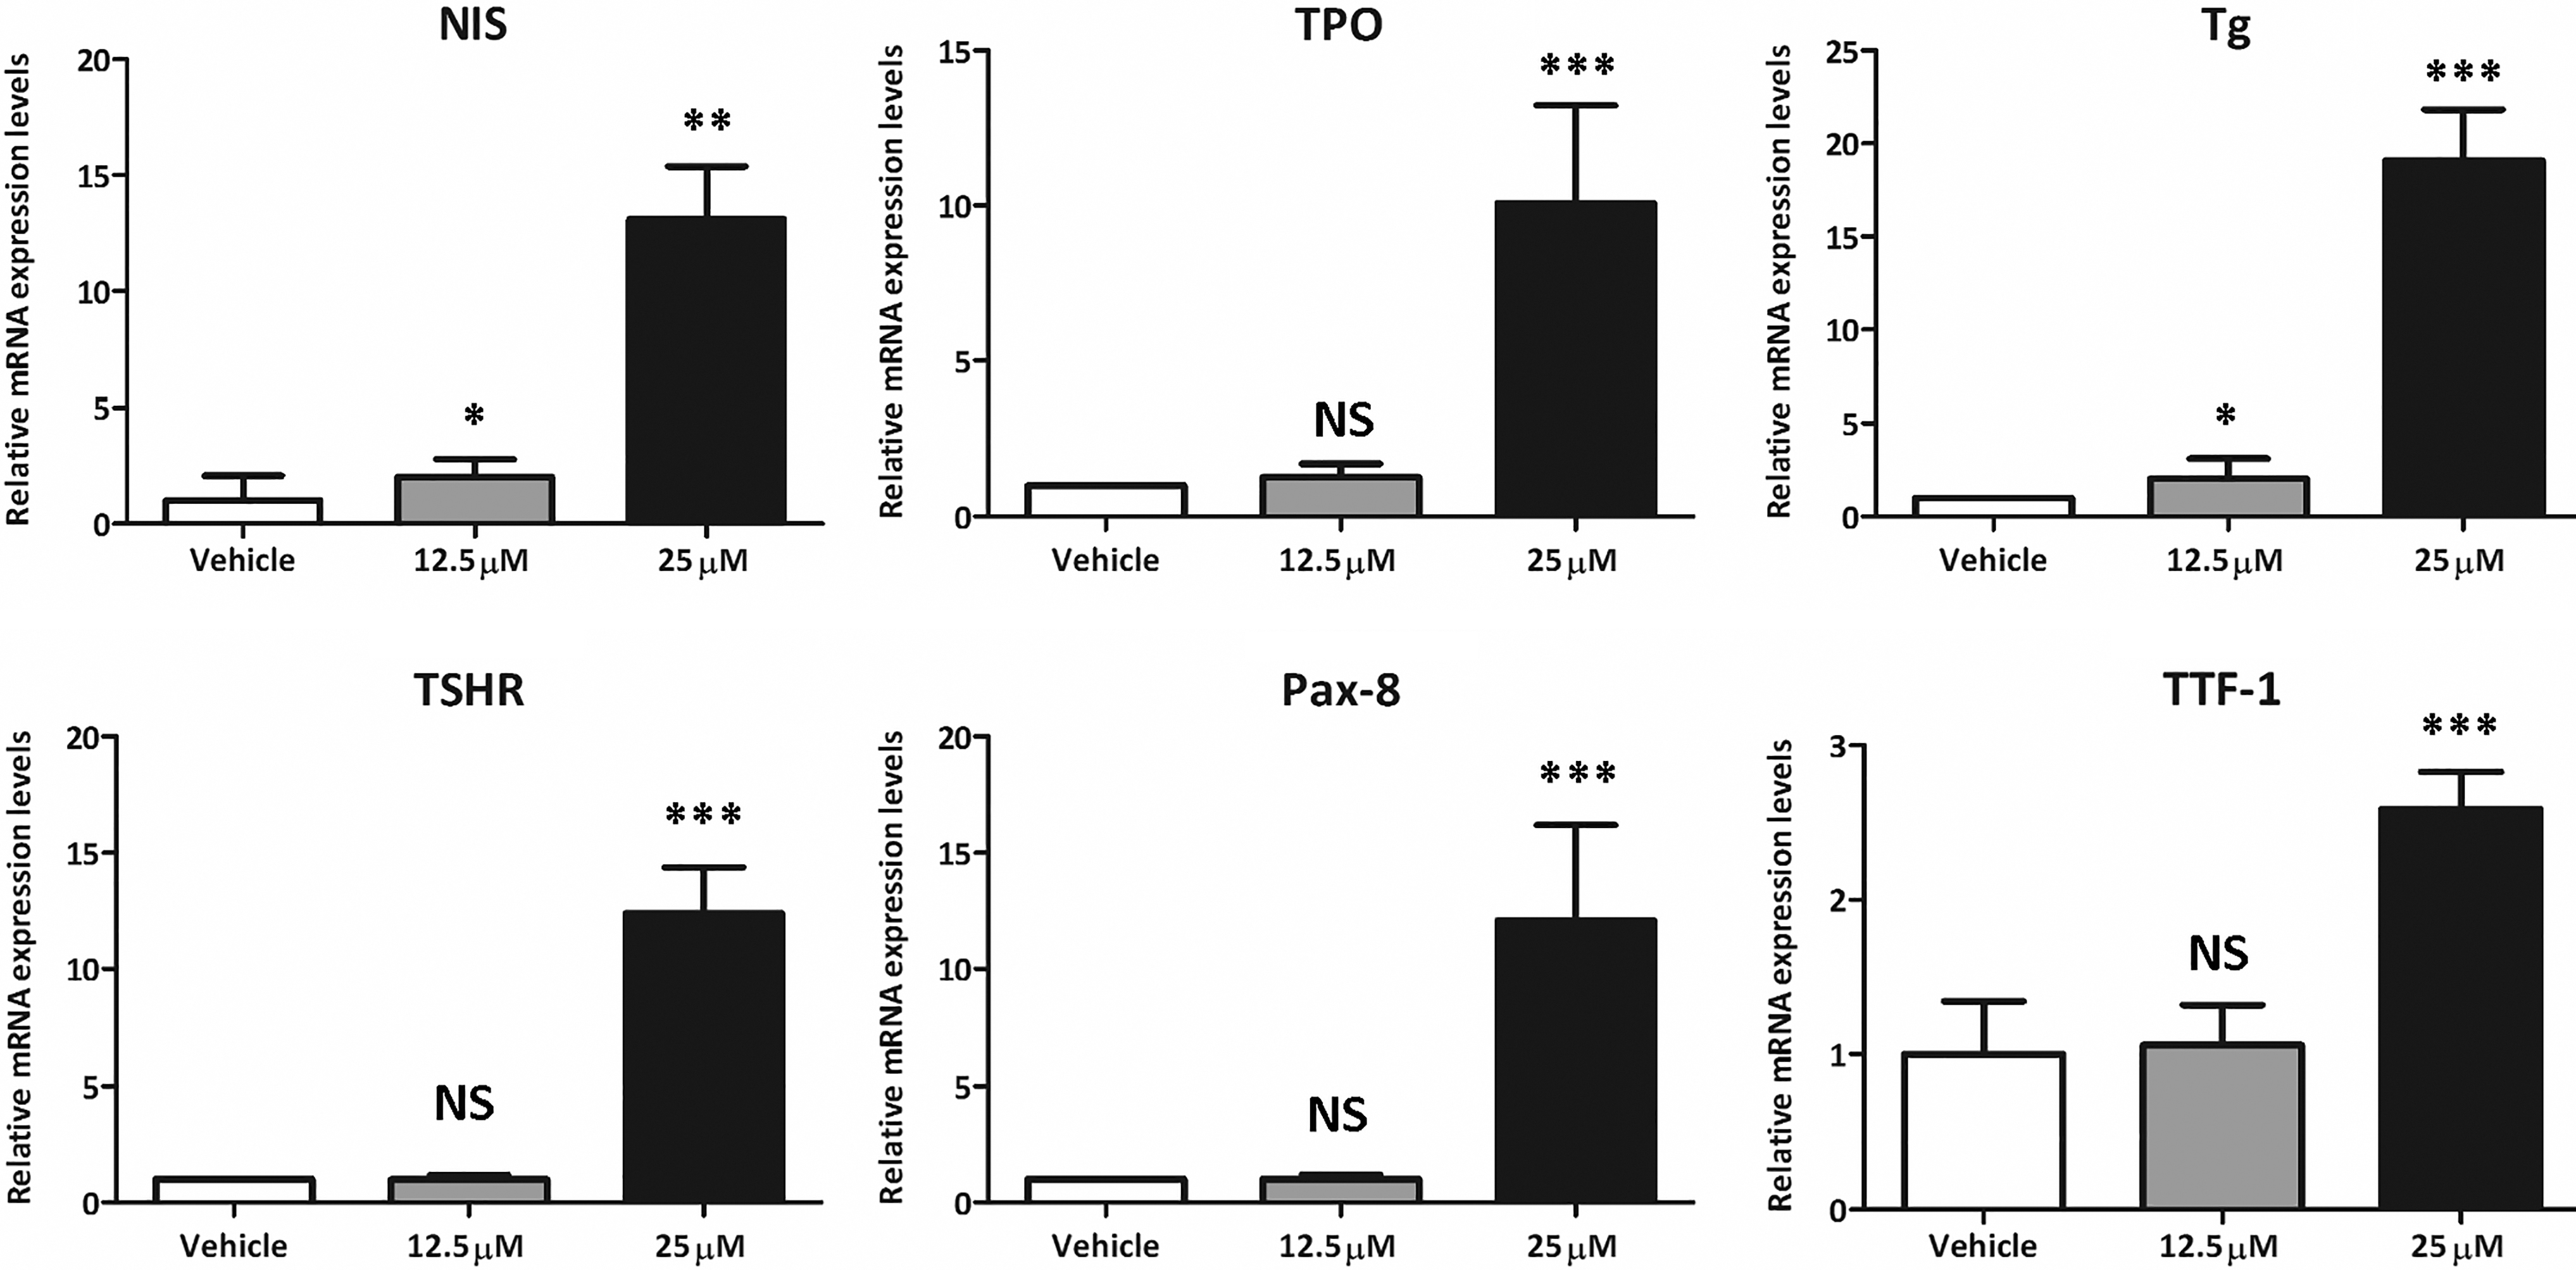
Change in mRNA expression levels after CTOM-DHP treatment of 8505C ATC cells. The 8505C cells were exposed to fixed concentrations of CTOM-DHP (12.5, 25 μM) for 72 hours. NIS, TPO, Tg, and TSHR are thyroid-specific genes in thyroid cells. Pax-8 and TTF-1 are thyroid-transcription factors in thyroid cells; r18s was used as a housekeeping gene. The results are expressed as mean ± SD values of the experiment performed in triplicates. ***p < 0.001, **p < 0.01, *p < 0.05, NS, not significant (by Student's t-test). TPO, thyroperoxidase; Tg, thyroglobulin; TSHR, TSH receptor; TTF-1, thyroid transcription factor-1; Pax-8, paired box-8.
Increased expression of endogenous NIS protein expression and its localization in 8505C ATC cells in response to CTOM-DHP treatment
After investigating the effects on mRNA expression levels of thyroid metabolism-related genes, we evaluated the expression levels and localization of endogenous NIS because it is crucial to iodide uptake restoration. As shown in Figure 3A, treatment with CTOM-DHP increased endogenous NIS in whole cell lysates. Because NIS expression in the cell membrane is important for iodine uptake (12), we subsequently examined cellular localization of NIS after CTOM-DHP treatment. Endogenous NIS localization to the membrane and cytoplasm was both increased after CTOM-DHP treatment. Quantitative analysis of band intensities showed an increase in NIS protein content in whole cell lysates for CTOM-DHP-treated groups relative to that in the vehicle-administered group (1.24 ± 0.14 and 1.49 ± 0.16 at 12.5 and 25 μM concentrations, respectively; Fig. 3B upper panel). The amount of NIS protein in the membrane increased by 1.77- and 1.95-fold in response to treatment with 12.5 and 25 μM CTOM-DHP, respectively. The amount of NIS protein in the cytoplasm also increased, but not much compared with NIS protein in the membrane (1.25 ± 0.18 and 1.29 ± 0.20 at 12.5 and 25 μM concentrations, respectively; Fig. 3B lower panel). In addition, induction of endogenous NIS expression was monitored by immunofluorescence microscopy, as shown in Figure 3C. After CTOM-DHP treatment, 8505C ATC cells showed robust expression of endogenous NIS, localized to the cell membranes and cytoplasm, whereas the vehicle group showed a weak endogenous NIS expression. These results suggest that treatment with CTOM-DHP restored endogenous NIS protein expression levels similar with mRNA expression levels. Moreover, increase of endogenous NIS expression consisted predominantly in the membrane fraction rather than in the cytoplasmic fraction.
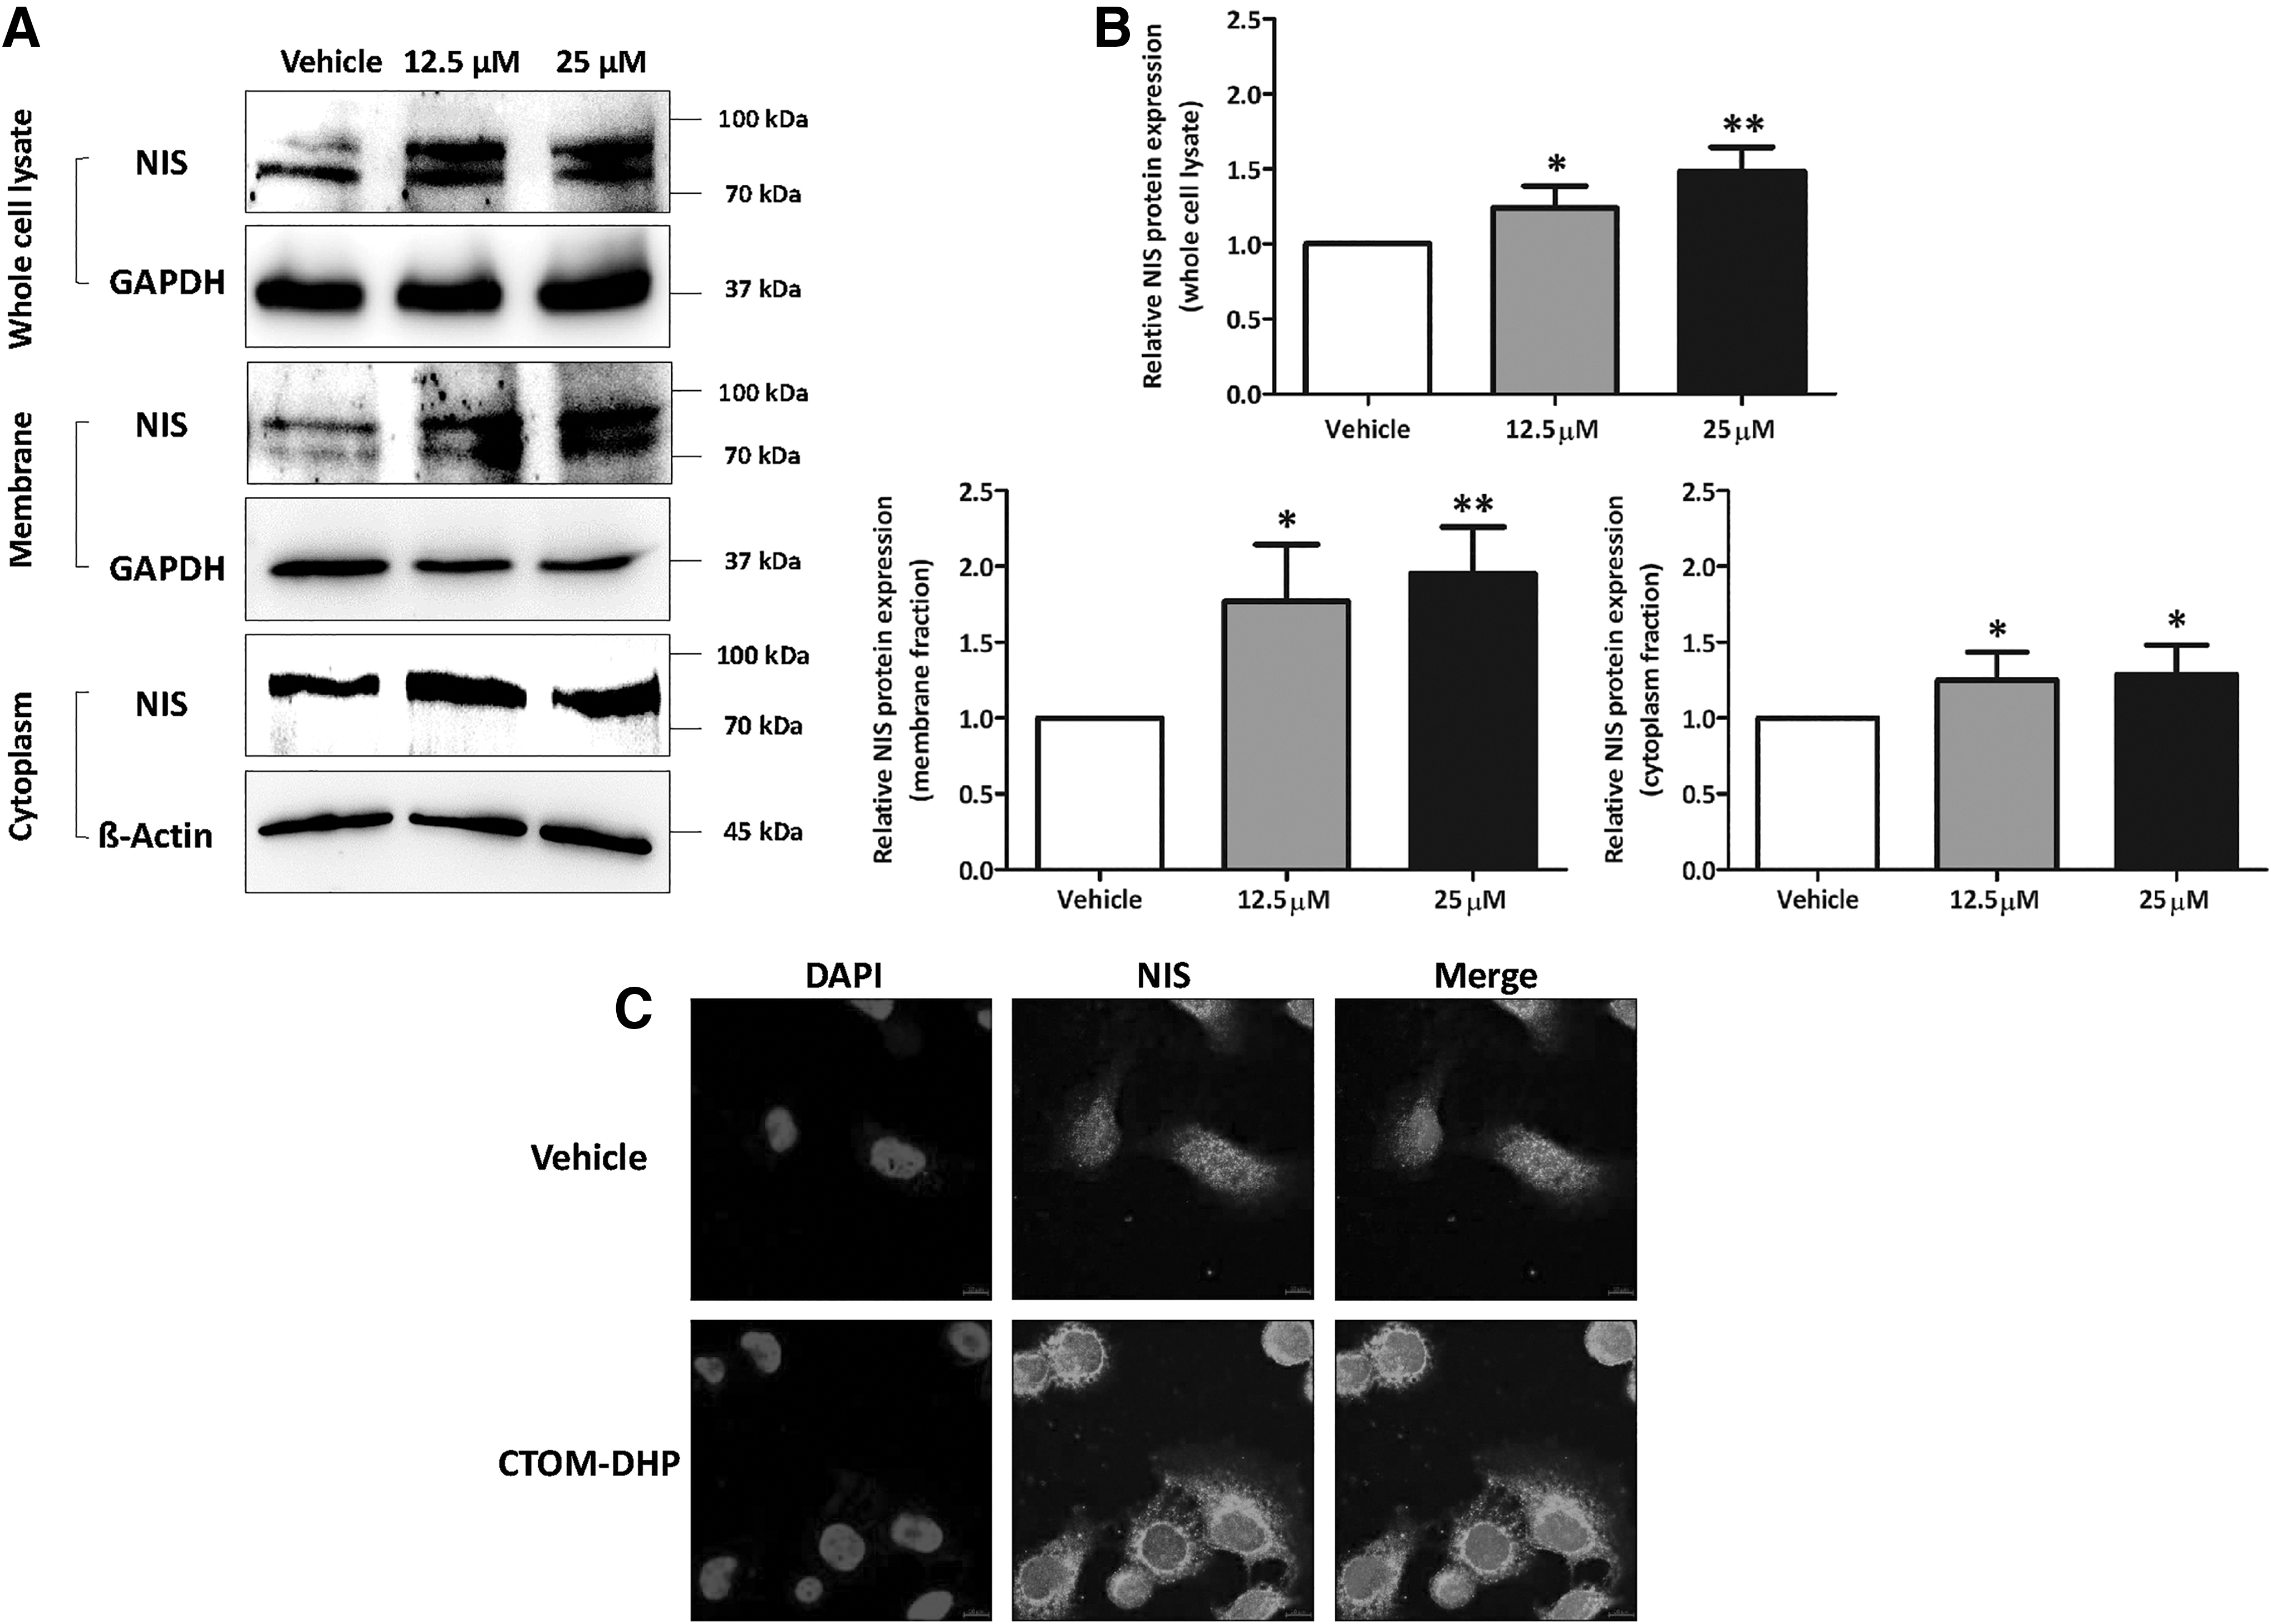
Endogenous NIS expression and localization in 8505C ATC cells after CTOM-DHP treatment. The 8505C cells were exposed to CTOM-DHP for 72 hours. (
Expression of endogenous NIS protein expression in several thyroid cancer cell lines and in normal thyrocytes after CTOM-DHP treatment
We sought to characterize the change in endogenous NIS expression level in various thyroid cancer cell lines harboring different mutations and in normal thyrocytes in response to CTOM-DHP treatment. We selected six thyroid cancer cell lines and one normal thyrocyte cell line (Supplementary Fig. S2A). As shown by the bands obtained from Western blot in Supplementary Figure S2B, NIS protein expression in the normal Nthy-ori 3-1 cell line was not significantly affected by treatment with CTOM-DHP. Quantitative analyses data of the Western blot bands showed intensities of 0.97 ± 0.23 and 1.04 ± 0.16 in response to treatment with 12.5 and 25 μM CTOM-DHP, respectively (Supplementary Fig. S2B lower panel). Next, Hth7 cancer cells carrying a NRAS Q61R mutation did not show changes in endogenous NIS expression levels in response to CTOM-DHP treatment (1.02 ± 0.13 and 1.00 ± 0.31 with 12.5 and 25 μM CTOM-DHP, respectively; Supplementary Fig. S2C). CTOM-DHP treatment significantly increased endogenous NIS protein expression levels in CAL62 ATC cells harboring KRAS G12R (1.60 ± 0.34 and 1.65 ± 0.32 at 12.5 and 25 μM concentrations, respectively; Supplementary Fig. S2D). TPC-1 cells carrying an RET/PTC mutation also markedly reinduced endogenous NIS expression levels in response to CTOM-DHP treatment (1.23 ± 0.14 and 1.40 ± 0.18 at 12.5 and 25 μM concentrations, respectively; Supplementary Fig. S2E). Subsequently, we studied cancer cell lines harboring a BRAFV600E mutation; we selected one PTC cell line and two ATC cell lines harboring BRAFV600E mutation and subjected them to CTOM-DHP treatment and performed Western blot analysis. Western blot analysis revealed that endogenous NIS expression levels increased by 1.3-fold in CTOM-DHP–treated BCPAP PTC cells at a concentration of 25 μM as opposed to the vehicle-administered BCPAP PTC cells (Supplementary Fig. S2F). Endogenous NIS protein expression levels also markedly increased in BHT101 and SW1736 ATC cells harboring BRAFV600E mutation. In case of BHT101 ATC cells, quantitative analysis revealed a 1.49- and 1.64-fold increase at CTOM-DHP concentrations of 12.5 and 25 μM, respectively (Supplementary Fig. S2G). CTOM-DHP treatment at a concentration of 25 μM was statistically significant (p = 0.0228). In SW1736 ATC cells, quantitative analysis revealed 2.10- and 2.48-fold increase at CTOM-DHP concentrations of 12.5 μM (p = 0.0262) and 25 μM (p = 0.0043), respectively (Supplementary Fig. S2H). After CTOM-DHP treatment, SW1736 ATC cells showed a higher NIS protein expression level than BHT101 ATC cells. Taken together, these results suggest that CTOM-DHP treatment did not have any impact on NIS expression in a normal thyrocyte cell line but increased NIS expression in several thyroid cancer cell lines harboring KRAS G12R, RET/PTC, and BRAFV600E mutations.
Influence of CTOM-DHP treatment on the levels of thyroid-specific proteins and thyroid-restricted transcription factors
The mentioned results revealed that CTOM-DHP significantly increased mRNA expression levels of thyroid-specific genes and thyroid transcription factors in 8505C ATC cells. Next, we evaluated the expression levels of key proteins in ATC cells that are involved in iodine uptake regulation. As shown in Figure 4A, Western blot analysis revealed that CTOM-DHP treatment restored the expression of thyroid-specific proteins, namely Tg, TPO, NIS, and TSHR. In addition, expression of thyroid transcription factors (Pax-8 and TTF-1) increased. Based on the band intensities obtained from Western blot analysis, we performed quantification and statistical analyses. Tg protein expression in both 12.5 and 25 μM CTOM-DHP–treated ATC cells (1.40 ± 0.14 and 1.45 ± 0.21, respectively; Fig. 4B upper panel) significantly increased as opposed to that in vehicle-administered cells. TPO protein expression level increased by 2.12-fold after CTOM-DHP treatment at a concentration of 25 μM (Fig. 4B middle). The TSHR is initially expressed as a single polypeptide chain that subsequently undergoes proteolytic cleavage into disulfide-linked A- and B-subunits (23). The expected band sizes for an intact single polypeptide chain, A-subunit, and B-subunit are 115, 62, and 42 kDa, respectively. According to the manufacturer's datasheet, this particular antibody detects only intact TSHR and the A-subunit. As shown in Figure 4A, the TSHR A-subunit (62 kDa) was detected by Western blot. We subsequently performed quantitative analysis of the A-subunit. The results revealed that treatment with 25 μM CTOM-DHP induced a 3.18-fold increase in TSHR protein expression levels (Fig. 4B lower panel). Moreover, the protein expression levels of the thyroid transcription factors, Pax-8 and TTF-1, also increase in response to CTOM-DHP treatment (Fig. 4C); quantitative analysis of Pax-8 revealed a significant increase in its expression at CTOM-DHP concentrations of 12.5 and 25 μM (1.33 ± 0.06 and 1.76 ± 0.20, respectively; Fig. 4C upper panel). Moreover, increase in protein expression levels of TTF-1 was seen in response to treatment with both concentrations of CTOM-DHP (12.5 and 25 μM, 1.34 ± 0.18 and 1.61 ± 0.45, respectively; Fig. 4C lower panel) as opposed to vehicle administration.

Investigation of changes in the expression levels of thyroid iodide metabolism proteins after CTOM-DHP treatment through Western blot analysis. The 8505C ATC cells were incubated with CTOM-DHP for 72 hours. (
Investigation of signaling pathways affecting reinduction of endogenous NIS expression
Previous reports have demonstrated that PI3K-Akt and MAPK signaling pathways are closely related to endogenous thyroid NIS expression and thyroid cancer tumorigenesis (18,24). Based on the mentioned results, we sought to investigate the signaling pathway that was linked to the increase in endogenous NIS expression caused by CTOM-DHP treatment. As shown in Figure 5, Western blot analysis revealed that CTOM-DHP treatment downregulated both signaling pathways. However, Erk phosphorylation was inhibited to a greater extent than Akt phosphorylation after CTOM-DHP treatment. Quantitative analyses revealed that Erk phosphorylation decreased by >40% in response to CTOM-DHP treatment (0.55 ± 0.19 and 0.46 ± 0.21 at 12.5 and 25 μM concentrations, respectively; Fig. 5A). Interestingly, BRAF phosphorylation was also considerably downregulated after CTOM-DHP treatment (0.73 ± 0.24 and 0.64 ± 0.16 at 12.5 and 25 μM concentrations, respectively; Fig. 5B). Furthermore, Akt phosphorylation also decreased in response to CTOM-DHP treatment (0.802 ± 0.065 and 0.804 ± 0.065 at 12.5 and 25 μM concentrations, respectively; Fig. 5C).
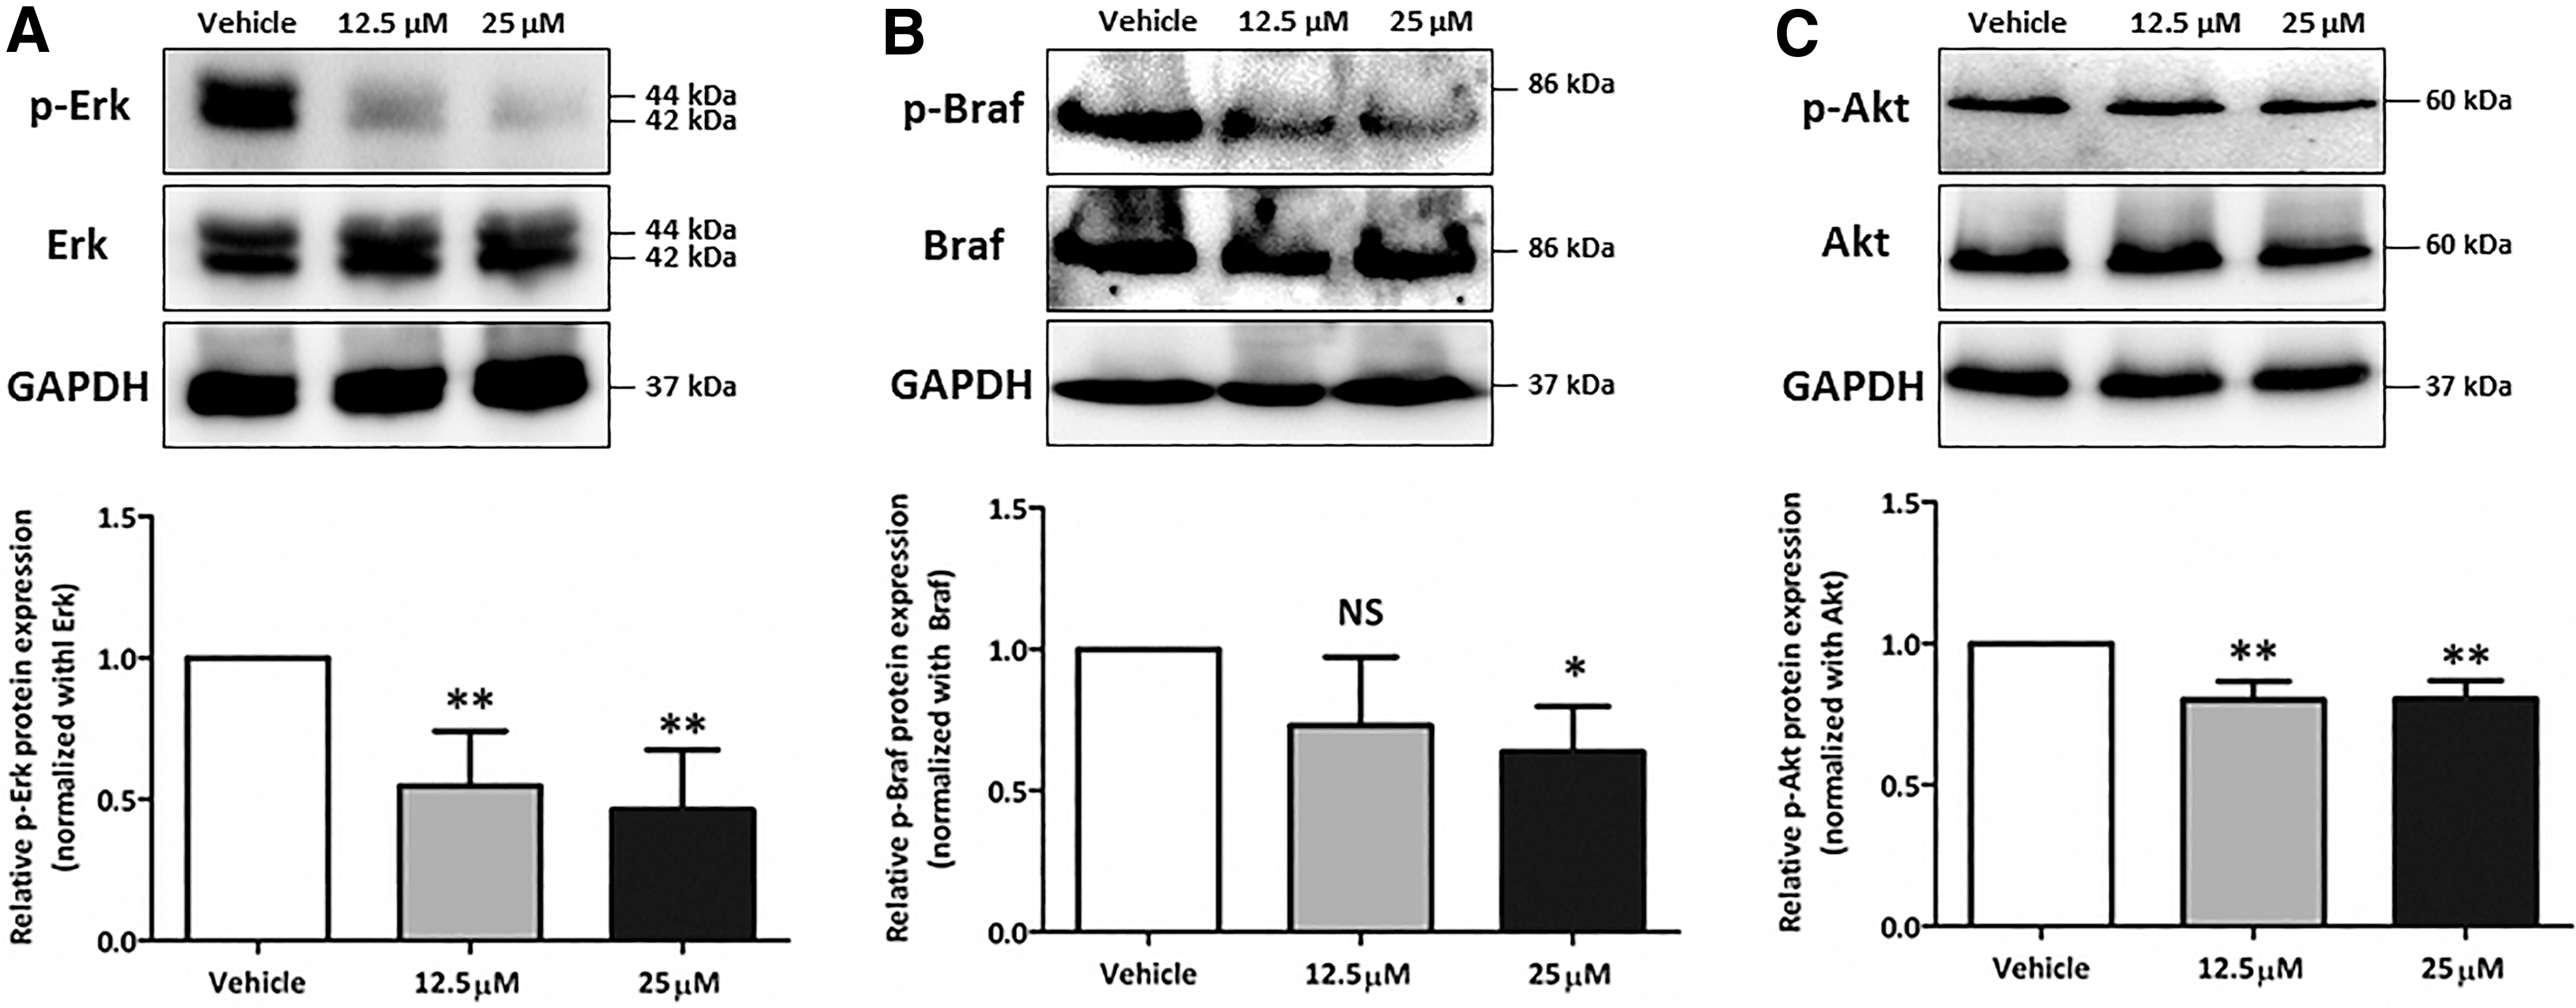
Evaluation of signaling pathways affecting reinduction of endogenous NIS expression. The 8505C ATC cells were incubated with 12.5 and 25 μM CTOM-DHP for 72 hours. (
Evaluation of RAI accumulation caused by functional NIS after CTOM-DHP treatment
To determine whether RAI accumulation was restored together with the recovery of NIS function after CTOM-DHP treatment, we performed an 125I uptake assay. CTOM-DHP treatment, in a concentration-dependent manner, caused a significant increase in the ability of 8505C ATC cells to accumulate iodine (Fig. 6A). The relative fold increase in iodine uptake was 1.72 and 2.54 in 12.5 μM and 25 μM CTOM-DHP–treated cells, respectively, compared with the iodine uptake in vehicle-administered cells. In addition, we investigated the correlation between iodine uptake and functional NIS expression using KClO4, which is a competitive inhibitor of iodide transport. The enhanced iodine uptake after CTOM-DHP treatment was completely blocked by KClO4 (Fig. 6B, C). These results suggest that CTOM-DHP directly influences the augmentation of iodine uptake through expression of functional NIS.
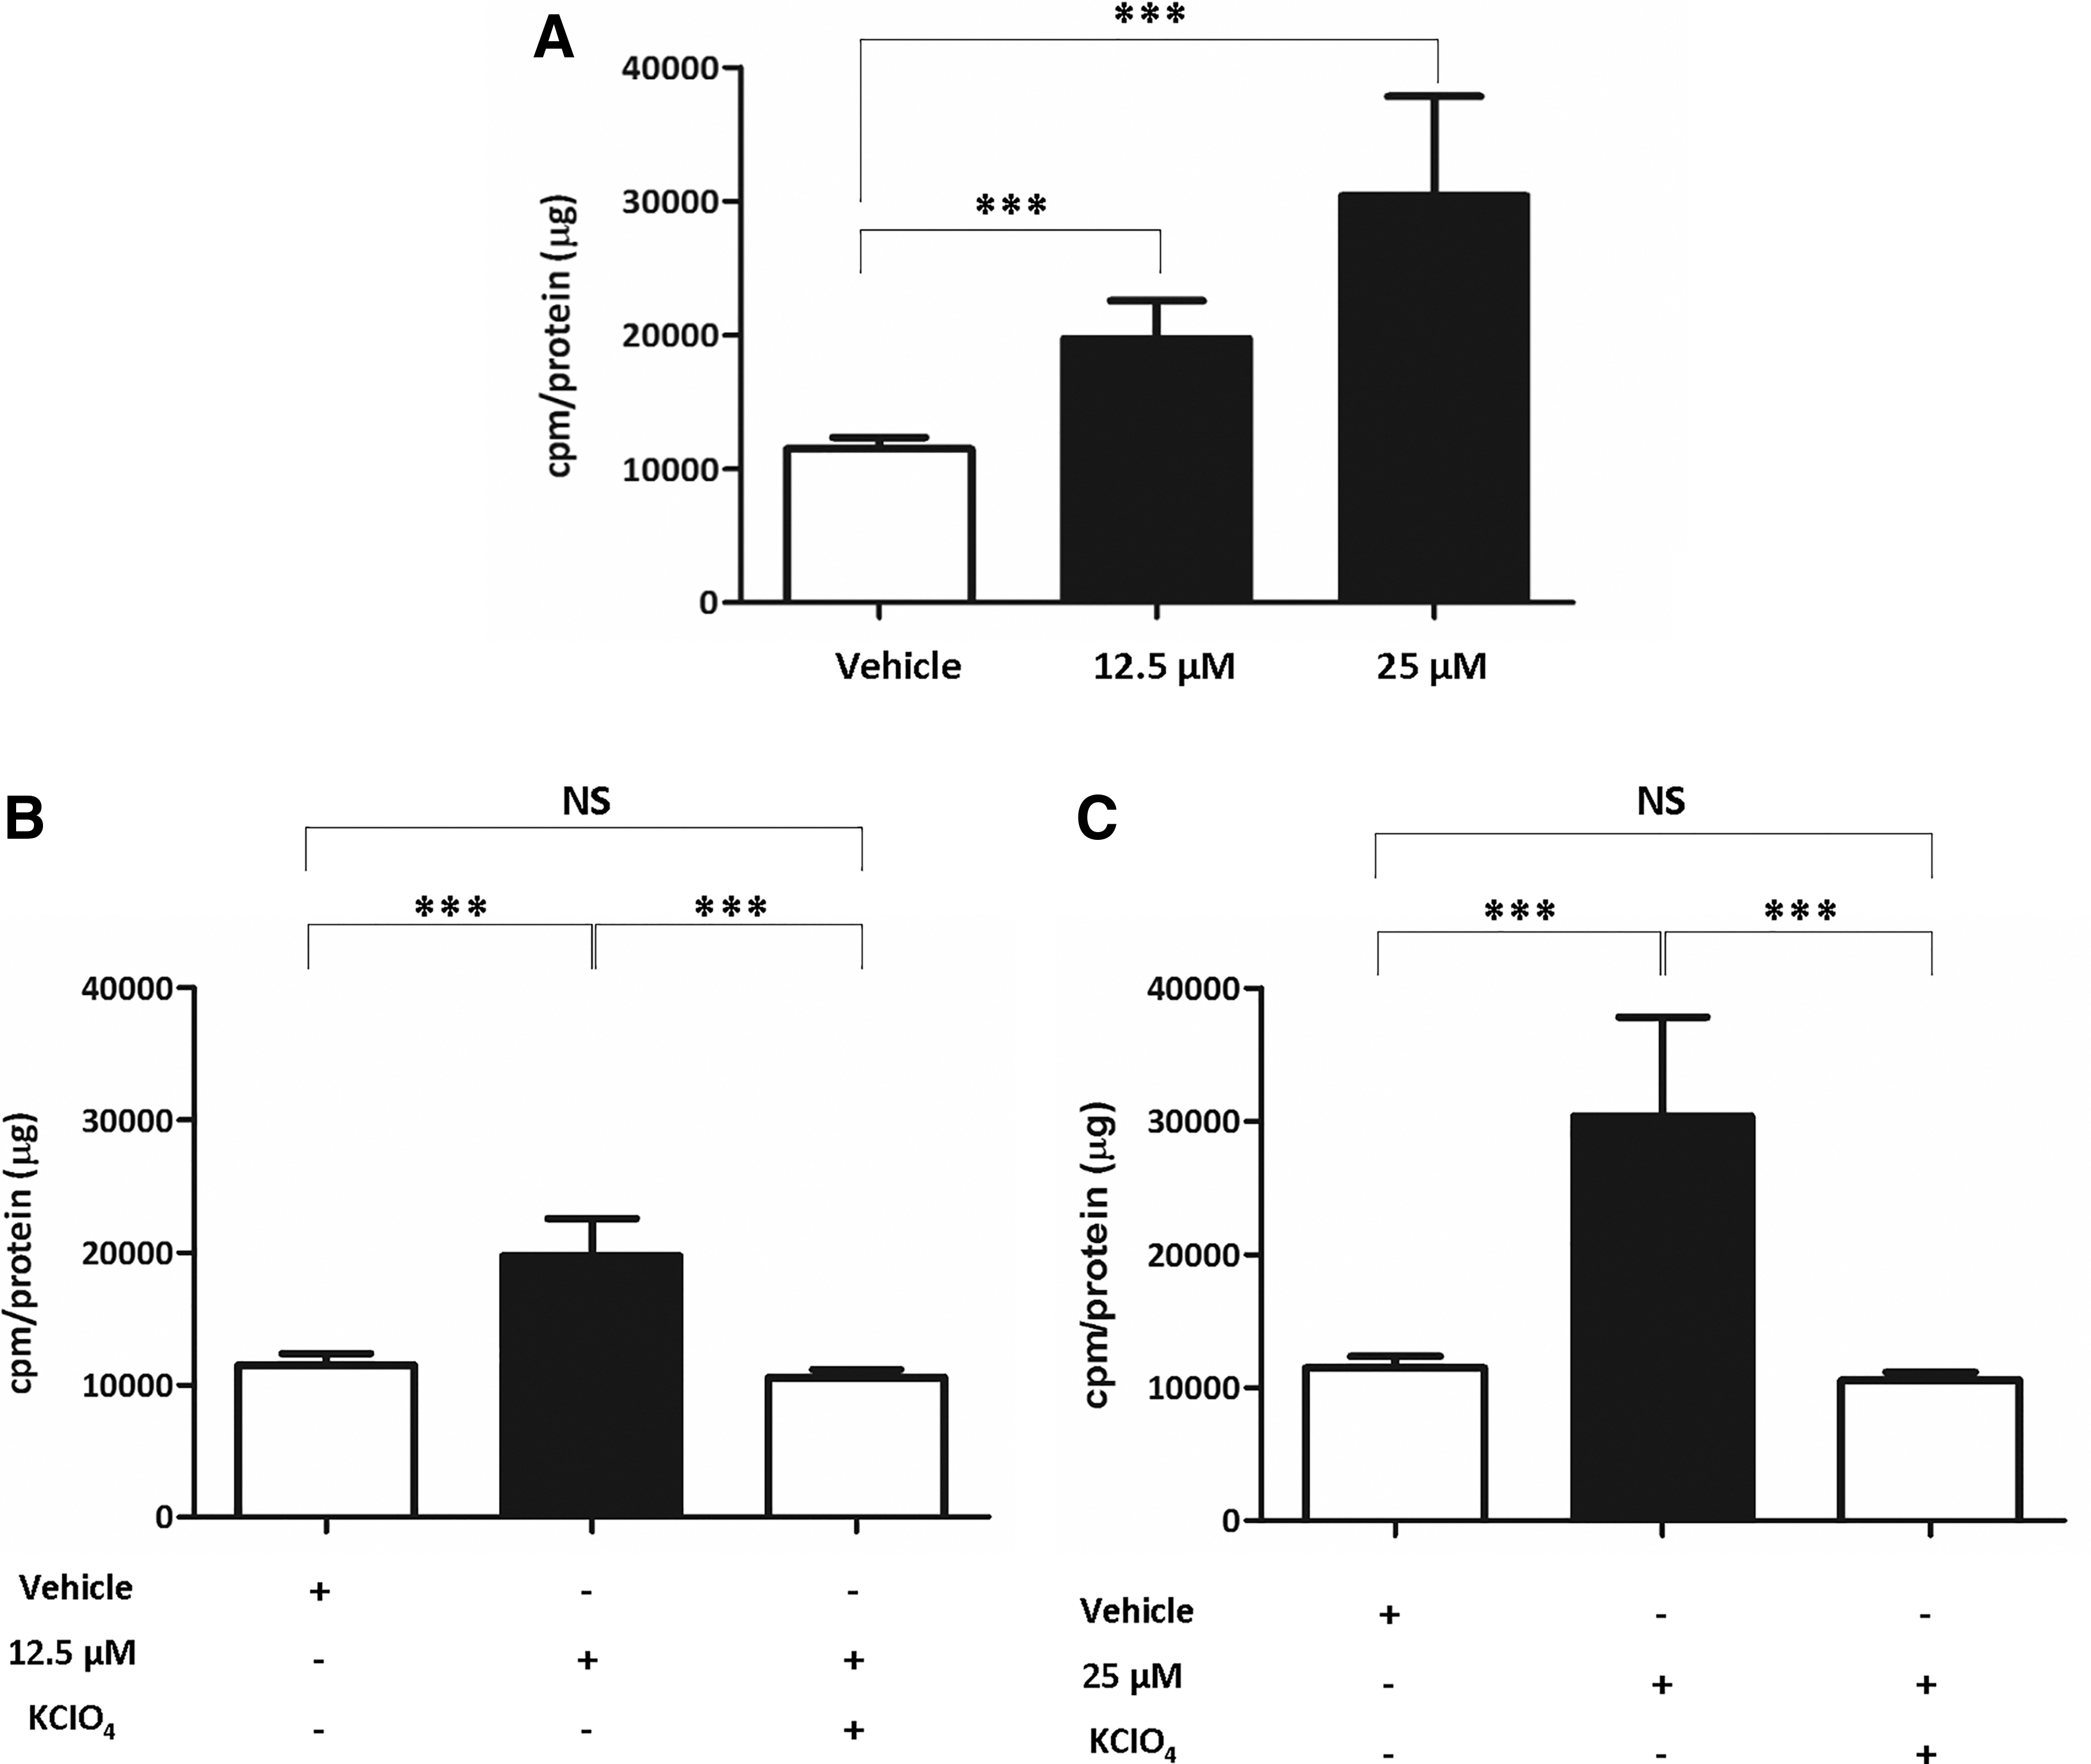
Verification of the extent of 125I accumulation in 8505C cells after CTOM-DHP treatment. Cells were treated with 12.5 or 25 μM CTOM-DHP for 72 hours and were subsequently incubated with 37 kBq carrier-free 125I and 10 μM/L sodium iodide at 37°C for 30 minutes. (
Improvement of 131I-mediated cytotoxicity effects by CTOM-DHP in 8505C ATC cells
Because iodine avidity was improved by increasing endogenous NIS expression, 131I-mediated cytotoxicity effects were evaluated using a treatment of 131I followed by CTOM-DHP pretreatment. The survival fractions (%) of vehicle-, 131I-, 12.5 μM CTOM-DHP-, and 25 μM CTOM-DHP-administered groups were 100 ± 13.08, 71.98 ± 3.68, 77.94 ± 8.17, and 77.60 ± 8.77, respectively. However, the treatment of 131I followed by 12.5 μM CTOM-DHP pretreatment caused a significant decrease in survival fraction to 52.52 ± 3.94 (Fig. 7A). Moreover, when 131I was used after 25 μM CTOM-DHP pretreatment, the survival fraction decreased further to 32.95 ± 2.27 (Fig. 7B). These findings suggest that reinduction of functional NIS and subsequent improvement in RAI uptake can be reasonable strategies for achieving favorable therapeutic outcomes with 131I.
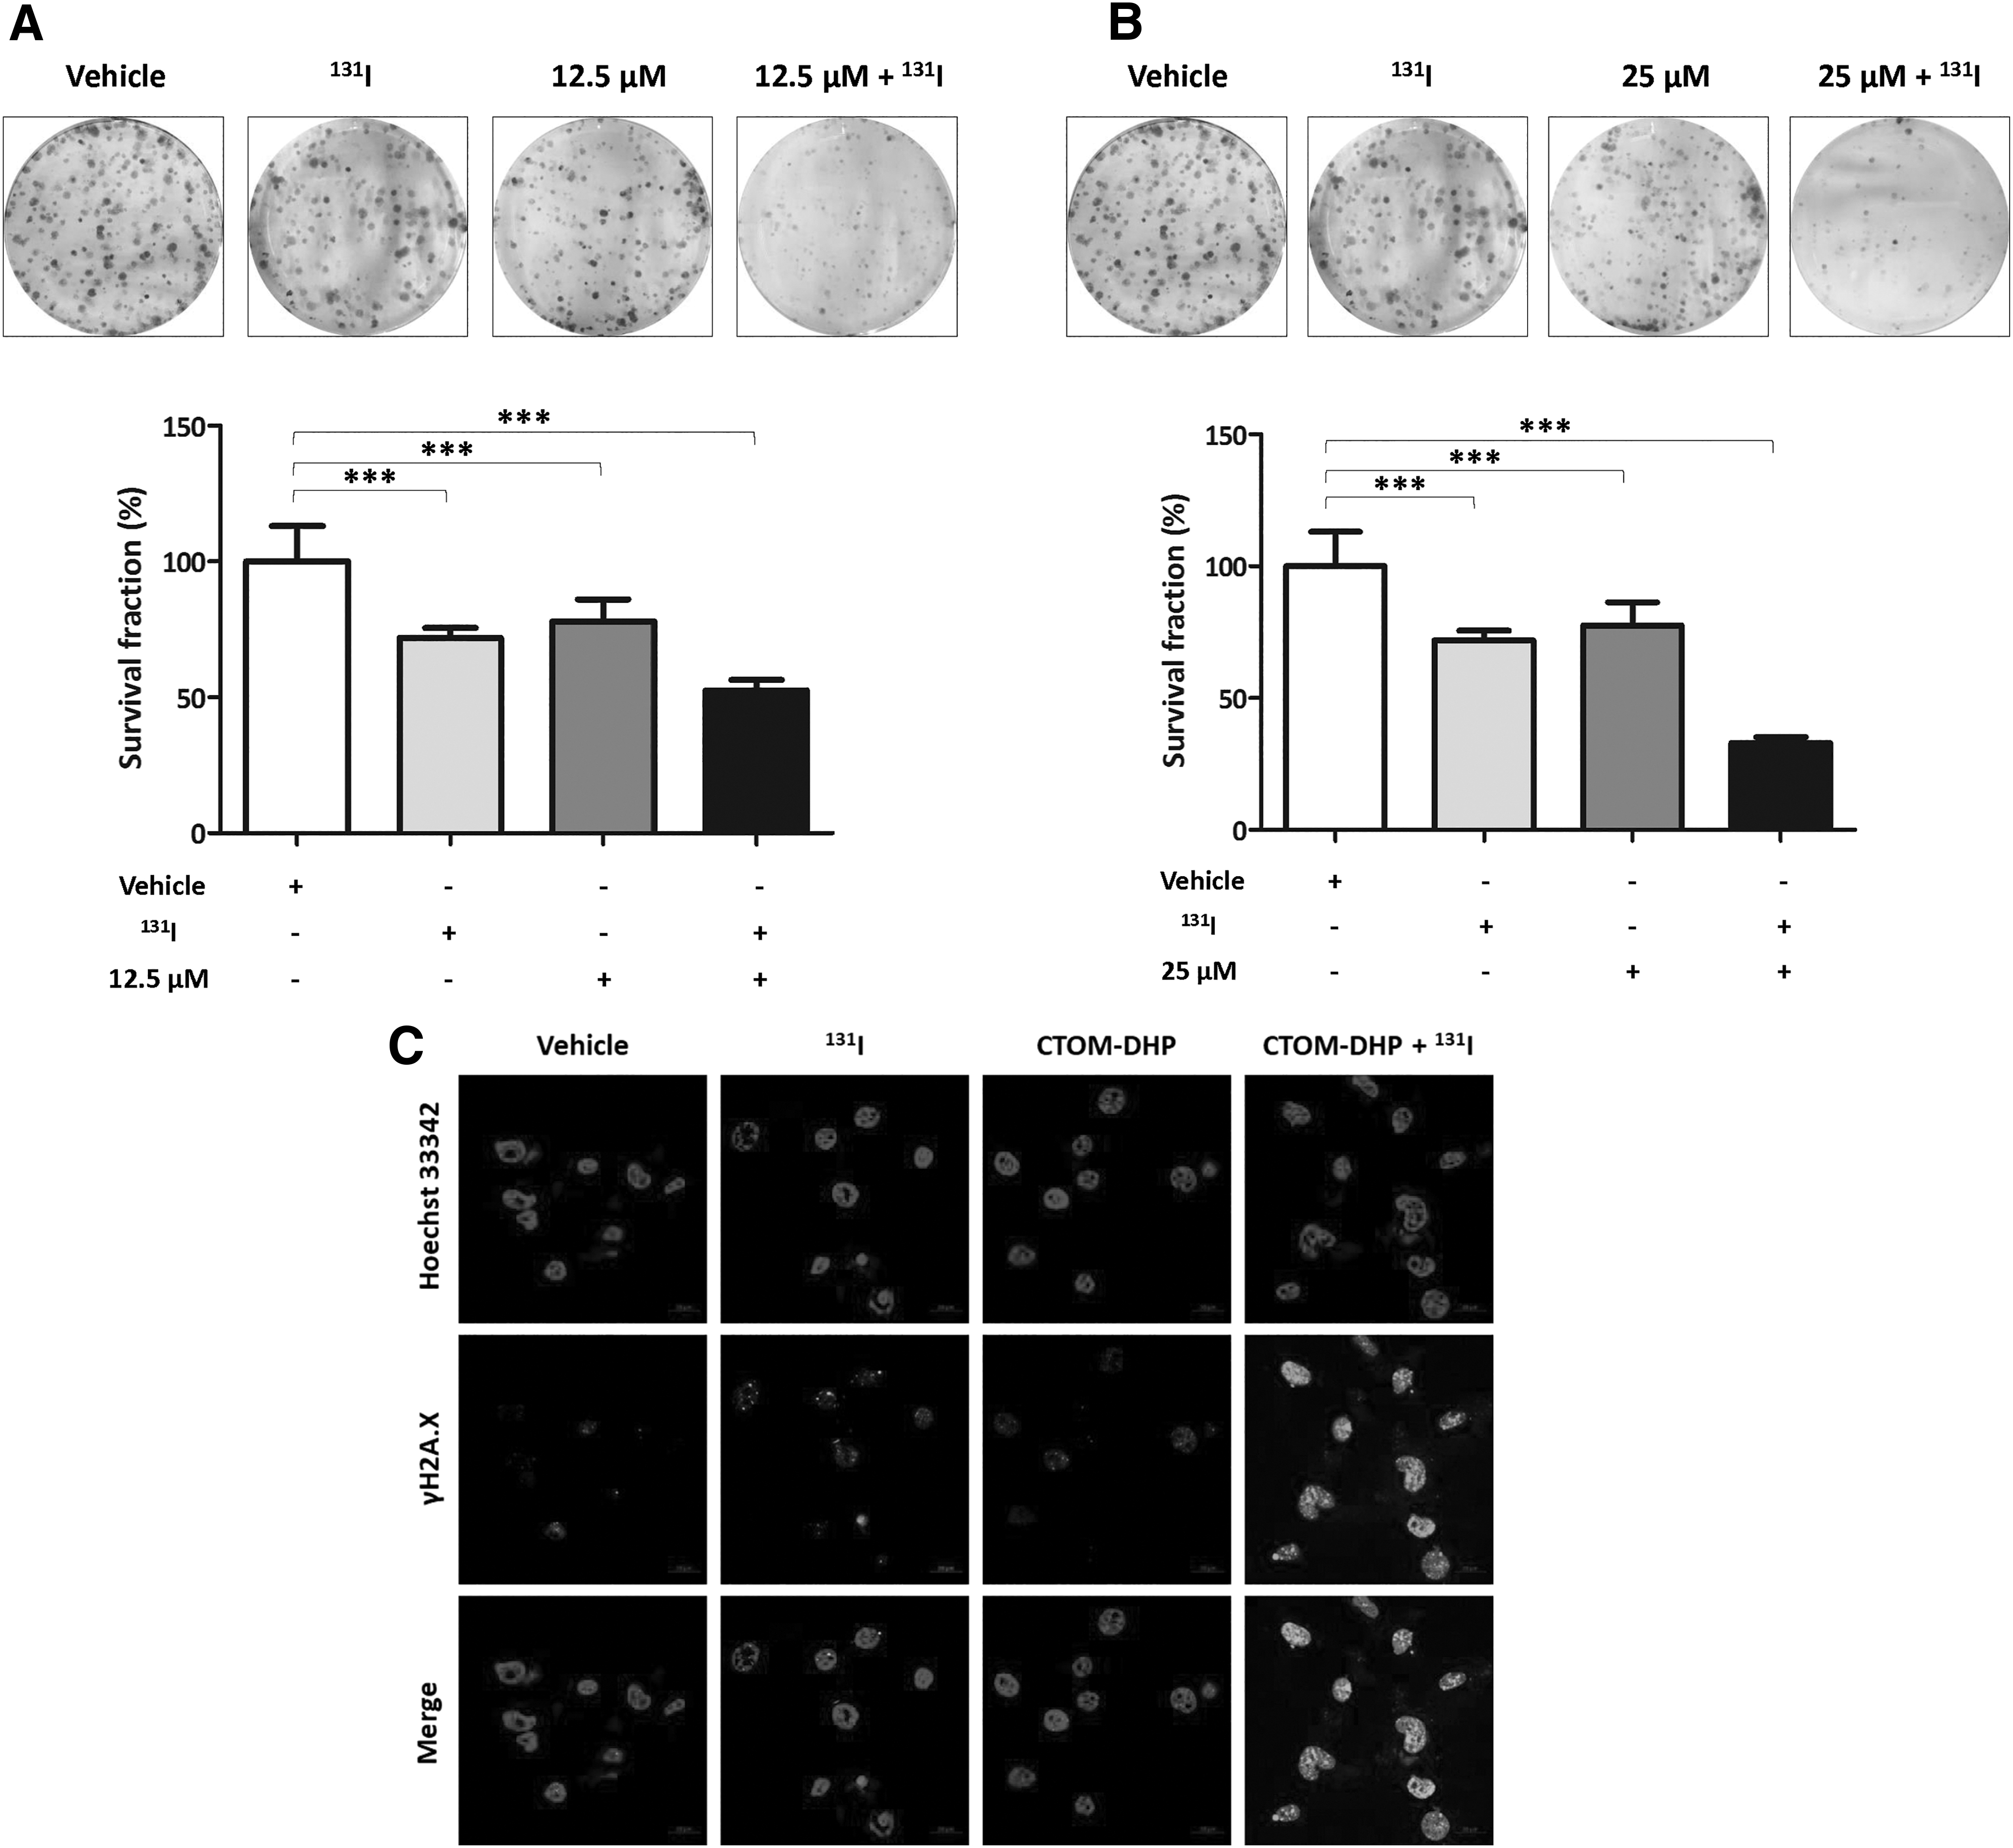
Evaluation of 131I-mediated cytotoxicity effects after CTOM-DHP pretreatment. The 8505C cells were exposed to CTOM-DHP for 72 hours. Thereafter, the cells were incubated in a 5% CO2 humidified atmosphere with or without 50 μCi/mL 131I supplemented with 30 μM NaI for 7 hours at 37°C. (
Association of DNA damage in 8505C ATC cells with CTOM-DHP and 131I treatment
After confirmation of 131I-mediated cytotoxicity effects by CTOM-DHP pretreatment, we performed a γH2A.X foci formation assay to evaluate DNA damage in the presence and absence of 131I and CTOM-DHP. As shown in Figure 7C, an increased formation of γH2A.X foci was revealed in 131I-treated cells compared with that in vehicle-administered cells. CTOM-DHP treatment also induced a slightly increased γH2A.X foci formation compared with vehicle administration. Exposure of 131I after CTOM-DHP pretreatment caused the highest increase in γH2A.X foci formation in the nucleus in comparison with γH2A.X foci formation in the other groups. These results were consistent with the results of the 131I clonogenic assay.
Increased NIS promoter activity and endogenous NIS expression after CTOM-DHP treatment in vivo
After the injection of 8505C-PNIS-PCMV cells into the right flank of mice (Fig. 8A), in vivo experiments were initiated after the average tumor volume became ∼50 mm3. To monitor the change in tumoral NIS promoter activity after CTOM-DHP administration, Fluc images were acquired in vivo on days −1, 3, 5, and 7. As shown in Figure 8B, both the vehicle-administered and CTOM-DHP–treated groups showed an increase in Fluc activity. However, the CTOM-DHP–treated group showed the highest Fluc activity. On days −1, 3, 5, and 7, Fluc activity values in CTOM-DHP–treated groups were 1.00 ± 0.00, 3.95 ± 2.76, 4.92 ± 2.16, and 8.83 ± 5.05, respectively. Contrastingly, in the vehicle-administered group, Fluc activity values on days −1, 3, 5, and 7 were 1.00 ± 0.00, 1.55 ± 1.27, 2.28 ± 1.29, and 2.11 ± 1.15, respectively. Intergroup comparisons revealed that the CTOM-DHP–treated group showed a 2-fold higher promoter activity than that shown by the vehicle-administered group on days 3 and 5. Moreover, promoter activity in the CTOM-DHP–treated group was approximately 4-fold higher than that in the vehicle group on day 7 (Fig. 8C). However, such a quantitative analysis did not take into account the tumor size. Therefore, we monitored Rluc activity to normalize tumor size after CTOM-DHP administration. As shown in Figure 8D, both the vehicle-administered and CTOM-DHP–treated groups showed an increase in Rluc activity, suggesting that CTOM-DHP treatment had a slight effect on tumor size. We normalized Fluc and Rluc activities and the results are presented as a ratio of Fluc to Rluc (Fig. 8E). No statistically significant difference in activity was seen in the vehicle-administered group between days −1, 3, 5, and 7. However, the CTOM-DHP-treated group showed a significant increase in activity; the CTOM-DHP–treated group also showed a 3.22 ± 0.97-fold increase on day 7 compared with the activity on day −1. In addition, we analyzed endogenous NIS expression in tumor tissues derived from sacrificed mice after CTOM-DHP treatment. Western blot analysis revealed that CTOM-DHP treatment of mice reinduced endogenous NIS expression in tumor xenografts (Fig. 8F). Immunohistochemistry analysis showed a tendency for increased NIS staining in the CTOM-DHP–treated group, but there was a low tendency for NIS staining in the vehicle group (Fig. 8G). These results suggest that CTOM-DHP administration restored tumoral NIS expression in a preclinical animal model.
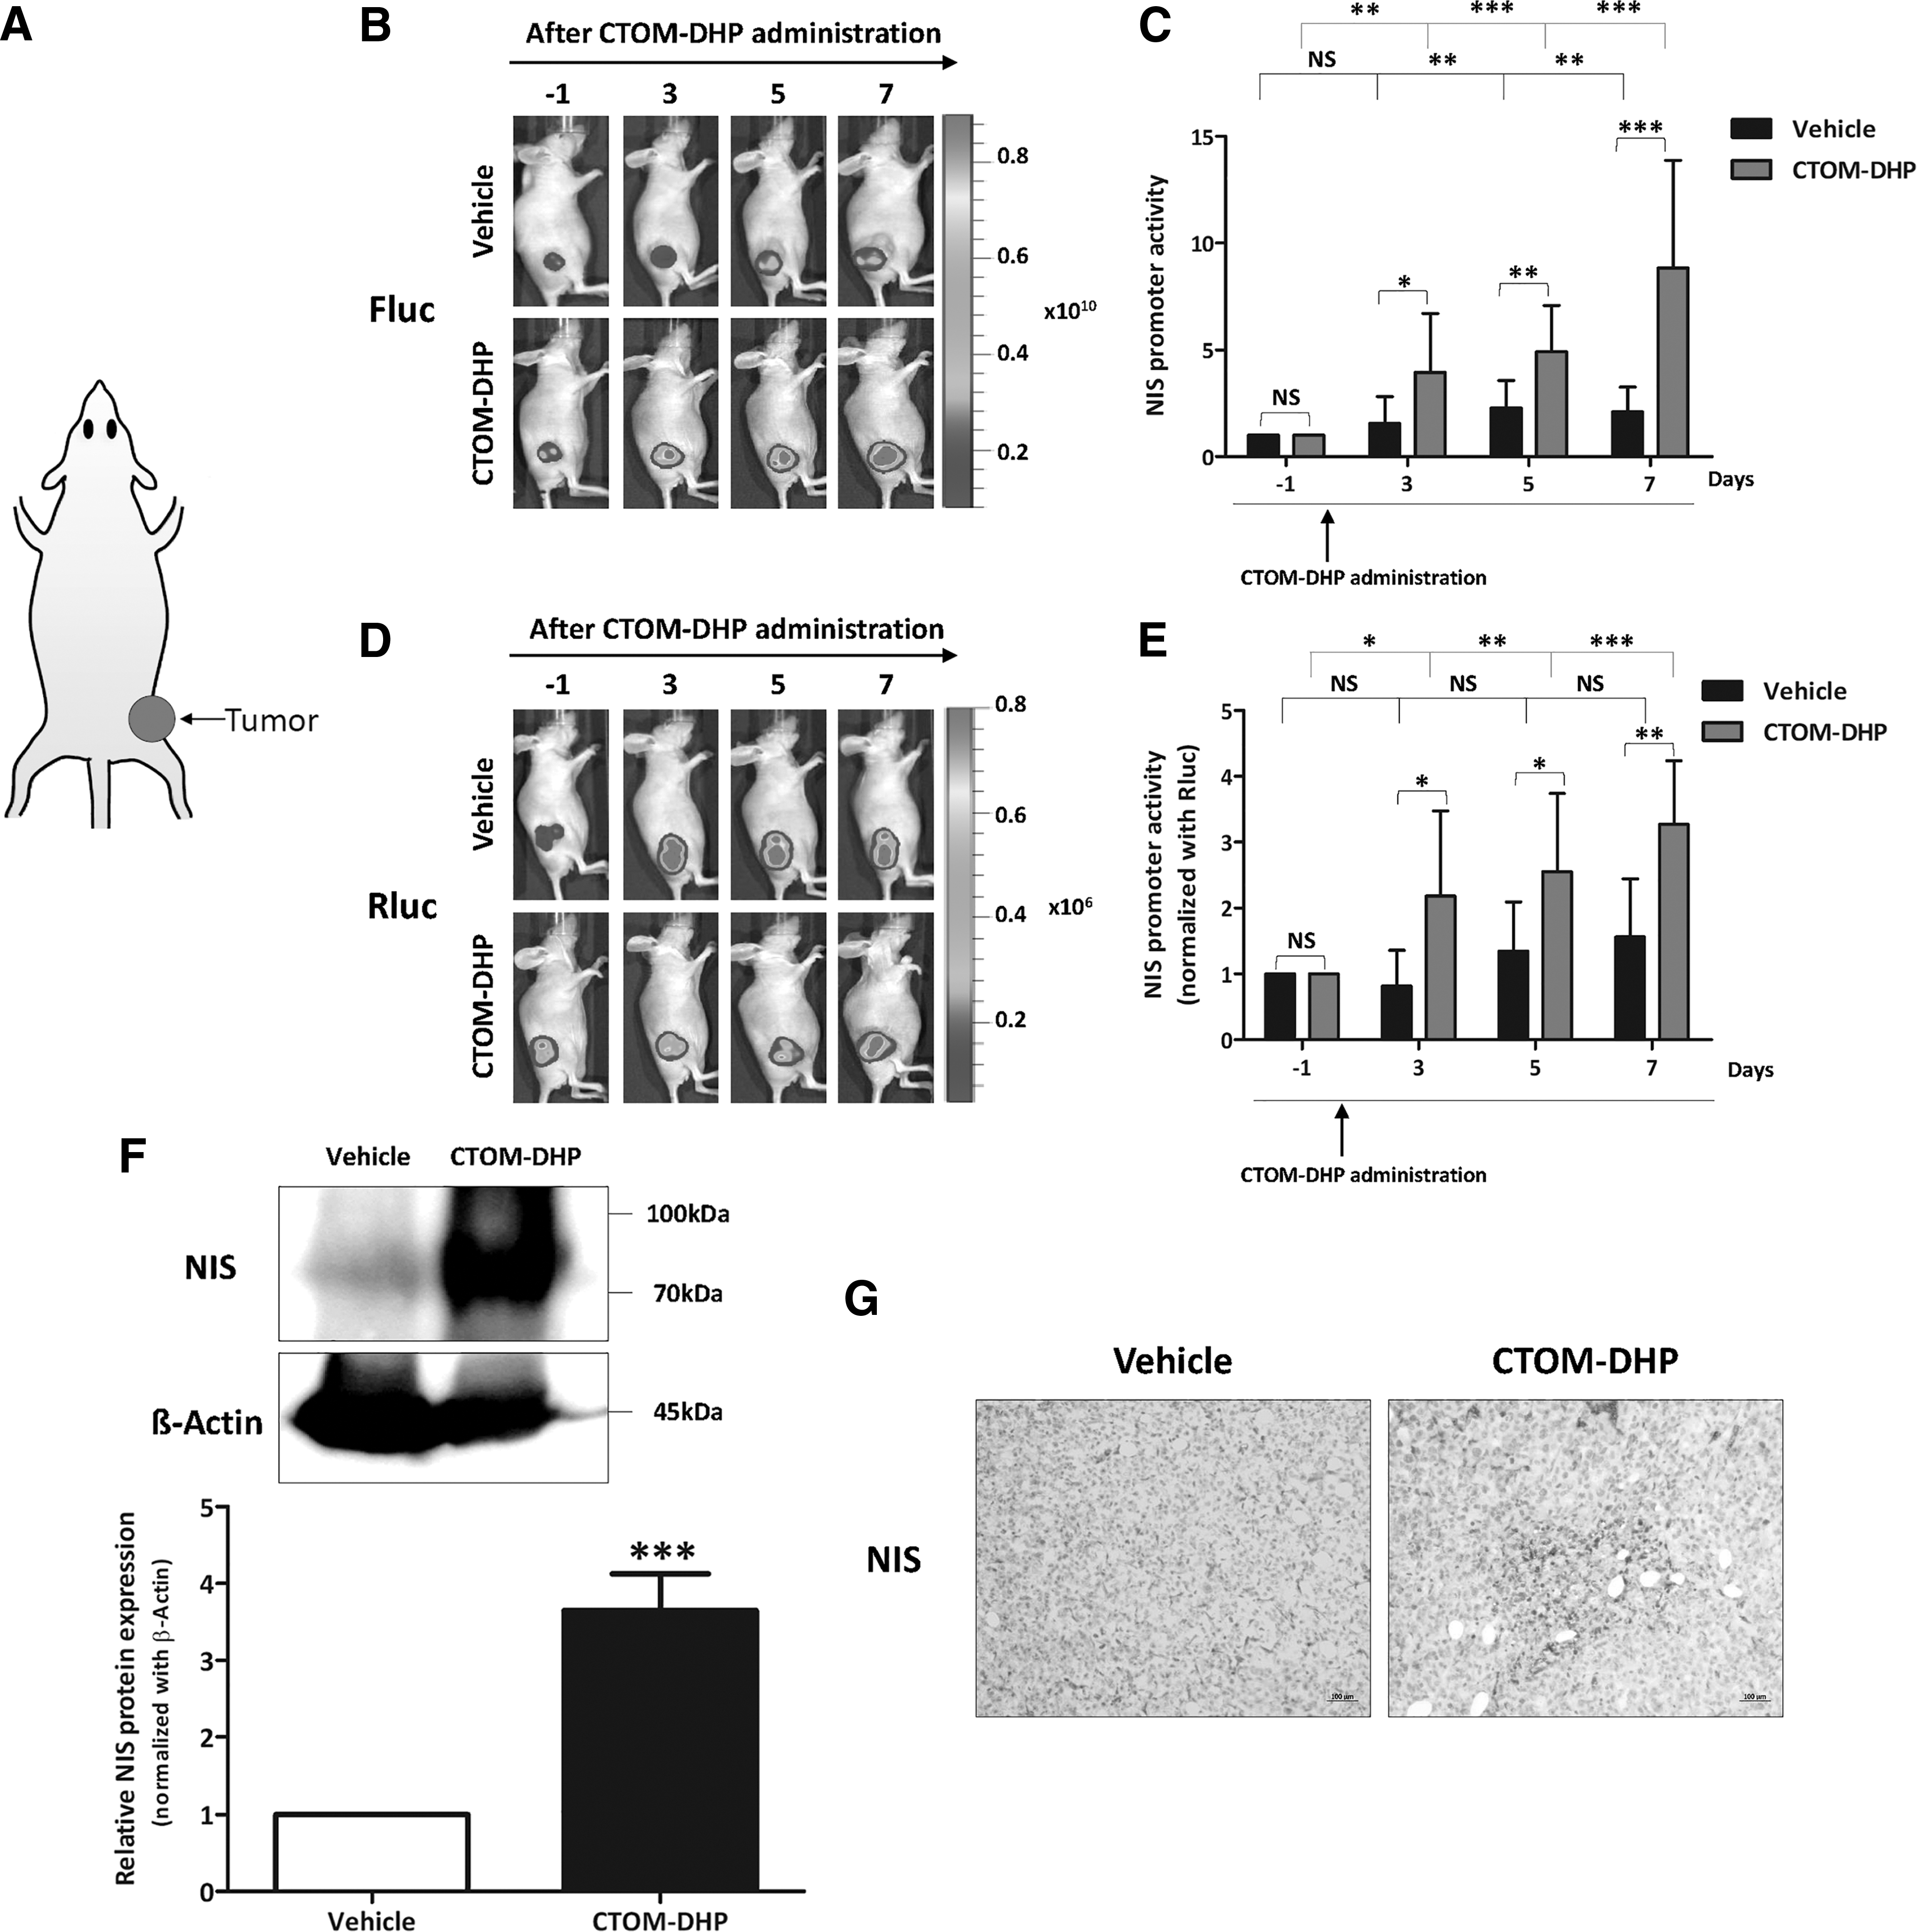
Augmentation of NIS promoter and endogenous NIS expression levels by CTOM-DHP treatment in vivo. The 8505C-PNIS-PCMV cells (5 × 10⁶) were transplanted into the right flank of mice. Representative images of 8505C-PNIS-PCMV tumor xenograft mice models obtained using BLI; 100 mg/kg of CTOM-DHP was administrated through an i.p. injection, and BLI images for determining both Fluc and Rluc expression were acquired on days −1, 3, 5, and 7. On day 7, mice were sacrificed and their tumor tissues were excised. (
Acquisition of nuclear imaging with improvement in RAI avidity owing to CTOM-DHP treatment in tumor-bearing mice
Based on the promising results pertaining to reinduction of endogenous NIS expression, 123I gamma camera imaging as well as biodistribution and autoradiography of 125I was further monitored in vivo. Before initiation of CTOM-DHP administration to mice, there was no significant difference in the tumor/contralateral ratio between the vehicle-administered and CTOM-DHP–treated groups (p = 0.1158, Fig. 9A). In vivo gamma camera images demonstrated that 123I avidity was markedly increased in tumors of the CTOM-DHP group as opposed to that in the vehicle group. Tissues in the thyroid, stomach, and bladder also observed 123I uptake owing to physiological reasons. The vehicle group showed no significant difference in the tumor/contralateral ratio between day −1 and day 7 (p = 0.5313, Fig. 9B upper right panel). However, 123I avidity significantly increased on day 7 in the CTOM-DHP–treated group (p = 0.0003, Fig. 8B lower right panel). Furthermore, consistent with the pattern seen for 123I gamma camera imaging, 125I biodistribution analysis revealed that the CTOM-DHP–treated group showed a 1.67-fold increase in 125I accumulation compared with that in the vehicle-administered group (p = 0.0431, Fig. 9C). Next, the extent of 125I avidity to tumor with or without CTOM-DHP treatment was evaluated. On visual analysis, it was found that the tumors treated with CTOM-DHP showed higher 125I accumulation than the tumors that were not subjected to CTOM-DHP treatment (Fig. 9D). Quantitative analysis also revealed that the value of PSL/mm2 increased by 1.40-fold in the CTOM-DHP group compared with the vehicle group (p = 0.0015). Taken together, these results indicate that CTOM-DHP–induced RAI avidity reverted to the basal level in the 8505C tumor xenograft mice model.
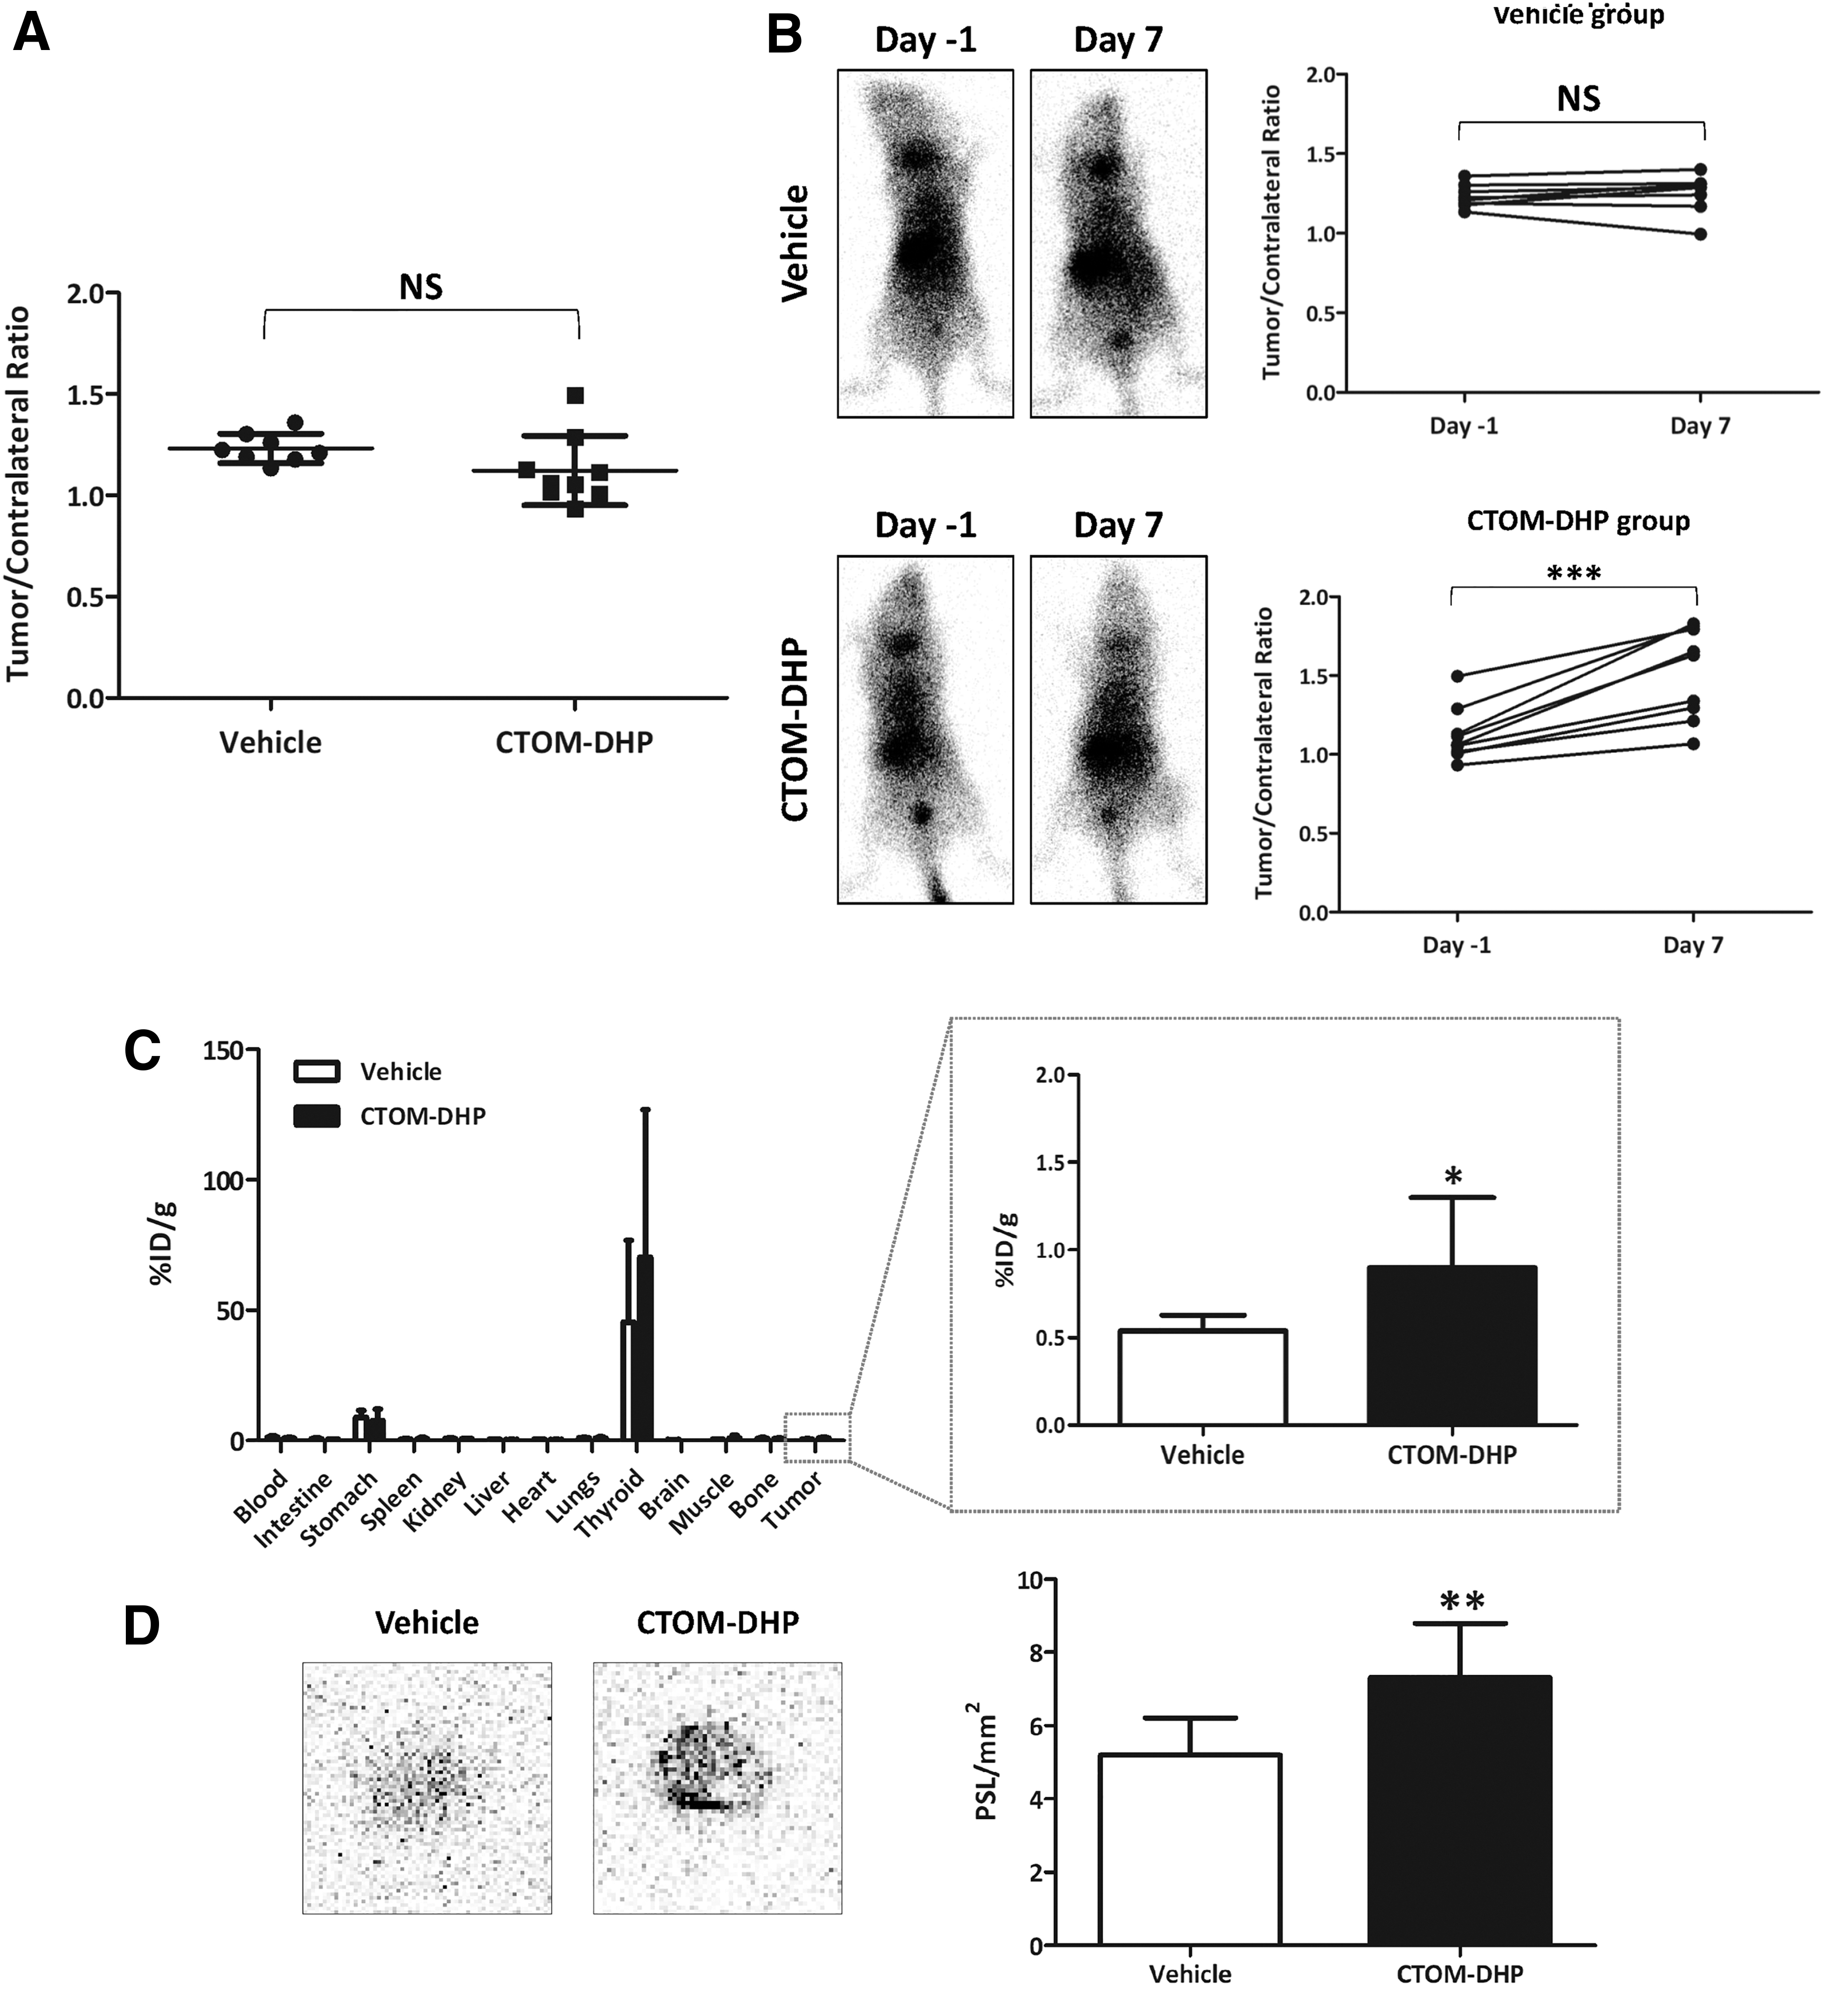
Monitoring of in vivo 123I gamma camera imaging, 125I biodistribution, and 125I autoradiography after CTOM-DHP treatment. Gamma camera images were acquired by administering an i.v. injection of 18.5–22.2 MBq 123I on day −1 and on day 7. Both 125I biodistribution and 125I autoradiography were performed after administering i.v. injection of 1.85 MBq 125I on day 8. (
Validation of the therapeutic effects of 131I after CTOM-DHP pretreatment in a tumor xenograft mice model
After verification of the restoration of endogenous NIS expression and improvement in RAI avidity in a tumor xenograft mice model owing to CTOM-DHP treatment, we examined the effects of CTOM-DHP pretreatment on 131I-mediated therapy in an animal model. We utilized Rluc activity with BLI to investigate tumor growth on days 0, 3, and 6. As shown in Figure 10A, the vehicle-administered, 131I-treated, and CTOM-DHP–treated groups showed a continuous increase in Rluc activity up to day 6. However, the combined treatment with CTOM-DHP and 131I resulted in a much lower increase in Rluc activity (Fig. 10B). In addition, treatments with 131I alone or with CTOM-DHP alone showed a slightly smaller tumor size than the tumor size in the vehicle-administered group on day 14. During the course of in vivo experiments, we investigated the side effects of treatment by measuring mouse body weight. As shown in Figure 10C, change in body weight was not different among all groups. After termination of in vivo experiments, tumor tissues from sacrificed mice were excised and analyzed. Tumors from animals in the combined CTOM-DHP and 131I-treatment group were considerably smaller than tumors from animals in other groups (Fig. 10D). Quantitative analysis revealed that the combined CTOM-DHP and 131I-treatment group had a greater than twofold lower tumor weight as opposed to the vehicle-administered group (Fig. 10E). Moreover, the average tumor weight in both the groups solely treated with 131I or CTOM-DHP was slightly lower than that in the vehicle-administered group. In addition, the average tumor weight in the CTOM-DHP–treated group was slightly lower than the average tumor weight in the 131I-treated group. The group of 131I after CTOM-DHP pretreatment showed stronger immunohistochemical staining of γH2A.X in mice tumors than in the tumors of the vehicle-administered group (Fig. 10F). The groups solely treated with 131I or CTOM-DHP also showed increased γH2A.X staining compared with the vehicle-administered group; however, the effects exerted on the single treatment groups were weaker than those exerted on the combined treatment group. Therefore, 131I after CTOM-DHP pretreatment significantly increases DNA damage in tumor xenografts, whereas singular treatments with 131I or CTOM-DHP only have a small effect on DNA damage.

Therapeutic effects of 131I treatment after CTOM-DHP pretreatment in a tumor xenograft mice model. The mice were segregated into four groups: vehicle-administered group, 131I-treated group (1 mCi Na-131I administered through an i.v. injection), CTOM-DHP-treated group (treatment with 7 doses of 100 mg/kg CTOM-DHP administered through an i.p. injection), and combination treatment group (pretreatment with 100 mg/kg CTOM-DHP for 7 days followed by 1 mCi of Na 131I administered on day 7 through i.v. injection). BLI was performed on days 0, 3, and 6 after pretreatment with 7 doses of 100 mg/kg CTOM-DHP followed by administration of 1 mCi Na 131I on day 7 through i.v. injection. On day 15, mice were sacrificed, and their tumor tissues were excised. (
Discussion
In this study, we demonstrated the efficacy of the selected CTOM-DHP in restoring endogenous NIS expression level and RAI avidity in ATC. Both reinduction of endogenous NIS expression and cell redifferentiation by CTOM-DHP treatment were achieved through blocking of the cell signaling pathways, particularly MAPK pathway. In addition, we observed an increased expression of thyroid-specific genes and proteins related to iodine metabolism. Similar to in vitro findings, our in vivo results obtained from both BLI imaging and nuclear imaging revealed the ability of CTOM-DHP treatment to restore RAI avidity in a tumor xenograft mice model. Owing to the recovery of endogenous NIS expression, 131I treatment after CTOM-DHP pretreatment exerted the strongest effect on the inhibition of thyroid cancer progression.
Membrane protein localization needs post-translational modification of proteins including phosphorylation and glycosylation (25). Production and membrane localization of NIS are important factors that determine the function of NIS (12). Several studies have reported that the negligible iodine uptake in ATC is owing to the loss of endogenous NIS expression, failure of NIS migration to the plasma membrane, or both (26,27), which, in turn, result in resistance to RAI therapy and subsequent poor survival rate.
Prevalence of genetic alterations is different among various thyroid cancer types. Therefore, in normal thyrocytes and various thyroid cancer cell lines harboring different mutations, we evaluated the change in NIS expression levels caused by CTOM-DHP treatment. Application of CTOM-DHP markedly impacted reinduction of endogenous NIS expression in KRAS G12R- and RET/PTC-mutated thyroid cancer cells. Moreover, the augmentation of NIS expression in whole BRAFV600E -mutated thyroid cancer cells was influenced by CTOM-DHP treatment. However, the degrees of reinduced NIS expression were variable depending on the cell lines, regardless of them carrying the same mutation. Notably, in our study, the amount of NIS was increased in both cytoplasmic and membrane fractions; however, this increase in NIS was higher in the membrane fraction than that in the cytoplasmic fraction. We need to further verify the accurate mechanism underlying reinduction of NIS expression and its relationship with thyroid cancer cells harboring the aforementioned mutations.
Thyroid-specific proteins and thyroid transcription factors are often impaired or lose their function in poorly differentiated or undifferentiated thyroid cancers (28 –31). Restoration of iodine avidity in thyroid cancers cannot be achieved by the expression of endogenous NIS protein alone, and cooperation of additional factors, such as other thyroid-specific proteins, is required (32). Thyroid-specific genes, including Tg, TPO, TSHR, as well as NIS, work together to accumulate and retain iodine in cells (28,33 –36). Thyroid transcription factors, such as TTF-1, TTF-2, and Pax-8, have a pivotal role in regulating the transcriptional activity in thyroid follicular cells (37 –39). In this study, we validated other factors associated with iodine metabolism in thyroid cancer after CTOM-DHP treatment and found that TPO, TSHR, Tg, Pax-8, and TTF-1 mRNA and protein levels were significantly increased. Taken together, we analogized that restoration of iodine avidity is a result of simultaneous recovery of endogenous NIS expression and enhancement of thyroid-specific factors.
The activation of MAPK signaling pathway plays an important role in the impairment of NIS-mediated iodine accumulation in thyroid cancers (18,40). BRAF mutations are regarded to be crucial in the pathogenesis of various thyroid cancers, including ATC, and are also considered potential therapeutic targets (3). Several reports demonstrated that inhibition of PI3K enhances NIS mRNA expression and improves iodine uptake in rat thyroid cells and NIS-transfected thyroid cancers (14). Moreover, Akt inhibition restores iodine uptake (41). These previous findings suggest that MAPK and PI3K/Akt signaling pathways are important for iodine uptake in RAI refractory thyroid cancers (42). Our results revealed that the MAPK signaling pathway including BRAF and ERK, rather than the PI3K/Akt signaling pathway, was markedly influenced by CTOM-DHP treatment.
The success of RAI treatment for thyroid cancers mainly relies on endogenous NIS expression and proper localization of NIS on the cytoplasmic membrane (43). In addition, proteins related to iodine metabolism play additive roles in the retention of RAI in cancer cells. Thus, we elucidated that 131I cytotoxicity was considerably augmented on a cellular level in the 131I-treated group after pretreatment with CTOM-DHP. Moreover, evaluation of the therapeutic effect of 131I after CTOM-DHP pretreatment in a tumor xenograft mouse model also revealed that the rate of tumor growth was significantly lowered. It is well known that ATC is refractory to RAI therapy owing to negligible or lack of NIS expression and its aggressiveness. This study showed limited, but promising, results for managing ATC with RAI therapy after CTOM-DHP pretreatment. To enable a successful transition in treatment strategy in clinical settings, further studies on treatments with a single TKI or a combination of TKIs might be needed to obtain optimal NIS expression and clinically meaningful therapeutic effect from RAI administration. Preclinical studies have demonstrated that redifferentiation of thyroid cancer can be accomplished by inhibiting various signaling pathways, but clinical trials so far have shown only slight or no improvement in survival (44). Owing to the difficulties associated with reinduction of endogenous NIS expression in ATC, many researchers are now focusing on redifferentiation of RAI refractory differentiated thyroid cancer or further differentiation of RAI avid differentiated thyroid cancer. Clinical trials (NCT02393690 and NCT02152995) are ongoing for enhancing RAI avidity through pharmacologic interventions for thyroid cancers. Studies are focusing toward increasing the effectiveness of RAI therapy by enhancing NIS expression through pharmacologic interventions, which might, in turn, improve survival outcome of RAI refractory thyroid cancer patients who still lack adequate treatment options (13,45). We believe that this newly identified TKI, CTOM-DHP, can also be used in similar other studies likely conducted in the future.
Conclusions
Our findings demonstrate that CTOM-DHP treatment is effective at restoring endogenous NIS expression in ATC cells. Furthermore, the therapeutic effect of 131I was considerably improved by CTOM-DHP pretreatment, both in vitro and in vivo. These results suggest that pharmacologic intervention with this TKI may convert RAI refractory thyroid cancer into a RAI-sensitive thyroid cancer.
Footnotes
Acknowledgments
The chemical library used in this study was kindly provided by Korea Chemical Bank of Korea Research Institute of Chemical Technology.
Author Disclosure Statement
No competing financial interests exist.
Funding Information
This study was supported by a grant of the Korea Health Technology R&D Project, Ministry of Health & Welfare, Republic of Korea (Grant Number: HI16C1501) and also by Basic Science Research Program through the National Research Foundation of Korea (NRF) funded by the Ministry of Education (NRF-2019R1I1A3A01059909).
Supplementary Material
Supplementary Figure S1
Supplementary Figure S2
Supplementary Table S1
Supplementary Table S2