
Abstract
Background:
Resistance to thyroid hormone alpha (RTHα) is a rare genetic disease due to mutations in the THRA gene, which encodes thyroid hormone receptor alpha 1 (TRα1). Since its first description in 2012, 46 cases of RTHα have been reported worldwide, corresponding to 26 different mutations of TRα1. RTHα patients share some common symptoms with hypothyroid patients, without significant reduction in thyroid hormone level. The high variability of clinical features and the absence of reliable biochemical markers make the diagnosis of this disease difficult. Some of these mutations have been recently modeled in mice.
Methods:
In our study, we used four different mouse models heterozygous for frameshift mutations in the Thra gene. Two of them are very close to human mutations, while the two others have not yet been found in patients. We characterized the metabolic phenotypes of urine and plasma samples collected from these four animal models using an untargeted nuclear magnetic resonance (NMR)-based metabolomic approach.
Results:
Multivariate statistical analysis of the metabolomic profiles shows that biofluids of mice that carry human-like mutations can be discriminated from controls. Metabolic signatures associated with Thra mutations in urine and plasma are stable over time and clearly differ from the metabolic fingerprint of hypothyroidism in the mouse.
Conclusion:
Our results provide a proof-of-principle that easily accessible NMR-based metabolic fingerprints of biofluids could be used to diagnose RTHα in humans.
Introduction
Thyroid hormones (TH: thyroxine [T4]; triiodothyronine [T3]) exert a broad influence on development and homeostasis (1). The nuclear receptors called thyroid hormone receptor alpha 1 (TRα1), TRβ1, and TRβ2 are T3-dependent transcription factors. They are encoded by the THRA and THRB genes, which are expressed in many cell types (2). Mutations of these genes cause two distinct genetic diseases, respectively, called resistance to thyroid hormone alpha (RTHα) and RTHβ, characterized by tissue resistance to TH in patients heterozygous for missense and frameshift mutations. Because THRA and THRB have different expression patterns and properties, the two genetic diseases have different outcomes (3 –5). In RTHβ, the feedback regulation of the hypothalamus/pituitary/thyroid axis is impaired resulting in an increase in serum T3 and thyrotropin (TSH) content. Patients with RTHβ have been found in more than 400 families (6), and sporadic cases are usually recognized when it appears that a treatment with pharmacological doses of thyroxine is unable to normalize the TSH level.
By contrast, RTHα has been reported in 2012 only, the first case being discovered by exome sequencing (7). Up to now, only 46 cases, all heterozygous, have been reported in 26 different families (3,8,9). All known mutations alter the ligand-binding domain of the receptor. While some missense mutations only reduce the affinity of TRα1 for T3, other missense and frameshift mutations modify or eliminate the C-terminal helix 12, preventing the recruitment of coactivators. This turns TRα1 into a constitutive transcription repressor, with dominant-negative properties, explaining the genetic dominance of the disease. The apparent rarity of RTHα probably stems from the difficulty of diagnosis. The genetic disease resembles congenital hypothyroidism, with variable and sometimes severe manifestations, including short stature and mental retardation, but without specific signs and symptoms or biochemical alterations. T4, T3, and TSH levels usually remain within the reference range, although a low T4/T3 ratio is frequent. The inability to quickly recognize patients with RTHα is regrettable because the developmental consequences of the disease can be greatly reduced by an early therapeutic intervention, notably when helix 12 is intact. Motor skills and body growth have been restored in a young patient treated with an excess of thyroxine to overcome tissue resistance (10). Two adult patients with normal adult stature also received thyroxine treatment during childhood by chance (11).
Metabolomic profiling has proven to be useful in diverse fields, including in diagnostics (12,13). Two technologies are used to analyze metabolic profiles: nuclear magnetic resonance (NMR) spectroscopy and mass spectrometry. NMR is less sensitive, but robust, and probably more suitable for future routine use in clinics (14). In this work, we exploit a series of mouse models of RTHα, which have recently been characterized (15) to assess the capacity of 1H-NMR analysis of body fluids to recognize the presence of Thra mutations. Our data suggest that this method is a promising strategy for RTHα diagnostics in humans.
Materials and Methods
Animals
The research project was approved by a local ethics committee and subsequently authorized by the French Ministry of Research (license #6711), and carried out in accordance with the European Community Council Directives of September 22, 2010 (2010/63/EU), regarding the protection of animals. Four mouse models were used (ThraS1/+ , ThraS2/+ , ThraL1/+ , ThraL2/+ ) heterozygous for a Thra mutation created by CRISPR/Cas9 editing (15). Their genetic background had a major contribution of the C57Bl/6 strain. Wild-type male littermates without mutation were used as controls.
Hypothyroidism was induced by giving solid food containing propyl-thio-uracil to 7-week-old mice for a duration of 14 days to prevent TH production. We verified that this treatment results in sixfold reduction in the circulating level of T3. In one group of mice, T3 treatment was performed for the last four days of propylthiouracil (PTU) treatment using daily intraperitoneal injections (20 mg/kg/day T3 + 200 mg/kg/day T4). The study was performed on 29 C57BL/6J male mice (9 hypothyroid mice, 10 hypothyroid mice that received TH, and 10 control).
Sample collection
Eighty-eight male mice (12 ThraS1/+ , 10 ThraS2/+ , 10 ThraL1/+ , 12 ThraL2/+ , and 44 wild-type littermates) were followed for six months. Urine samples were collected at three and six months of age, and plasma samples were collected in heparin-coated tubes at six months. All samples were stored at −80°C until NMR analysis. Urine samples were thawed at room temperature and then centrifuged for five minutes at 5000 g. Two hundred microliters of the supernatant was mixed with 300 μL of water and 50 μL of buffer solution (1.5 M KH2PO4, 2 mM NaN3, 0.1% trimethylsilyl propionate (TSP) pH 7.4 in D2O). Five hundred fifty microliters of the mixture was then transferred into a 5 mm NMR tube. Plasma samples were thawed at room temperature. Coagulated particles were removed by centrifugation at 5000 g during five minutes. Two hundred microliters of the liquid phase was mixed with 100 μL of water and 300 μL of buffer (0.142 M Na2HPO4, 0.1% NaN3, 0.1% TSP, pH7.4, in 20% D2O).
NMR spectroscopy
All NMR experiments were performed on a Bruker Avance III spectrometer operating at 600 MHz (proton resonance frequency) equipped with a 5 mm TCI cryoprobe, and a cooled sample changer (4°C). The temperature was controlled at 27°C for urine samples and 37°C for plasma samples. Standard one-dimensional 1H-NMR spectra were acquired with the “noesygppr1d” pulse sequence for each urine and plasma sample. A total of 128 transient free induction decays (FIDs) were collected for each experiment with a spectral width of 20 ppm. The acquisition time was set to 1.5 seconds with a relaxation delay of 2 seconds. The noisy mixing time was set to 10 ms. All FIDs were multiplied by an exponential function corresponding to a 0.3 Hz line-broadening factor, before Fourier transformation. 1H urine spectra were referenced to the TSP signal (δ = −0.016 ppm at pH 7.4), and plasma samples were calibrated with respect to the α-glucose anomeric proton signal (δ = 5.23 ppm). Spectra were manually phased and corrected for baseline using Topspin 3.5 (Bruker). A data matrix was extracted from 1H-1D-NMR profiles for multivariate statistical analysis using the Statistics toolbox of AMIX (Bruker). Spectra were integrated from 0.5 to 9.5 ppm at a step of 0.001 ppm, excluding the region of residual water at 4.72–4.92 ppm for urine and 4.4–5.05 ppm for plasma. Icoshift correction was applied to perform an alignment of peaks within manually set chemical shift ranges only for urine samples. To reduce the effect of dilution, the probabilistic quotient normalization method was implemented for urine samples (16). Plasma samples were normalized on their total sum of intensities. An additional series of quality control samples for each biofluid was included to evaluate the quality and the reproducibility of the NMR data acquisition.
In addition, 1D 1H-NMR CPMG and 2D NMR experiments (1H–13C HSQC, 1H–1H TOCSY, and 1H J-resolved experiments) were recorded on a subset of samples to achieve structural assignment of the metabolite signals. Metabolite identification was performed using academic spectral databases [HMDB (17) and MMMDB (18)], as well as proprietary databases (NMR Suite v. 7.1, Chenomx, Inc., Edmonton, Canada; BBIOREFCODE, Bruker GmbH).
Statistical analysis
Unsupervised and supervised statistical multivariate analyses were conducted to build models for sample classification and to extract group-specific metabolic signatures. Orthogonal partial least-square discriminant analysis (OPLS-DA) (19,20) was performed for sample class discrimination using SIMCA 1 (Umetrics, Umea, Sweden) with variables scaling according to the Pareto method. The goodness-of-fit parameters R2 and Q2, which relate to the explained and predicted variances, respectively, were used to evaluate OPLS-DA model performance. Resampling the models under the null hypothesis was then performed 1000 times to validate model performance (21). Analysis of variance (ANOVA) of the cross-validated residuals' (CV-ANOVA) p-value was also used to assess the significance of the models. Univariate ANOVA (22) coupled with Hochberg–Benjamini correction of the p-value was used on clusters of variables, which were obtained from the automated binning procedure named statistical recoupling of variables (23).
Results
Metabolomic analysis segregates two types of frameshift mutations
We studied four mutations of Thra (15), which introduce a translation frameshift, eliminating the C-terminal helix, which normally interacts with transcription coactivators (Fig. 1A). E395fs401X and E395fs406X mutations are +1 frameshifts, introducing stop codons few nucleotides downstream to the mutated codon, and shortening the protein (ThraS1/+ and ThraS2/+ mice; S for small) as in some severe cases of RTHα found in patients. This results in a complete loss of transactivation capacity and a marked dominant negative activity in heterozygous mice. These mutations do not modify the circulating level of T4, and only slightly increase the T3 level. However, due to tissue resistance, they cause alterations of development reminiscent of hypothyroidism (15). The two other mutations, E395fs485X and K389fs479X, are +2 frameshifts, which have no known equivalent in human patients, and result in the production of an amphigoric protein of high molecular weight (ThraL1/+ and ThraL2/+ mice; L for large), which has little dominant negative activity. Extensive phenotype analysis (15) previously showed that ThraS1/+ and ThraS2/+ mice display several developmental traits present in RTHα patients, while ThraL1/+ and ThraL2/+ mice have an almost normal phenotype.
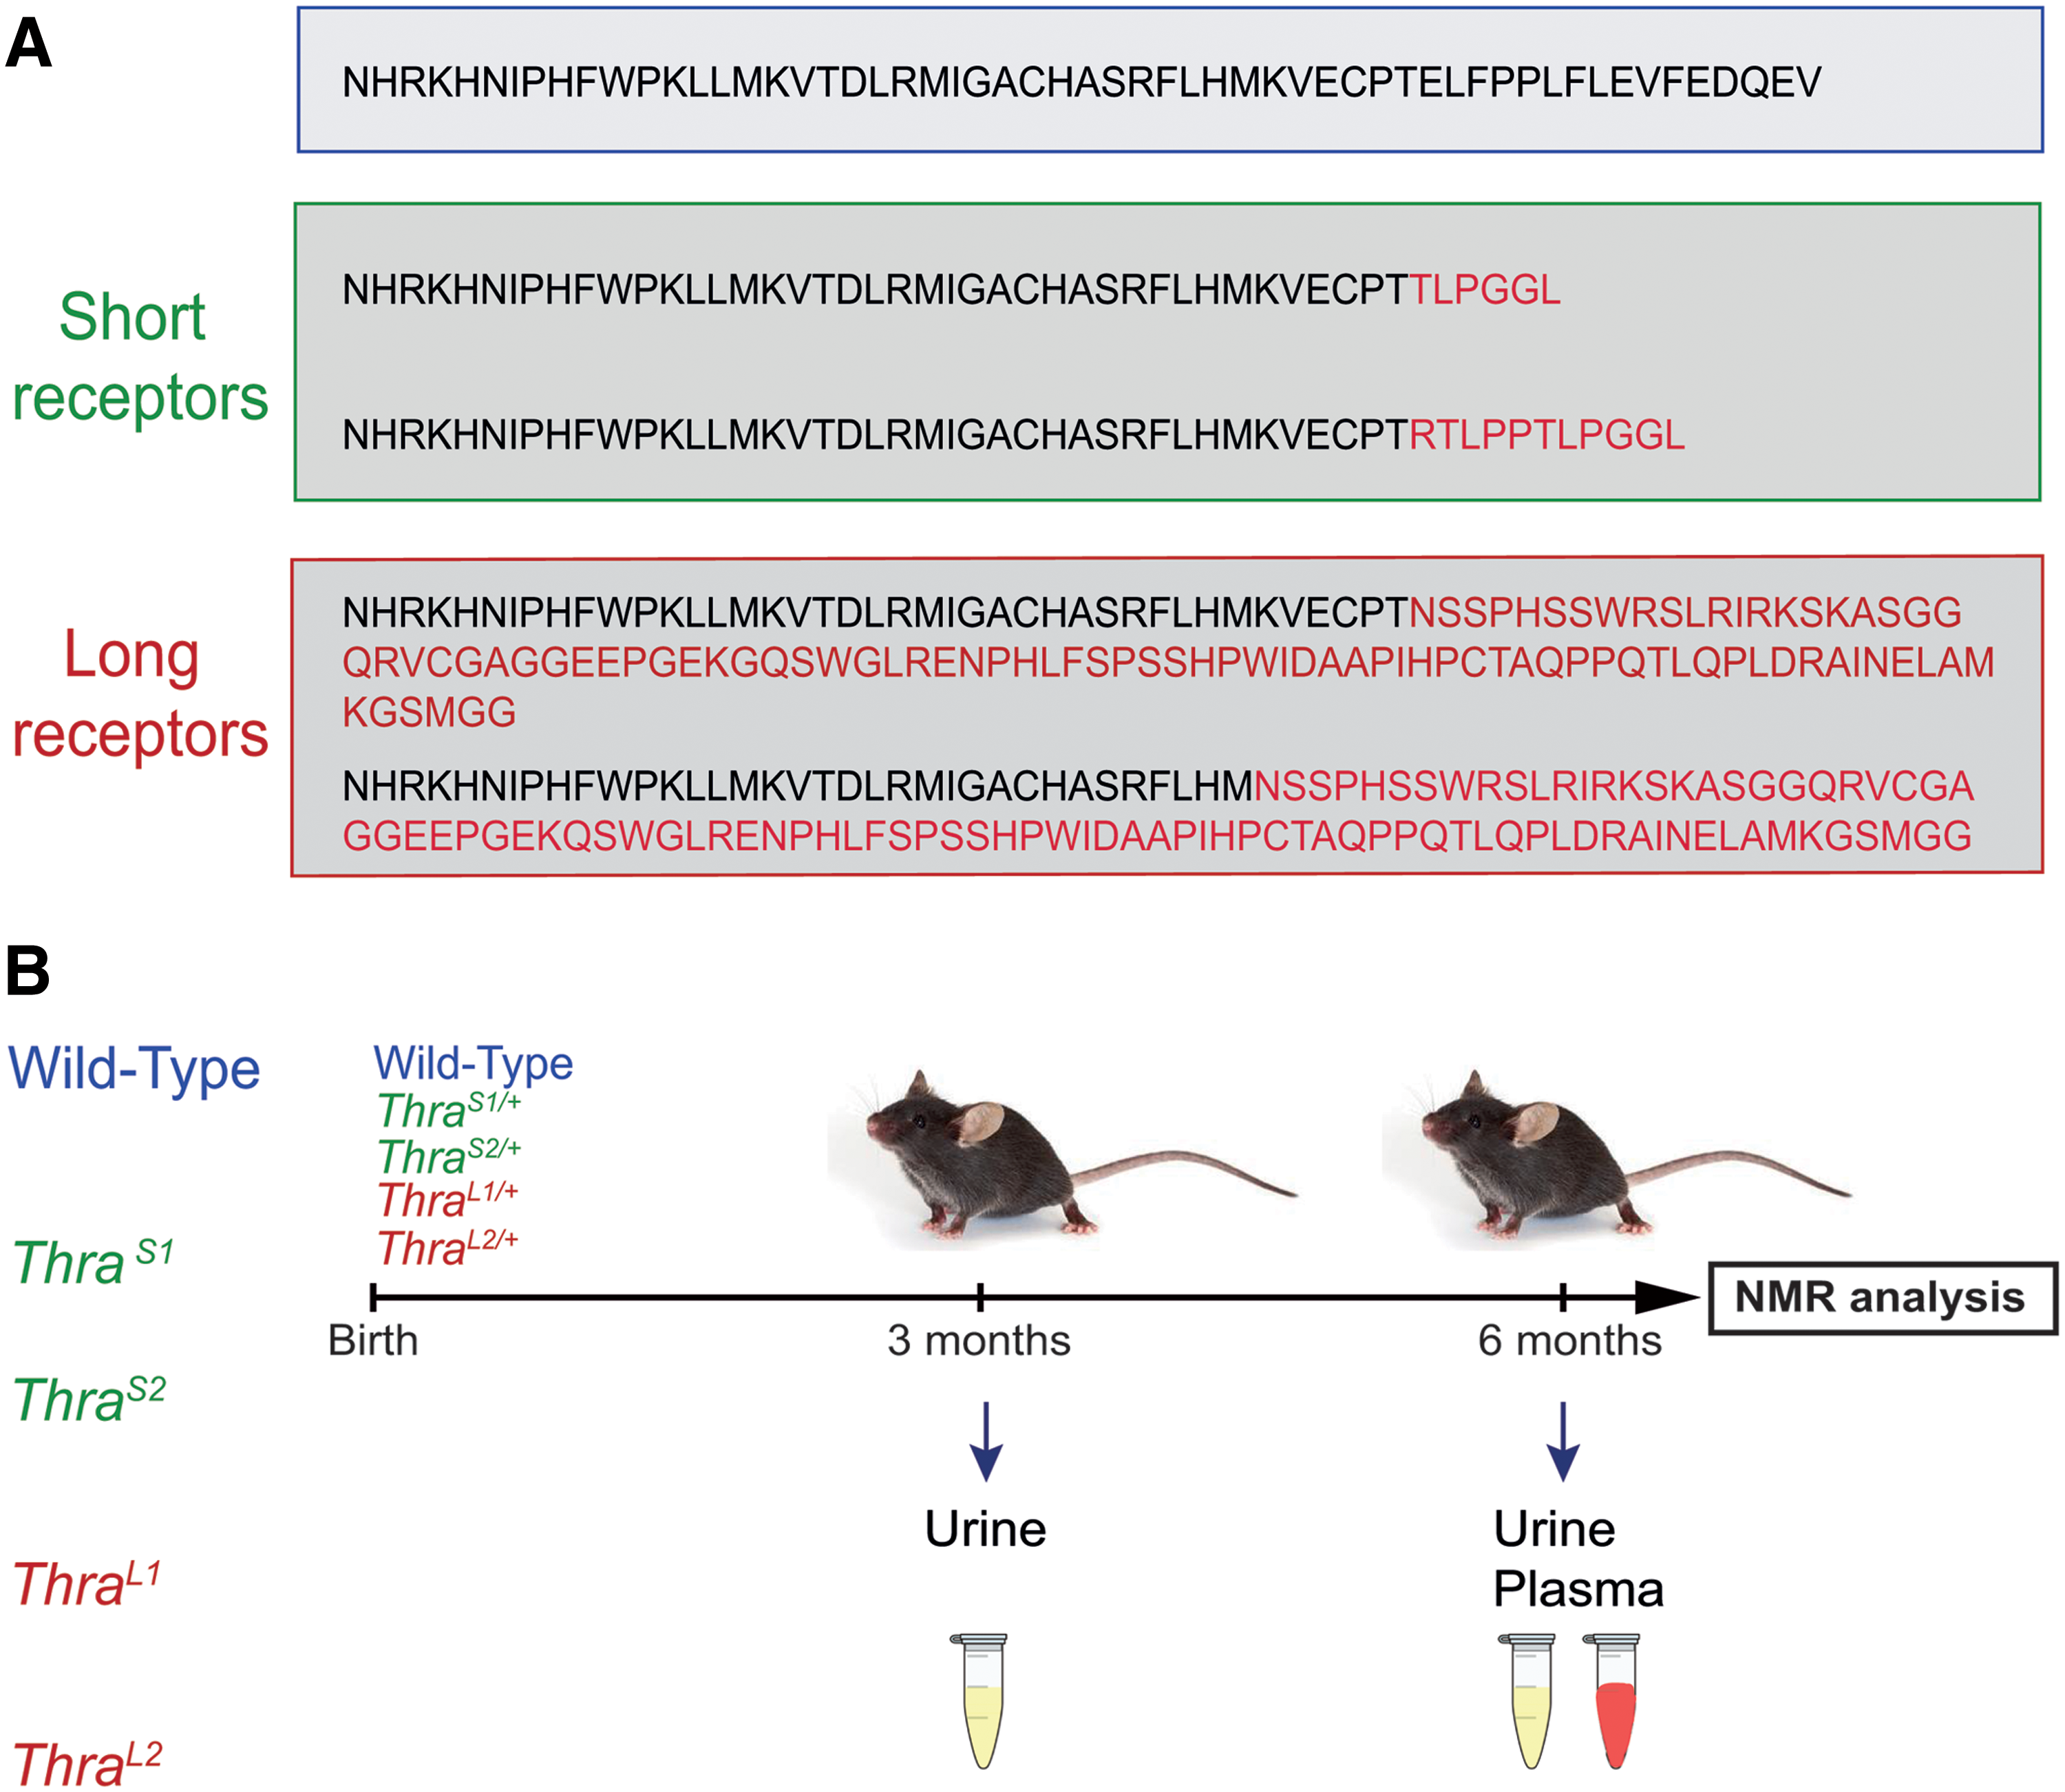
Experimental design.
Mice urine was collected at two time points (three and six months old), and blood at six months (Fig. 1B). Wild-type littermates without mutation were used as controls. 1H-NMR spectra were recorded, providing for each sample of biofluid a complex metabolic profile of urine and plasma, where 47 and 32 metabolites can be unambiguously identified, respectively (Supplementary Fig. S1).
We first asked whether the four groups of mutant mice could be considered a single group in subsequent statistical analysis, or whether different mutations should be considered separately. We thus addressed whether metabolic profiling could differentiate ThraS1/+ , ThraS2/+ , ThraL1/+ , and ThraL2/+ mice. A four-class OPLS-DA of the metabolic profiles was performed to evaluate the impact of the different Thra mutations on urine metabolome (Fig. 2A). Although the four groups were not separated, we noted that mutants with short receptors (ThraS1/+ and ThraS2/+ ) were clustered in this statistical model as are mutants with long receptors (ThraL1/+ and ThraL2/+ ), and that the two groups tend to separate. Within each group, a new OPLS-DA was unable to discriminate between the two mutations (ThraL1/+ from ThraL2/+ mice, and ThraS1/+ from ThraS2/+ mice, in both urine and plasma; data not shown). As no clear discrimination was observed, we pooled the mutant mice according to the type of frameshift mutation they carry (ThraL/+ group and ThraS/+ group), and repeated OPLS-DA. This improved the statistical power of the analysis and led to a clear distinction between these two groups (Fig. 2B, C). Statistical significance of these models was assessed by high values of goodness-of-fit parameters R2 and Q2 (which explain the variance and predictive power of the model, respectively) and CV-ANOVA p-values <0.05 and model resampling under the null hypothesis (Supplementary Fig. S2). Altogether, these results show a clear distinction between ThraL/+ and ThraS/+ mice, as expected from previous phenotyping.
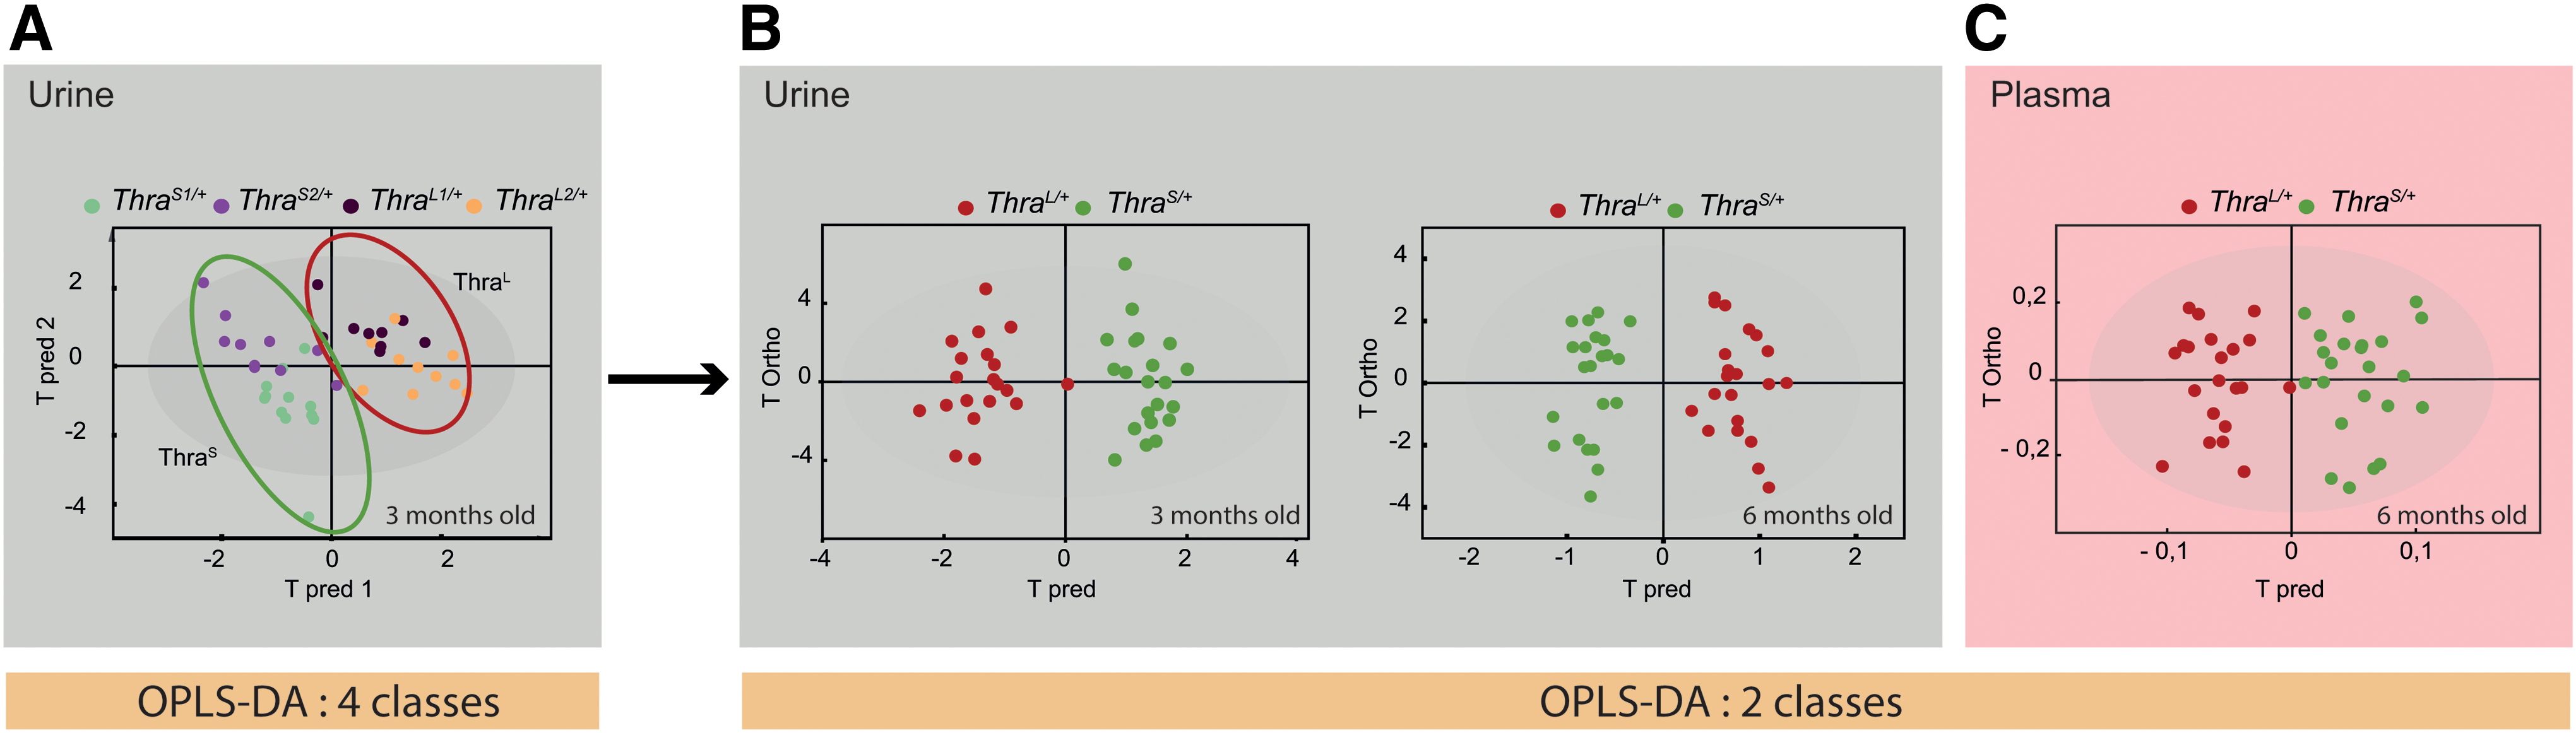
Multivariate analysis of metabolome. Distinction between Thra mutations.
Discrimination between ThraS/+ and wild-type mice
We then asked whether the group of ThraS/+ mice, which carry mutations relevant to human cases, could be recognized from a group of wild-type littermates. We performed three comparisons, using either urine (three or six months) or plasma. OPLS-DA of the metabolic profiles was performed to drive robust statistical models based on the discrimination between ThraS/+ and wild-type mice. We observed a significant discrimination between ThraS/+ samples and their associated wild-type controls in all three comparisons (Fig. 3). By contrast, similar comparisons were unable to discriminate the group of ThraL/+ mice from the wild-type group, as expected from the very limited consequences of these mutations on phenotype (data not shown).

Multivariate analysis of metabolome. Distinction between ThraS/+
animals and wild-type littermates.
Determination of a metabolic signature of Thra mutation in urine and blood plasma
The most significant variations of individual metabolites discriminating the ThraS/+ group from the wild-type group were identified with univariate analysis of spectral variables from urine and plasma NMR profiles. Urine metabolic signatures of ThraS/+ mice were characterized by increased levels of hippurate, formate, and fumarate, and decreased levels of Krebs cycle metabolites (acetate, succinate, citrate, and cis-aconitate), urea, allantoin, creatine, creatinine, isovalerylglycine, trimethylamine, dimethylamine, taurine, and oxoglutarate with respect to wild-type animals (Fig. 3G, H). Meanwhile, the plasma metabolic signature was characterized by higher levels of formate, phenylalanine, valine, isoleucine, allantoin, and lactate, and lower levels of Krebs cycle metabolites (acetate, succinate, and ketobutyrate), lipids, lipoproteins (very low-density lipoprotein [VLDL], low-density lipoprotein [LDL]), phosphocholine, glucose, creatine, threonine, glutamine, and pyruvate when compared with wild-type mice (Fig. 3I). The metabolic signatures of ThraS/+ obtained from urine and plasma share similarities in the composition and variations of four metabolites: formate, creatinine, acetate, and citrate.
Concentrations of dimethylamine, trimethylamine, isovalerylglycine, choline, and N-acetylglucosamine were shown to be significantly lower in urine of ThraS/+ mice, while polyunsaturated lipids were lower in the blood. Overall, this study provides metabolic signatures associated with RTHα in urine and plasma that present common and complementary information.
Comparison between the metabolic signatures of urine of three- and six-month-old mice provides useful information on the temporal stability of the observed metabolic changes. Overall, a large similarity in metabolite composition and variations was observed, 13 metabolites varying in the same way at both ages (Fig. 3G, H). Few differences were noticed, notably for formate and fumarate, for which differential concentrations only appeared in six-month-old mice. Variation in oxoglutarate content was also amplified in six-month-old mice. Dimethylamine, trimethylamine, and choline remained present in both signatures but became statistically significant, in univariate analysis, only after six months. To further ascertain the stability of the metabolic signature overtime, we verified that a set of variables of importance (>1) from the OPLS models obtained with urine samples from three-month-old mice could be used for classification of six-month-old mice urines (Supplementary Fig. S3).
Signature of Thra mutation is different from signature of hypothyroidism
RTHα patients share symptoms with hypothyroid patients. We thus investigated whether the metabolic signatures found for Thra mutations can be distinguished from a signature of hypothyroidism. Wild-type mice were made hypothyroid with propyl-thio-uracil treatment, and 1H-NMR analysis was performed to obtain a signature related to hypothyroidism in urine and plasma. A strong discrimination was observed between hypothyroid and control groups (Supplementary Fig. S4). By investigating urine and plasma metabolic profiles, we noticed that 24 and 17 metabolites vary in hypothyroid condition with respect to the nontreated group (Fig. 4). We treated the hypothyroid mice to restore the circulating levels of T4 and T3, and analyzed the metabolomic response two days later. As expected, this treatment resulted in acute changes of the previously identified metabolites, with few additional changes (Supplementary Fig. S5).

Metabolic signature of hypothyroidism. Metabolic signature discriminating hypothyroid and wild-type littermates. The colored spectral regions correspond to the statistically significant signals after significance to ANOVA tests followed by Benjamini–Hochberg multiple correction. Nonsignificant NMR variables are colored in gray.
When the metabolic signatures reflecting the presence of a Thra mutation and hypothyroidism were compared, clear differences were obvious. Only six common metabolite variations were found in urine: increased level of hippurate, and decreased levels of acetate, citrate, succinate, dimethylamine, and trimethylamine (Fig. 5A). In plasma, only seven metabolites were shared between the two metabolic signatures. Both were characterized by a decrease in LDL, VLDL, acetate, citrate, pyruvate, choline, phosphocholine, and glucose (Fig. 5B).

Summary of key metabolites found in urine
These results show that Thra mutation and hypothyroidism alter the urine and serum metabolomes in a very different manner. The metabolic profiles recorded in urine and plasma could therefore potentially contribute to the specific diagnosis of RTHα, which is a rare disease, much less frequent than hypothyroidism.
Discussion
The main objective of our study was to establish that metabolomic fingerprinting can be used as a diagnostic tool for a rare genetic disease, RTHα. Multivariate analysis of urine spectra provides a metabolic fingerprint that enables to recognize mice carrying a pathological mutation in the Thra gene, relevant to the human genetic disease. By contrast, the method did not identify the presence of weak alleles, which have little consequences on the development and physiology, and have never been reported in humans. The method did not pinpoint a single metabolite, the presence of which in urine or plasma would be the hallmark of RTHα. The statistical power rather relies on the capacity to evaluate the concentrations of a large number of metabolites simultaneously.
Previous metabolomic studies already analyzed the consequences of hypothyroidism in rat urine (24) and plasma (25) using mass spectrometry rather than 1H-NMR. The serum metabolites identified by mass spectrometry are not found in our study, mainly because our analysis is not suitable for the identification of lipids, which represent a large fraction of the discriminating metabolites. A study of human plasma also points out that the plasma concentration of many lipids correlates with the thyroid status (26). By contrast, the overlap is significant for urine metabolites, where changes in allantoin, creatinine, urea, and hippurate contents were detected in both cases.
Considering that mouse Thra and human THRA genes display extensive sequence similarities, mouse lines with Thra mutations are highly relevant animal models for RTHα. We thus expect that 1H-NMR can be used for RTHα diagnostics in humans. However, our experiments were performed using mice of the same age, sex, and genetic background, which were bred in a highly controlled environment. The clinical implementation of this method might thus be challenging, as body fluid composition is certainly more variable in human populations. Also, the interpretation of the metabolic signatures obtained in mice is not straightforward, and we cannot ascertain at this point that the underlying biochemical mechanisms are conserved in humans.
One encouraging observation is that, although 1H-NMR is also instrumental to recognize hypothyroidism, thyroid hormone deprivation provides a very different signature than Thra mutations. Our analyses show that, while Thra mutations and hypothyroidism may have a similar impact on glucose metabolism, they differentially affect the plasma content in lipids and cholesterol. In particular, variations in the plasma content in fatty acids are in the opposite direction. This is expected if one considers that the liver, which secretes a large fraction of the lipids found in serum and urine, expresses Thrb at a much higher level than Thra. Liver is thus expected to be more sensitive to changes in TH status than to Thra mutations. Studying both urine and plasma is also useful because the two biofluids provide common and complementary information. For example, correlated variations suggest that changes in urine reflect variations initially present in plasma, for creatinine, citrate, and acetate, and not an alteration of the renal function.
Additional features of the metabolic signature can be tentatively interpreted in biochemical terms. Isovalerylglycine is a product of leucine degradation to acetyl-CoA, which is an important feeder into the Krebs cycle (27). A significant decrease in the urinary level of isovalerylglycine, and the decrease in the levels of citrate, succinate, and acetate may thus indicate a change in the degradation of leucine.
Finally, the lower concentrations of dimethylamine, trimethylamine, choline, and hippurate observed in the urine of mutant mice and hypothyroid mice may reflect intestinal alterations. Gut microbial metabolism of choline, present in diet, leads to the production of trimethylamine, which, once absorbed, is metabolized to generate dimethylamine. Hippurate is also synthesized by the gut microbiota and its decreased concentration in urine is a marker of bowel inflammation, which compromises the barrier capacity of the epithelium (28). Therefore, it is tempting to speculate that changes for these metabolites are direct or indirect consequences of the defect in the intestinal epithelium, reported in hypothyroid (29) and Thra mutant mice (30,31). Although providing a snapshot of merely a fraction of the metabolome, 1H-NMR analysis of Thra mutant mice may thus be revealing changes in metabolic pathways and physiology, which are expected to be conserved in humans.
Footnotes
Acknowledgments
The authors thank Anne Lambert for her support in mouse breeding, and the AniRA-PBES facility (SFR Biosciences Lyon France). They acknowledge financial support from the Agence Nationale de la Recherche (ANR-15-CE14-0011-04 ThyroMUT2).
Author Disclosure Statement
No competing financial interests exist.
Supplementary Material
Supplementary Figure S1
Supplementary Figure S2
Supplementary Figure S3
Supplementary Figure S4
Supplementary Figure S5