
Abstract
Background:
Thyroid hormone (TH) acts on TH receptors (TRs) and regulates gene transcription by binding of TRs to TH response elements (TREs) in target gene promoters. The transcriptional activity of TRs is modulated by interactions with TR-coregulatory proteins. Mutations in TRα cause resistance to thyroid hormone alpha (RTHα). In this study, we analyzed if, beyond reduced triiodothyronine (T3) affinity, altered interactions with cofactors or different TREs could account for the differential impaired transcriptional activity of different mutants.
Methods:
We evaluated four mutants derived from patients (D211G, M256T, A263S, and R384H) and three artificial mutants at equivalent positions in patients with RTHβ (T223A, L287V, and P398H). The in vitro transcriptional activity was evaluated on TRE-luciferase reporters (DR4, IR0, and ER6). The affinity for T3 and interaction with coregulatory proteins (nuclear receptor corepressor 1 [NCoR1] and steroid receptor coactivator 1 [SRC1]) were also determined.
Results:
We found that the affinity for T3 was significantly reduced for all mutants, except for TRα1-T223A. The reduction in the T3 sensitivity of the transcriptional activity on three TREs, the dissociation of the corepressor NCoR1, and the association of the coactivator SRC1 recruitment for each mutant correlated with the reduced affinity for T3. We did not observe mutation-specific alterations in interactions with cofactors or TREs.
Conclusions:
In summary, the degree of impaired transcriptional activity of mutants is mainly determined by their reduced affinity for T3.
Introduction
Genomic actions of thyroid hormone (TH) are regulated by binding of the active form of TH, triiodothyronine (T3), to its nuclear TH receptors (TRs), which act predominantly as heterodimers with retinoid X receptors (RXRs) on TH response elements (TREs) in the promoter region of target genes (1,2). TREs usually consist of two-consensus half-sites that can be organized in direct repeats (DRs), inverted repeats (IRs), and everted repeats (ERs), separated by a stretch of random nucleotides of various lengths, of which the DR4-TRE is the predominant TR-binding form (3 –6). In the absence of ligand, TRs repress target gene transcription by recruitment of corepressors such as nuclear receptor corepressor 1 (NCoR1). Binding of T3 causes dissociation of the corepressors and allows coactivators, such as steroid receptor coactivator 1 (SRC1), to bind to the TR, resulting in activation of gene transcription (1,7).
Mutations in the ligand binding domain (LBD) of TRα1 cause resistance to thyroid hormone alpha (RTHα), which was first described in 2012 (8,9). The phenotype of RTHα patients includes growth retardation, macrocephaly, constipation, intellectual disability, anemia, and a high (F)T3/(F)T4 ratio (10,11). To date, 22 mutations (in a total of 37 patients) have been reported as a cause of RTHα. These mutations can be categorized into two groups based on the type of mutation. The first group consists of truncating mutations caused by nonsense or frameshift mutations that create premature stop codons and shorten the length of the LBD (8,9,12 –14). This structural alteration completely abolishes T3 affinity and T3-induced transcriptional activity of TRα1. The second group consists of missense mutations that result in single amino acid substitutions in the LBD (10,13 –20). These mutant receptors can still bind T3, but with a lower affinity than wild-type (WT) receptors.
There is a variety in the clinical phenotype of RTHα patients. Patients with truncating mutations generally have a more severe phenotype than patients with missense mutations (9,12 –14). Within the latter group, there are notable differences in the neurocognitive features (14,17,20). At present, it is unclear whether these differences are solely explained by differences in T3 binding. In RTHβ, mutation-specific effects on particular TREs and differences in interaction with coactivators versus corepressors have been described (21 –24). Here, we studied if mutation-specific effects on TRE or cofactor binding are present in a selected series of seven specific TRα1 missense mutations.
Materials and Methods
Plasmid constructs
The coding sequence (cDNA) of full-length TRα1 fused at the 5′ end to the FLAG epitope or to VP16 was cloned into the pcDNA3 (9) and the pCMX expression vectors (18), respectively, as previously described. Selected TRα1 missense mutations were introduced into pcDNA3-FLAG TRα1 and pCMX-VP16 TRα1 expression vectors using the QuikChange II Mutagenesis kit (Align Technologies, Amstelveen, The Netherlands) (see Supplementary Table S1 for primers) and confirmed by Sanger sequencing.
The luciferase reporter constructs containing the DR4, IR0, or ER6 TRE configurations (TRE-tkLuc) (25), the luciferase reporter construct containing the Gal4 binding site (UAStkLuc), and the pSG424 expression vector constructs containing the Gal4 DNA-binding domain (GAL4-DBD) fused to the interacting domains of NCoR1 or SRC1 (8) have all been described elsewhere.
[125I]T3 competitive binding assays
[125I]T3 competitive binding assays were performed as previously described (26). In brief, WT and mutant FLAG-TRα1 proteins were synthesized using the TnT® T7 Quick Coupled Transcription/Translation System (L1170; Promega, Leiden, The Netherlands). The proteins were incubated with 0.02 nM of [125I]T3 [prepared in-house as previously described (27)] and 0–10,000 nM unlabeled T3 (Cat. No. T2877; Sigma-Aldrich) at 30°C for 2 hours. The input of WT and mutant FLAG-TRα1 proteins' lysate was adjusted to obtain 10–20% maximal [125I]T3 binding, to prevent the ligand depletion effect. TR-bound [125I]T3 was measured and calculated as a percentage [125I]T3 input. The dissociation constant (Kd) was computed by GraphPad Prism 5.0 (GraphPad, La Jolla, CA).
In silico model prediction
The various TRα1 mutations were introduced into the WT T3-bound TRα1 crystal structure [PDB-ID: 2H77 (28)] using the side-chain substitution and optimization tools of the YASARA Structure software (YASARA Bioscience GmbH, Vienna, Austria) (29). The structural models of the TRα1 mutants have been processed and compared with the WT TRα1 structure as previously described (20). Given their location outside the ligand-binding pocket, the D211G, T223A, R384H, and P398H mutant models were compared with WT after additional molecular dynamic simulations in an AMBER force field with water as a solvent to investigate their impact on the structural integrity of the receptor.
Ligand-binding energy was calculated using the BindEnergy command implemented in YASARA Structure software, which calculates the in vacuo binding energy in NOVA force field without considering solvation effects (30). As such, this approach is suitable for detecting changes in binding energy by mutations that affect substrate interactions directly, and not for those having indirect effects. A high value indicates a favorable T3 binding.
Cell culture and transfection
JEG-3 cells (ECACC Cat. No. 92120308, RRID:CVCL_0363; Sigma-Aldrich) were cultured in 24-well plates using the growth medium (Dulbecco's Modified Eagle Medium (DMEM)/F12 supplemented with 9% fetal bovine serum (FBS), 100 nM Na2SeO3, 100 U/mL penicillin, and 100 μg/mL streptomycin) and transfected as previously described (19,26). Briefly, 20 ng of FLAG-TRα1 plasmid was cotransfected with 120 ng TRE-tkLuc reporter construct for transcriptional activity assays. For protein/protein interaction (mammalian two-hybrid) assays, 20 ng of TRα1 fused to the transcriptional activator VP16 (VP16-TRα1) plasmid was cotransfected with 20 ng of NCoR1 or SRC1 fused to the DNA binding domain of Gal4 (GAL4-NCoR1 or GAL4-SRC1) and 120 ng of UAS-tkLuc. In both assays, 20 ng pMaxGFP plasmid was cotransfected to monitor the transfection efficiency. All of the transfection processes were performed in TH-depleted medium (DMEM/F12 supplemented with 9% charcoal-stripped FBS) using X-tremeGENE 9 transfection reagent (Roche Diagnostics, Almere, NL). After a 24-hour transfection, cells were stimulated for 24 hours with 0–10,000 nM T3 in DMEM/F12 supplemented with 0.1% bovine serum albumin (BSA).
Immunoblotting
The expression of FLAG- and VP16-TRα1 proteins in cells was verified by immunoblotting nuclear extracts of JEG-3 cells transfected with WT or mutant TR expression constructs as previously described (19,26). The receptors were probed with 1:1000 dilution of FLAG-M2 antibody (#F1804; Sigma-Aldrich) or 1:1000 dilution of VP16 antibody (sc-7545; Santa Cruz Biotechnology). Histone 3 protein was detected with 1:1000 dilution of Histone 3 (H3; 1B1B2) antibody (#14269; Cell Signaling Technology) to verify comparable protein input. Bands were visualized on the Alliance 4.0 Uvitec platform (Uvitec Ltd.) by enhanced chemiluminescence (Thermo Fisher Scientific).
Electrophoretic mobility shift assays
A double-stranded overlapping oligonucleotide probe containing DR4-TRE was obtained by annealing 25 ng of sense and antisense oligonucleotide 5′ end labeling with fluorescence dye (5′IRDye®700) (Integrated DNA Technologies, Leuven, Belgium) at 80°C for 5 minutes (sense oligonucleotides: 5′-AGGACGTTG
Luciferase assays
Luciferase activity was determined using the Dual Glo Luciferase kit (E2940; Promega). Luciferase and GFP activities were measured by a luminometer (Victor™ X4; PerkinElmer, Groningen, The Netherlands). Half-maximal effective T3 concentration (EC50), half-maximal inhibitory T3 concentration (IC50), and %WT maximal response were analyzed using GraphPad Prism 5.0 (GraphPad).
Statistical analysis
The statistical differences between WT and mutants were analyzed by one-sample T-tests. The statistical differences of fold changes of logKd, logEC50, and logIC50 between WT and mutants were determined by one-way analysis of variance with Tukey's post test. Statistical significance was considered at p-values <0.05.
Results
Selection of mutants
We tested seven TRα1 mutants, of which four were derived from RTHα patients [D211G (19), M256T (20), A263S, and R384H (14)]. These mutations covered the three CpG-rich regions of the LBD of TRα1 that are equivalent to the mutation-prone hotspots of the TRβ1 receptor, namely R384H in cluster 1, M256T and A263S in cluster 2, and D211G in cluster 3. The other three mutations were derived from RTHβ patients. TRα1-P398H (cluster 1), the equivalent of TRβ1-P452H, gave rise to an unusual phenotype that included obesity and marked metabolic disturbances in a murine model for RTHα (31). TRα1-T223A (cluster 3) is the equivalent of TRβ1-T277A, which was previously shown to specifically impair transcriptional activity on an ER6-TRE and diminish affinity for SRC-1 (24). Finally, TRα1-L287V (cluster 2) is the equivalent of TRβ1-L341V, a recently identified mutation that causes a strong decrease in T3-binding affinity and a concomitant reduction in the T3 sensitivity of transcriptional activity and cofactor recruitment (26).
T3 binding affinity of the TRα1 mutants
We first determined the binding affinity of in vitro translated mutant receptors using a [125I]T3 competitive binding assay. The [125I]T3 binding curves were shifted to the right for most mutants (Fig. 1A), which reflects a higher required dose of T3 to saturate binding and hence a lower binding affinity. The dissociation constant (Kd), which is the concentration of T3 at which half the binding sites are occupied, varied between mutants (Fig. 1B and Supplementary Table S2). TRα1-M256T showed the lowest affinity, as illustrated by the highest Kd of all mutants (160-fold higher than WT). Binding of T3 was similarly affected for TRα1-D211G (Kd 25-fold higher than WT), -R384H (25-fold), -L287V (19-fold), and -P398H (17-fold), but significantly less impaired for TRα1-A263S (Kd 5-fold higher than WT), whereas the Kd of TRα1-T223A was not different from WT. These data indicate that the binding affinity is reduced to a different extent for the different mutants.

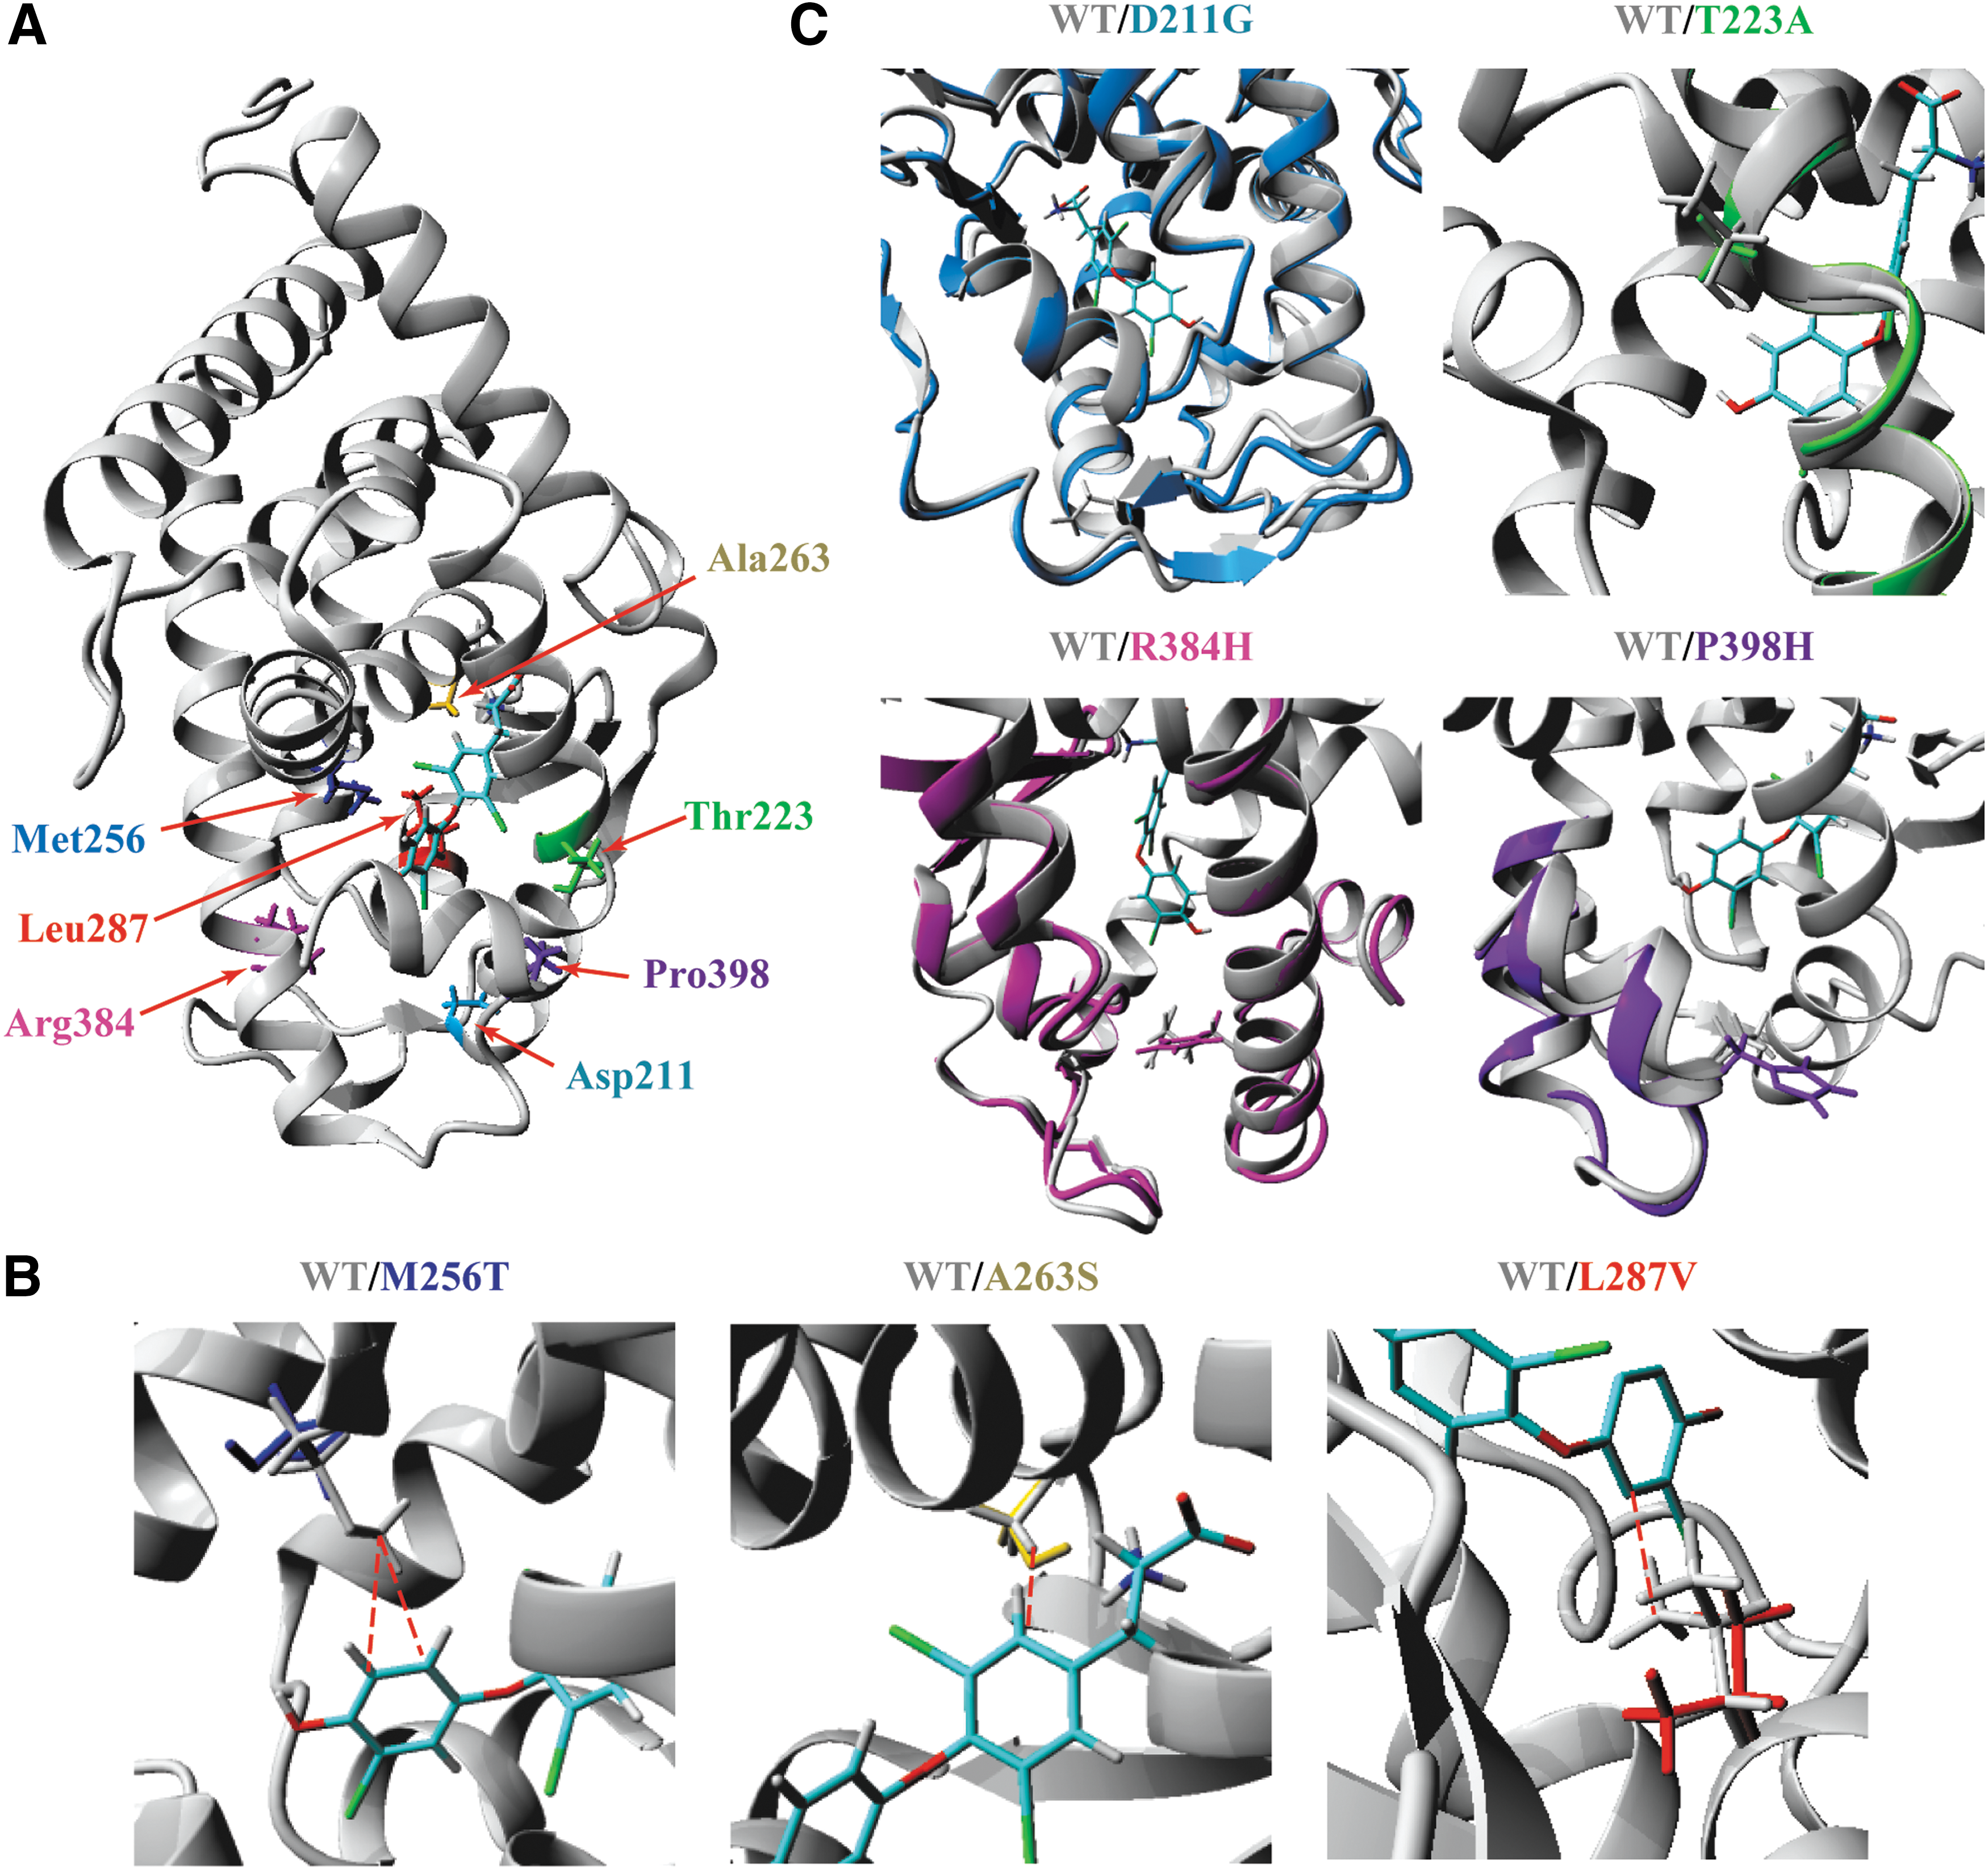
In silico model of mutant TRα1
Structural modeling was used to validate our in vitro studies. The side chains of A263, M256, and L287 face the ligand binding pocket (Fig. 2A, B), and are predicted to make direct interactions with T3 (Supplementary Fig. S1). The hydrophobic interaction between the side chain of A263 and the inner ring of T3 is lost in the A263S mutant. As previously reported (20), the M256T abrogates the direct interactions of M256 with T3 and simultaneously disturbs the structural niche accommodating the outer ring of T3. In analogy to the predicted in silico effects of the L341V mutant in TRβ1 (26), the L287V mutant disrupts the direct hydrophobic interaction of L287 with T3. In agreement with our in vitro studies, all three mutations reduced the calculated T3-binding energy compared with WT TRα1 in the order M256T>L287V>A263S (Supplementary Fig. S1D). Due to their location outside the binding pocket, the side chains of D211, R384, P398 (facing other internal domains), and T223 (facing the external protein surface) do not make direct contact with T3 (Fig. 2A, C), which prevents reliable in silico prediction of their impact on binding affinity. Structural modeling revealed extensive structural changes for the D211G (predominantly within the loop connecting H2 and H3), R384H, and P398H (predominantly H11 and H12) mutants, whereas the T223A mutant displayed only minor local structural changes of the backbone configuration (Fig. 2C). These observations may well explain the differential effects of these mutations on in vitro binding affinity.
Heterodimerization of TRα1 mutants with RXRα
To determine whether the dimerization of the mutants with RXR and binding of the dimer to DNA were affected, we performed electrophoretic mobility shift assays with in vitro translated WT or mutant TRα1 and RXRα on a fluorescently labeled DR4-TRE (Supplementary Fig. S2). The result showed that only a coincubation of TRα1 and RXRα could shift the DR4-TRE oligonucleotide probe upward. The upward shift of the probe was not observed in an incubation of WT TRα1 or RXRα alone. These findings indicate that the WT receptors exclusively bound to the DR4-TRE as heterodimers with RXRα, which is in contrast to the TRβ1 isoform that can bind as both homo- and heterodimers (32,33). The intensity of the heterodimer band was similar to WT for all mutants. In addition, heterodimer binding to the DR4-TRE was independent of the presence of T3 for WT and mutants. These results show that heterodimerization with RXRα and binding to the DR4-TRE are not affected in any of the mutants.
Receptor-cofactor interaction of the TRα1 mutants
To determine whether cofactor recruitment of the mutants was impaired, we next evaluated the interaction of the mutants with the corepressor NCoR1 and the coactivator SRC1, which directly bind to TRs and play a crucial role in receptor function (1,7). In a mammalian two-hybrid assay, VP16-TRα1 activates a luciferase reporter (UAS-tkLuc) only when it interacts with GAL4-NCoR1 or -SRC1. As a measure for T3 dependence, we determined the concentration that gave half-maximum dissociation of NCoR1 (IC50) and half-maximum association of SRC1 (EC50). Stimulation of WT TRα1 with low concentrations of T3 (0.1–1 nM) already resulted in dissociation of GAL4-NCoR1 (IC50 0.08 nM) and association of GAL4-SRC1 (EC50 0.28 nM). Most mutants required higher T3 concentrations to dissociate from NCoR1 (Fig. 1C) and recruit SRC1 (Fig. 1E). Consistent with the affinity for T3, TRα1-M256T showed the highest IC50 for NCoR1 dissociation (60-fold higher than WT) and EC50 for SRC1 association (200-fold) (Fig. 1D, F, Supplementary Fig. S3, and Supplementary Table S3). The TRα1-D211G, L287V, R384H, and P398H mutants showed higher IC50-NCoR1 dissociation and EC50-SRC1 association than WT but lower than TRα1-M256T. The fold increase of IC50 and EC50 of these four mutations was similar. The IC50-NCoR1 dissociation and EC50-SRC1 association of A263S-TRα1 mutation were approximately twofold higher than WT, corresponding to the changes of its Kd in competitive binding assays. For TRα1-T223A, the T3-induced NCoR1 dissociation and SRC1 association were similar to the WT receptor. We did not observe major differences in maximal binding of either NCoR1 or SRC-1 to mutants compared with WT, indicating that the affinity of the mutants for these cofactors is not markedly disturbed.
Transcriptional activity of the TRα1 mutants
We then tested the mutants for transcriptional activity using a reporter assay. For this, we cotransfected WT or mutant receptors into JEG-3 cells with constructs in which the coding sequence for firefly luciferase is under control of a DR4, IR0, or ER6-TRE.
The T3-induced transcriptional activity on the DR4-TRE was impaired for most mutant receptors, as indicated by a rightward shift of the dose-response curves compared with WT and a concomitant increase in EC50, representing the T3 dose that is needed to achieve a half-maximal response (Fig. 3A and Supplementary Table S4). TRα1-M256T had the highest EC50 (100-fold higher than WT). The EC50 of TRα1-D211G, L287V, R384H, and P398H was ∼10 to 20-fold higher than that of WT. In contrast, the EC50 of TRα1-A263S and T223A was not significantly different from WT. The fold increase in EC50 tested on the IR0- and ER6-TREs of each mutant was not significantly different from that tested on the DR4-TRE (Fig. 3B–D), suggesting that the effects of these mutations are not TRE specific. Most of the mutants showed a similar maximal transcriptional activity as WT at supraphysiological T3 concentrations, with the exception of TRα1-T223A on DR4-TRE and TRα1-P398H on DR4- and IR0-TRE that were significantly lower than that of WT.

The T3-induced transcriptional activity of TRα1 WT and mutants tested on three different TRE-luciferase reporter constructs.
Correlation between T3-affinity, cofactor binding, and transcriptional activity of TRα1 mutants
Finally, to determine whether certain aspects of receptor regulation were proportionally stronger affected than that would be expected from the effect of the mutation on T3 binding, we correlated the fold increase of parameters for binding affinity, and T3-dependent activity and cofactor recruitment (Fig. 4). The fold increases in IC50-NCoR1, EC50-SRC1, and EC50 on DR4-TRE generally followed the same trend as the fold increase in Kd of each mutant with two exceptions. First, the fold increase in EC50-SRC1 of M256T-TRα1 was slightly but significantly higher than its IC50-NCoR1, which would suggest a marginally stronger effect of the mutation on T3-dependent SRC1 recruitment than NCoR1 release. Second, the fold increase in Kd of R384H-TRα1 was slightly higher than its IC50-NCoR1. In both cases, however, this did not result in a significant effect on the EC50-DR4 TRE, indicating that these differences do not majorly contribute to the degree of functional impairment.

Fold increases of Kd, IC50-NCoR1 dissociation, EC50-SRC1 association, and EC50 of T3-induced transcriptional activity on the DR4-TRE. These fold increases are various among mutants but generally follow a similar trend for each mutant, except for M256T and R384H (one-way ANOVA with Tukey's post-test *p < 0.05). ANOVA, analysis of variance; DR, direct repeat.
Discussion
In the current study, we report in vitro functional studies of seven TRα1 missense mutations. The main purpose was to investigate if other factors, beyond disturbed T3 binding, contribute to the functional impairment of TRα1 mutations. According to our results, the reduced affinity for T3 is the main factor that determines both the severity of impaired transcriptional activity and impaired TR-cofactor interaction of the mutants. In our series, we did not find evidence for mutation-specific effects on different TREs or coregulatory protein binding.
Our selection of mutants covered the equivalents of the three mutation-prone hotspots in TRβ1. We evaluated the effect of mutations on transcriptional activity by overexpressing WT or mutant receptors with a reporter gene under control of TREs. Since some TRβ1 mutants display TRE-selective defects, we included all three reported half-site configurations (DR4, IR0, and ER6). As expected, the mutants had an impaired T3-dependent transcriptional activity, as illustrated by their dose-response curves with a clear shift to the right side of the WT curve and corresponding higher EC50 than WT. The degree of impaired transcriptional activity varied among the mutants and correlated with the reduced T3-binding energy of the mutants predicted by the in silico modeling and the reduction in T3 affinity from the in vitro binding assays. This finding is in line with previous reports of the other mutants derived from RTHα patients (8,12,15,25). In addition, the degree of impaired transcriptional activity seemed to be related to the severity of the phenotype of the RTHα patients, especially the delayed motor development, which is much more prominent in the patients carrying TRα1-D211G and -R384H mutations than in the patient carrying a TRα1-A263S mutation. This is in agreement with a previous report by Moran et al. which showed that the functional properties of two TRα1 mutations (A263V and L274P) correlate with the clinical features of the patients (18).
There was no TRE-selective reduction in T3-dependent receptor activity since the fold increase in EC50 on all three TREs was similar for each mutant. Of note, the T223A-TRα1 mutant did not show any differential effect on different TREs, which is in contrast with its equivalent TRβ1-T277A, which is selectively affected on an ER6-TRE (24). However, the maximal response of T223A and P398H was lower than that of WT on the DR4- and IR0-TRE. This TRE-specific submaximal response has been previously reported in TRβ1-T277A (24); however, in these studies, the submaximal response was found on the DR4- and ER6-TRE. The TRE-specific transcriptional impairment may be caused by different patterns of dimer formation and cofactor recruitment among TREs (34,35). Nevertheless, since numerous chromatin occupation studies have suggested that the DR4-TRE is the most important TRE playing a role in the in vivo TR transcription (3 –6), the pattern of TR-regulating gene transcription is more likely to follow the in vitro result of the DR4-TRE rather than IR0- and ER6-TRE. Therefore, selective transcriptional impairment of the mutants on IR0- and ER6-TRE found in vitro may not have a large contribution in the severity of phenotypes in RTH patients.
It has been shown that a submaximal response of mutant receptors can be caused by impaired TR-cofactor interactions. For instance, the reduced maximal response of TRβ1-T277A was due to a reduced affinity for SRC-1, which could be rescued by overexpression of SRC-1 (24). Mutations at the residues adjacent to P452 of the TRβ1 (homologous to P398 of TRα1), P453 and L454, were also unable to reach WT maximal response and have been shown to have a defective TR-cofactor interaction that consequently affects transcriptional activity to a greater extent than what would be expected based on their reduced affinity for T3 (25,36,37). We, therefore, evaluated the interaction of selected TRα1 mutants with the NCoR1 corepressor and the SRC1 coactivator. Except for T223A, the mutants required higher T3 levels than WT to dissociate from NCoR1 and to associate with SRC1, illustrating the impaired T3-dependent TR-cofactor interaction of these mutants. However, the degree of impaired TR-cofactor interaction was similar to the reduced affinity for T3 for all selected mutants. In addition, the maximum binding of TRα1-T223A and -P398H was similar to WT. These findings suggest that these mutations alter the T3-dependent TRα1-cofactor recruitment via their reduced T3 affinity, but that the submaximal response is likely explained by another mechanism such as impaired interaction of the mutants with other nuclear cofactors. We also studied the heterodimerization property of the selected TRα1 mutants and found that none of them disturbed heterodimer formation on the DR4-TRE, suggesting that the submaximal response of these mutant receptors is not explained by altered heterodimerization with RXR.
To our knowledge, our study reports the in vitro functional impairment at different levels of the largest series of TRα1 mutants to date, including four mutations derived from RTHα patients, which cover all three CpG-rich clusters of TRα1 that correspond with the mutation-prone hotspots of TRβ1. However, the transcriptional activation of mutants in this study was only tested on the most abundant TRE configuration, DR4 (3 –6), and the other two well-known TRE configurations, IR0 and ER6, which do not cover all natural TREs. Therefore, the results should be interpreted and applied cautiously. Our study also did not explore some issues that might complicate the phenotype of RTH patients, for instance, the negative transcriptional gene regulation by TRs and the effect of mutant TRs on WT receptor function, known as a dominant negative effect. In addition, our experiments were performed exclusively in vitro and mainly by the overexpressing system in JEG-3 cells, which might not be entirely comparable with the in vivo situation. Although JEG-3 cells comprise a well-established model to study the impact of TR mutations, the results of which correlate with the severity of the clinical phenotype, it may not represent the situation in other cell types or tissues. Therefore, studies in different TR-overexpressing cell lines, or in models that rely on endogenously expressed mutant TRs (such as CRISPR-Cas9 genome editing or primary cells derived from patients) may substantiate our findings.
RTHα patients are currently treated with levothyroxine (LT4) to normalize FT4 levels and reduce the hypothyroid state of tissues that predominantly express TRα1, which in some cases has been shown to ameliorate the developmental delay and chronic symptoms (15,18,19); however, the working mechanism is yet unclear. Since FT4 and T3 levels are only marginally increased, it seems unlikely that this treatment results in a significant occupation of receptors that have a 10–100-fold reduction in ligand affinity, but rather increases the number of activated WT receptors. Given that the functional defects of TRα1 missense mutants are driven by their reduced ligand affinity, agonists that provide a better fit to the altered ligand-binding pockets could, therefore, be a tailor-made treatment. Although such agonists are currently lacking, the finding that some TRβ1 mutants are more efficiently dissociated from NCoR1 by the natural T3 analogue triiodoacetic acid, which is sometimes used to suppress FT4 levels in RTHβ patients, and the TR antagonist NH-3 (38) shows that such an approach may be viable.
In summary, this study demonstrates that the severity of impaired transcriptional activity of mutant TRα1 receptors is mainly determined by the reduced affinity for T3. These mutations also alter TR-cofactor interactions to the same magnitude as the T3 binding defect. However, further studies are required to extensively evaluate the in vivo consequences of the TRα1 mutations.
Footnotes
Acknowledgment
We thank Prof. V. Krishna Chatterjee (Wellcome-MRC Institute of Metabolic Science, University of Cambridge, United Kingdom) for kindly providing some of the plasmids used in this study.
Author Disclosure Statement
No competing financial interests exist.
Funding Information
This work is supported by Zon-MWTOP grant 91212044 and an Erasmus MC Medical Research Advisory Committee (MRACE) grant (R.P.P, M.E.M), and the Chiang Mai University (K.W.).
Supplementary Material
Supplementary Figure S1
Supplementary Figure S2
Supplementary Figure S3
Supplementary Table S1
Supplementary Table S2
Supplementary Table S3
Supplementary Table S4