
Abstract
Background:
Uncertainty in the mechanism and directionality of observational associations between thyroid function and kidney function may be addressed by genetic analysis with an instrumental variable method termed bidirectional Mendelian randomization (MR).
Methods:
In the Women's Genome Health Study (WGHS), observational associations between thyroid measures and kidney function were evaluated. Genetic instruments for MR were from recent genome-wide association studies (GWAS) of hypothyroidism, thyrotropin (TSH), and free thyroxine (fT4) concentrations within the reference range, thyroid peroxidase antibodies (TPOAb), estimated glomerular filtration rate from creatinine (eGFRcrea), eGFR from cystatin C (eGFRcys), and chronic kidney disease (CKD). In WGHS individual-level data, these instruments were used for bidirectional MR between thyroid (N = 3336) and kidney (N = 23,186) functions. To increase power, MR was also performed using GWAS summary statistics from the Chronic Kidney Disease Genetics Consortium (CKDGen) for eGFRcrea (N = 567,460), eGFRcys (N = 24,063), CKD [N(total) = 480,698, N(cases) = 41,395], and urinary albumin/creatinine ratio (UACR/N = 54,450).
Results:
In the WGHS, hypothyroidism was observationally associated with decreased eGFRcrea [beta (standard error, SE): −0.024 (0.009) ln(mL/min/1.73 m2), p = 0.01]. By MR, hypothyroidism was associated with decreased eGFRcrea in the WGHS [beta (SE): −0.007 (0.002) per doubled odds hypothyroidism, p = 1.7 × 10⁻³] and in CKDGen [beta (SE): −0.004 (0.0005), p = 2.0 × 10⁻²²], and robust to sensitivity analysis. Hypothyroidism was also associated by MR with increased CKD in CKDGen (odds ratio, OR [confidence interval, CI]: 1.05 [1.03–1.08], p = 3.3 × 10⁻⁵), but not in the WGHS (OR [CI]: 1.02 [0.95–1.10], p = 0.57). Increased TSH within the reference range had an MR association with increased eGFRcrea in the WGHS [beta (SE): −0.018 (0.007) ln(mL/min/1.73 m2)/standard deviation, SD, p = 6.5 × 10⁻³] and CKDGen [beta (SE): −0.008 (0.001) ln(mL/min/1.73 m2)/SD, p = 6.8 × 10⁻¹⁷], and with CKD in CKDGen (OR [CI]: 1.10 [1.04–1.15], p = 3.1 × 10⁻⁴). There were no MR associations of hypothyroidism or TSH with eGFRcys or UACR, and MR associations of fT4 in the reference range with kidney function were inconsistent in both the WGHS and CKDGen. However, by MR in CKDGen, TPOAb were robustly associated with decreased eGFRcrea [beta (SE): −0.041 (0.009), p = 6.2 × 10⁻⁶] and decreased eGFRcys [beta (SE): −0.294 (0.065), p = 6.2 × 10⁻⁶]. TPOAb were less robustly associated with CKD but not associated with UACR. In reverse MR in the WGHS, kidney function was not consistently associated with thyroid function.
Conclusions:
Bidirectional MR supports a directional association from hypothyroidism, increased TSH, and TPOAb, but not fT4, to decreased eGFRcrea and increased CKD.
Introduction
Primary hypothyroidism is characterized by a high concentration of thyrotropin (TSH) concomitant with concentrations of thyroid hormones being low (overt) or within the reference range (subclinical). In conventional nongenetic observational studies, both overt and subclinical hypothyroidism are associated with increased plasma creatinine, decreased estimated glomerular filtration rate (eGFR), chronic kidney disease (CKD), and increased urinary albumin/creatinine ratio (UACR) (1 –12). Overt hypothyroidism is most often an autoimmune disease in adults, (13) affecting predominantly middle-aged and older women. Thyroid hormones within the reference range may also affect kidney function through direct effects on glomerular and tubular functions and indirect prerenal effects on cardiovascular hemodynamics and renal blood flow (14). Increased TSH within the reference range is associated with reduced eGFR (1,15 –22), but whether related triiodothyronine and thyroxine are also associated with kidney function is debated (3,4,15,17,21 –23). Diagnosis of kidney disorders may also be related to thyroid dysfunction due to the depletion of TSH, free thyroxine (fT4), and relevant binding proteins from the circulation through leakage into the urine or alternatively to nonthyroidal illness (14,24 –27).
Attempts to clarify the causal directionality between thyroid and kidney function from conventional nongenetic observational studies remain inconclusive. Observational designs or small randomized trials show that thyroid hormone replacement therapy improves kidney function in patients with subclinical or overt hypothyroidism (28 –32); but no large-scale, long-term randomized trial has been undertaken to more convincingly determine the potential existence and directionality of a causal relationship between thyroid and kidney function.
Mendelian randomization (MR) analysis, which is conceptually analogous to a randomized controlled trial, can be used in a bidirectional design to evaluate effects of thyroid function on kidney function, and vice versa (33). In MR, genetic variation is used as an instrumental variable for a clinical trait, and its randomization at conception is leveraged to evaluate associations through methods that are less affected by reverse causation compared with conventional, nongenetic observational designs (33). Previous MR studies using genetic instruments from genome-wide association studies (GWAS) for TSH and fT4 investigated associations with cardiovascular disease (34,35), type 2 diabetes (36), and bone mineral density (37). A recent MR study using only three variants for TSH investigated the association with creatinine-based eGFR in a Chinese population, but did not find an association (38). No MR study has been performed using a bidirectional approach or using a full set of GWAS instruments for hypothyroidism, TSH, fT4, and thyroid peroxidase antibody (TPOAb) on creatinine- and cystatin C-based eGFR, UACR, and CKD in Europeans to infer the direction behind the conventional, nongenetic observational associations between thyroid and kidney dysfunction. Nevertheless, a comprehensive MR analysis of associations between thyroid and kidney functions has potential for clinical translation in the context of thyroid hormone treatment in patients with hypothyroidism.
We used bidirectional MR to assess the mechanisms and direction of effects between thyroid and kidney functions. We selected single-nucleotide polymorphism (SNP) GWAS instruments to address various measures of thyroid function, namely hypothyroidism (39 –41), increased TSH within the reference range (42 –44), increased fT4 within the reference range (42 –44), and increased antibodies against thyroid peroxidase (TPOAb) (45,46), to predict kidney function [estimated glomerular filtration rate from creatinine [eGFRcrea] (47), eGFR from cystatin C [eGFRcys] (48), CKD (47), and UACR (49)] in the Women's Genome Health Study (WGHS) and through published GWAS summary statistics from the Chronic Kidney Disease Genetics Consortium (CKDGen). In addition, in the WGHS, we used GWAS-identified SNP instruments for kidney function as predictors of thyroid function, and thereby investigate reverse directionality.
Materials and Methods
The analytic approach consisted of two parts. First, in a single-sample analysis using individual-level data from the WGHS, we performed MR with genetic risk scores (GRSs) to assess the relevance of hypothyroidism, TSH, and fT4, both within the reference range, to eGFRcrea and CKD (Fig. 1 and Table 1). Similarly, in the reverse direction, we tested the relevance of eGFRcrea and CKD to TSH, fT4, and prevalence of hypothyroidism. Second, to leverage the greater power implicit in the much larger sample sizes of GWASs for thyroid and kidney measures (the latter from the CKDGen), we performed two sample MR to assess the relevance of hypothyroidism, TSH, and fT4 within the reference range, and anti-TPO to eGFRcrea, eGFRcys, UACR, and CKD. For eGFRcrea and CKD, the WGHS and CKDGen were not fully independent due to overlapping samples (4%).
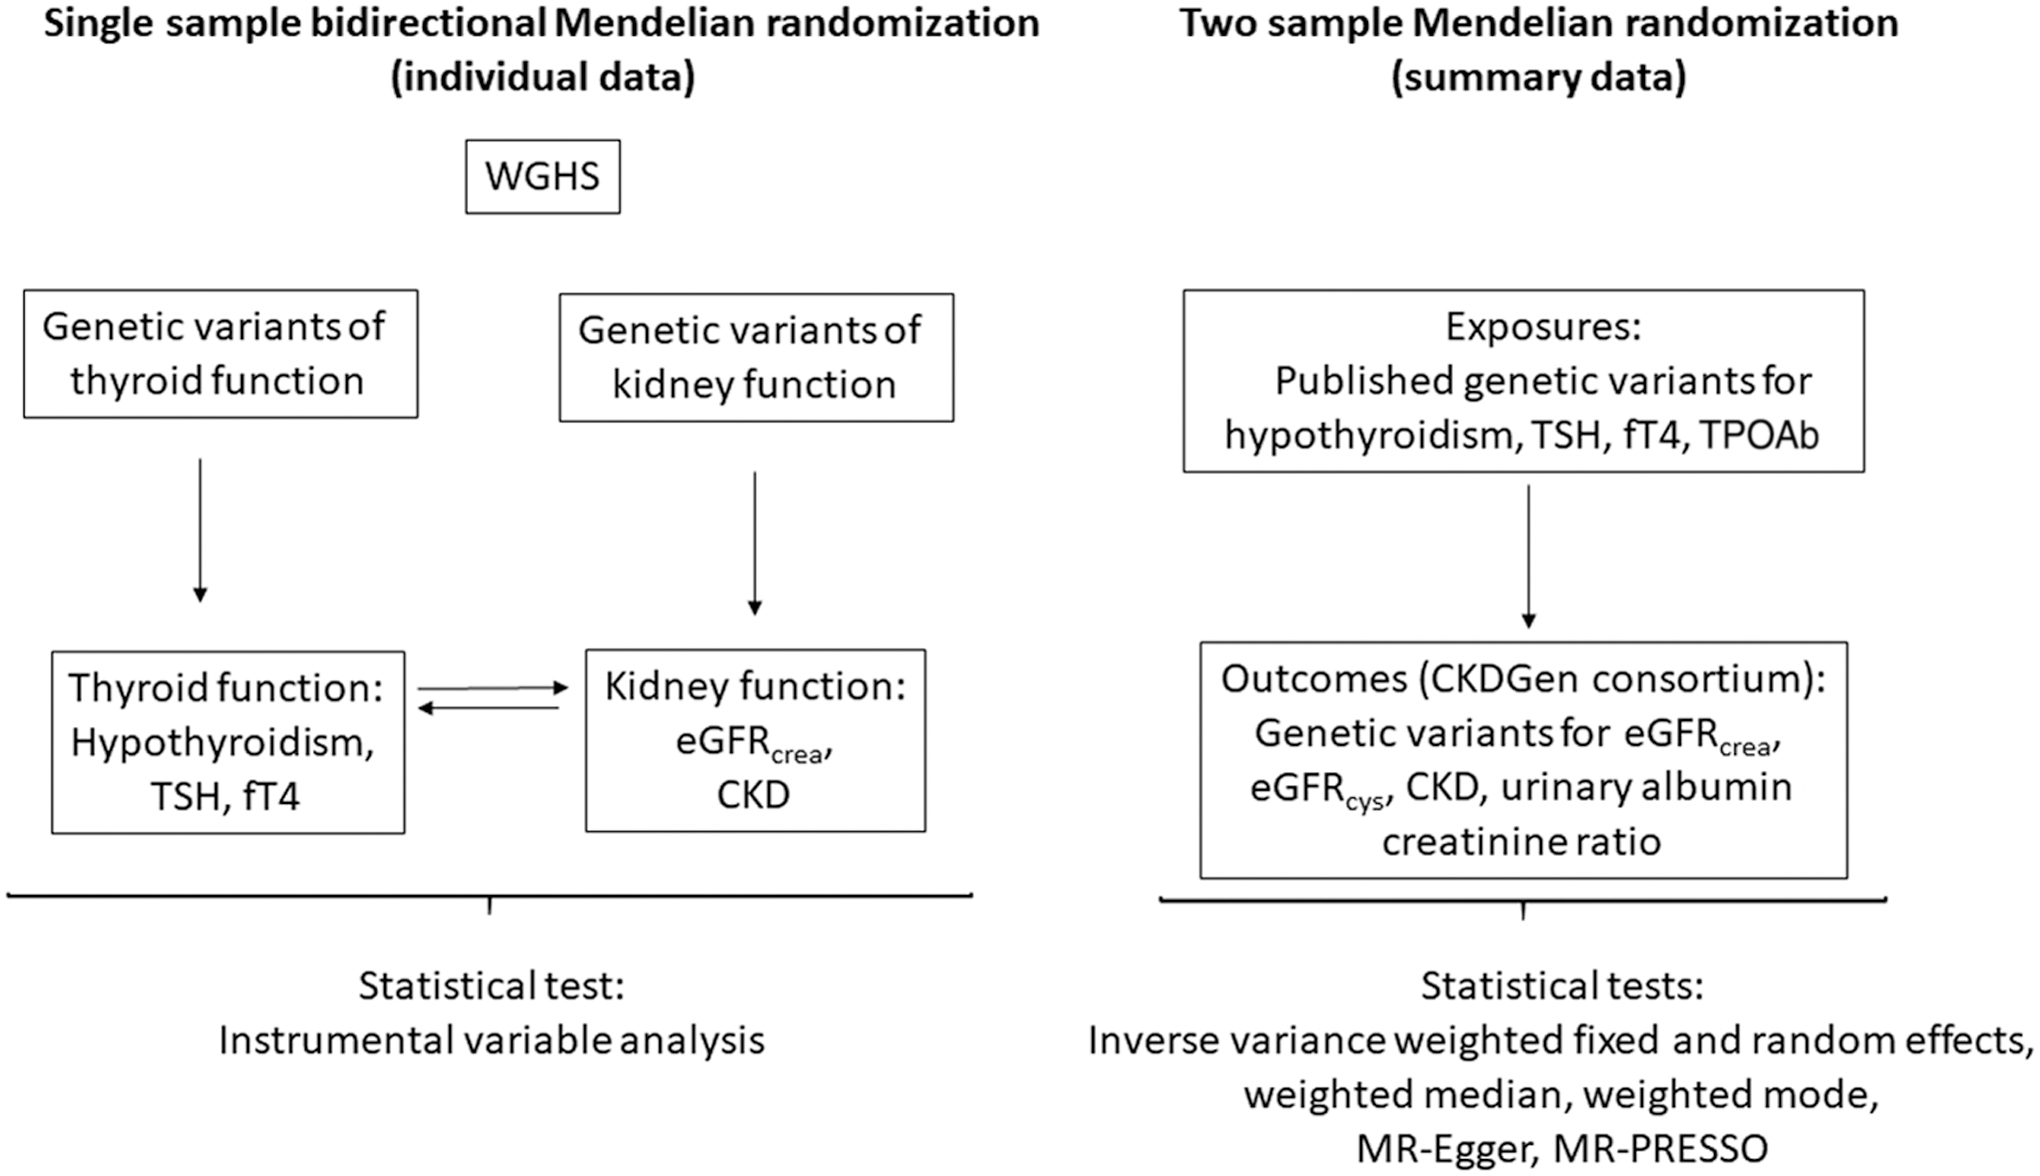
Flowchart representing the main design in the MR of thyroid and kidney function. CKDGen, Chronic Kidney Disease Genetics Consortium; eGFRcrea, estimated glomerular filtration rate from creatinine [in ln(mL/min/1.73 m2)]; eGFRcys, estimated glomerular filtration rate from cystatin C [in ln(mL/min/1.73 m2)]; fT4, free thyroxine (per SD); MR, Mendelian randomization; MR-PRESSO, Mendelian randomization pleiotropy residual sum and outlier; SD, standard deviation; TPOAb, thyroid peroxidase antibody (per SD); TSH, thyrotropin (per SD); WGHS, Women's Genome Health Study.
Description of Consortia and Cohorts for Each Phenotype of the Association of Thyroid Function with Kidney Function
Individuals contributing to these analyses all had European ancestry.
CKD, chronic kidney disease; CKDGen, Chronic Kidney Disease Genetics Consortium; eGFRcrea, estimated glomerular filtration rate from creatinine [in ln(mL/min/1.73 m2)]; eGFRcys, estimated glomerular filtration rate from cystatin C [in ln(mL/min/1.73 m2)]; fT4, free thyroxine (per SD); NR, not reported; SD, standard deviation; TPOAb, thyroid peroxidase antibody (per SD); TSH, thyrotropin (per SD); UACR, urinary albumin/creatinine ratio [ln(mg/g)]; WGHS, Women's Genome Health Study.
The Women's Genome Health Study
The WGHS includes 23,294 women with whole-genome genotype data and verified European ancestry who were 45 years or older and free of cardiovascular disease and cancer at the time of enrollment, that is, baseline (50). The cohort and the genotyping are described in Supplementary Data. Of the 23,186 women with serum creatinine at baseline, assessment of thyroid function was available in 3336 individuals through measures of TSH (mIU/mL, N = 3321), fT4 (ng/dL, N = 3320), and free triiodothyronine (fT3; pg/mL, N = 3321) (51). In this subsample, euthyroidism was defined as 0.27 ≤ TSH ≤4.2 mIU/L and 0.93 ≤ fT4 ≤ 1.7 ng/dL (N = 2247), and hypothyroidism (N = 676) was defined as TSH >4.2 mIU/L with either normal fT4 (i.e., subclinical, 0.93 ≤ fT4 ≤ 1.7 ng/dL) or decreased fT4 (i.e., overt hypothyroidism, fT4 < 0.93 ng/dL) (51). The study was approved by the Institutional Review Board at the Brigham and Women's Hospital (Boston, MA).
Genetic instruments
Thyroid function: Independent SNPs with minor allele frequency >1% have been identified in GWASs (p < 5 × 10⁻⁸) among Europeans for TSH (N SNPs = 42) and fT4 (N = 21) concentrations in the reference range (42 –44), TPOAb concentration (N = 5) (45,46), and hypothyroidism (N = 30) (39 –41) (Supplementary Data). In the study by Pickrell et al. using data from 23andMe, Inc., the diagnosis of hypothyroidism was self-reported (41). In the study by Teumer et al. using data from various cohorts, the reference range was 0.4–4 mIU/L and hypothyroidism (subclinical+overt) was defined as TSH above the upper reference limit (43,44). In the WGHS, genetic information was available for 14 SNPs for hypothyroidism (omitting SNPs that were either indels or had an ambiguous risk allele), 38 SNPs for TSH, and 21 SNPs for fT4. In the CKDGen GWAS, summary statistics were available for 15 SNPs for hypothyroidism, 39 SNPs for TSH, 21 SNPs for fT4, and 5 SNPs for TPOAb concentration. We included only SNPs in separate loci with minimal linkage disequilibrium (R 2 ≤ 0.05).
Kidney function: Genetic instruments for kidney function were identified in summary statistics from the GWAS conducted by meta-analysis by the CKDGen (47,48,52). For use in the reverse MR analysis, the GWAS identified (a) 5 independent SNPs for CKD (52), 4 of which were available in the WGHS, and (b) 53 independent SNPs for eGFRcrea, of which we excluded 8 on the basis of their discovery only in the “no diabetes subgroup” (52), 7 SNPs associated with creatinine production and secretion (53), and 4 SNPs that were not available in the WGHS (49,52) (Supplementary Data).
Measurements of kidney function
In all studies in CKDGen, including the WGHS, serum creatinine was calibrated to the U.S. nationally representative National Health and Nutrition Examination Survey data, to account for between-laboratory variation (52) (Supplementary Data). Values of eGFRcrea were calculated from serum creatinine, using the equation for the Modification of Diet in Renal Disease (MDRD) Study and applied to define CKD (eGFRcrea <60 mL/min/1.73 m2) (52). eGFRcrea was age and sex adjusted using residuals, and then natural log transformed (52). In CKDGen, eGFRcys was estimated as 76.7 × (serum cystatin C)−1.19 (52), and UACR was calculated as urinary albumin/urinary creatinine (mg/g) to account for differences in urine concentration (49). The percentage overlap between CKDGen and WGHS was 4% for eGFRcrea and CKD.
Statistics
As we tested four primary but related traits by MR (hypothyroidism, TSH, fT4, and TPOAb), we considered a two-tailed p-value <0.013 (0.05/4) to be significant (Bonferroni correction). In published GWASs, TSH and fT4 were therefore scaled to study-specific standard deviation (SD) units (42,43). Traits in the WGHS were scaled using the WGHS SDs. All genetic instruments for MR had been reported as genome-wide significant (p < 5.0 × 10⁻⁸) associations. To detect a difference in eGFRcrea of 0.1 ln(mL/min/1.73 m2) at an alpha of 0.05 in the MR, we had 34% power for hypothyroidism and TSH in WGHS (N = 23,186) and 100% power in CKDGen (N = 567,460) (Supplementary Table S1 and Supplementary Fig. S1A, B) (54 –56).
Single-sample GRS-based MR in the WGHS
Observational associations between thyroid measures (TSH, fT4, fT3, fT3/fT4-ratio) and kidney measures (eGFRcrea, CKD) were investigated at a cross-sectional level at baseline using multivariable adjusted linear regression for continuous outcomes and logistic regression for binary outcomes. Adjustments were made for the following covariates: age (years), smoking (current vs. no smoker), body mass index (kg/m2), HbA1c (%), alcohol (units/week), cholesterol (mg/dL), and systolic blood pressure (mm Hg). A GRS was created by summing the allele count of genotyped alleles or the maximum likelihood dose of imputed alleles at each of the variants, weighted by the published effect sizes (β coefficients) (44). For MR analyses in the WGHS, SNP-exposure and SNP-outcome associations were estimated by linear regression for continuous measures of thyroid function (TSH, fT4) and kidney function (eGFRcrea), while logistic regression was used for hypothyroidism and CKD (i.e., eGFRcrea < 60 mL/min/1.73 m2), adjusting for age at baseline, geographical location, and the first four principal components of population substrata for both types of models. F-statistics for instrument strength were obtained from linear or logistic regressions of “GRS-exposure” associations; and the GRSs for hypothyroidism, TSH, and fT4 all had sufficient instrument strength (F ≥ 10). MR instrumental effects were derived by the instrumental variable Wald estimator, that is, the ratio of the β coefficient from the GRS on the outcome association divided by the β coefficient from the GRS on exposure association, with standard errors (SEs) calculated using the delta method (57). As published GWAS results for TSH and fT4 were based on euthyroid individuals (42 –44), we restricted the sample to euthyroid individuals for MR of TSH and fT4. For analyses of hypothyroidism (overt and subclinical combined), the comparison group was euthyroid individuals (Supplementary Data). We multiplied the MR estimate of a binary exposure (i.e., hypothyroidism or CKD) with 0.693 (i.e., loge2) to reflect the average change in the outcome per doubling (twofold increase) in the odds of the binary exposure (58,59).
Two-sample MR using CKDGen
For each SNP, we calculated the instrumental variable ratio as the quotient of the SNP-outcome to SNP-exposure effects, deriving the SE in this estimate with the delta method. We calculated the combined effect across all SNPs using five complementary methods with different assumptions about horizontal pleiotropy to assess robustness: inverse-variance weighted (IVW) fixed effects (IVW-FE) and random effects (IVW-RE), weighted median (WM), weighted mode, and MR-Egger regression (60 –63). For the latter, we used simulation extrapolation (SIMEX) if the regression dilution statistic (I 2 GX) was below 0.90 indicating violation of the No Measurement Error (NOME) assumption (62). We used the Mendelian randomization pleiotropy residual sum and outlier (MR-PRESSO) to test for possible bias from horizontal pleiotropy (64). We calculated the proportion variance explained for the outcomes interrogated based on the instruments used (65). As for analysis using the GRS, we report instrumental MR estimates for binary exposures as the estimated average change in the outcome per doubling in the odds of the exposure. See Supplementary Data for details.
Results
Bidirectional single-sample MR using GRSs in the WGHS
Of the 3336 WGHS women with thyroid measures, 676 (20%) had subclinical or overt hypothyroidism and 2247 were euthyroid, while 2124 (9.2%) of 23,186 women with European ancestry had CKD (Table 1 and Supplementary Table S2). Compared with euthyroid women, hypothyroid women were older, had higher systolic blood pressure, and smoked less. Hypothyroidism was associated with decreased eGFRcrea [beta (SE): −0.024 (0.009) ln(mL/min/1.73 m2), p = 0.01], but nonsignificant for CKD (Supplementary Table S3). Increased TSH was also associated with a decreased eGFRcrea and an increased risk of CKD (Supplementary Table S3). However, in euthyroid participants, neither TSH nor fT4 was associated with either eGFRcrea or CKD (Supplementary Table S3).
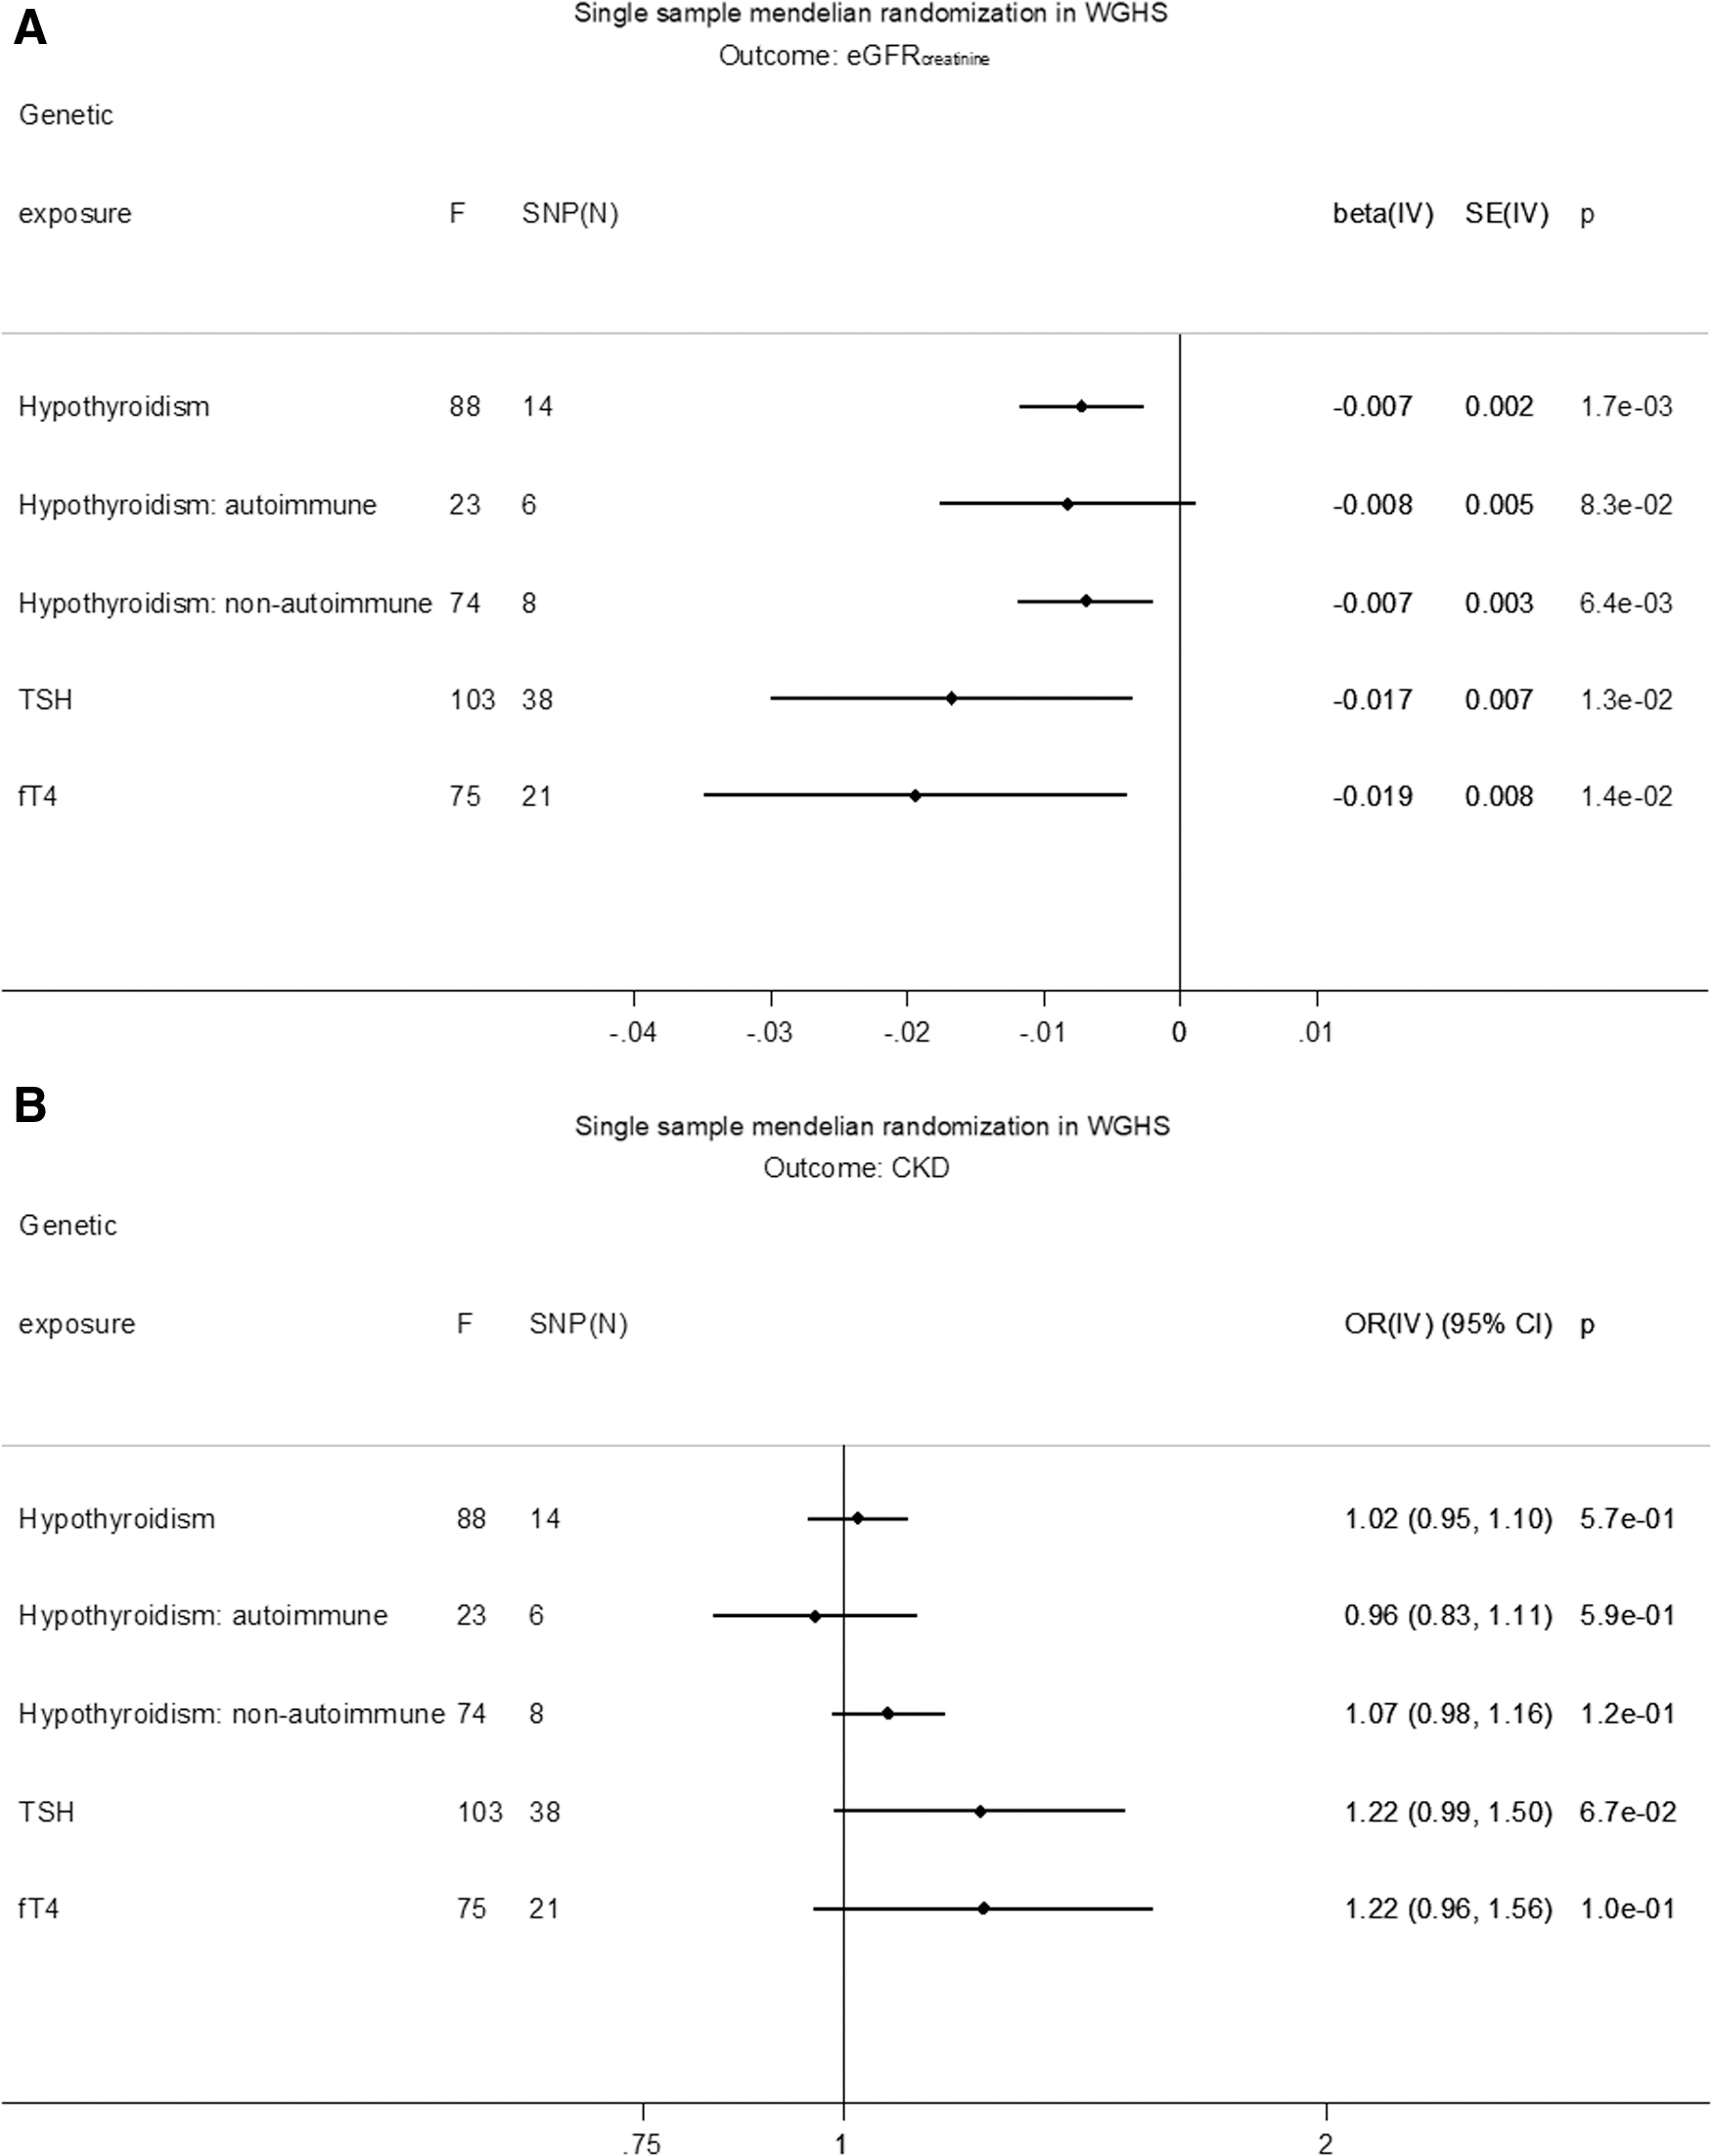
GRS associations with exposure, outcome, and covariates are shown in Supplementary Tables S4–S10. GRSs for hypothyroidism, TSH, fT4, eGFRcrea, and CKD were not associated with covariates, except for the GRS for eGFRcrea and total cholesterol, which was not significant after Bonferroni correction (Supplementary Table S4). In MR, hypothyroidism was associated with decreased eGFRcrea based on a GRS of all SNPs [beta (SE): −0.007 (0.002) ln(mL/min/1.73 m2), p = 1.7 × 10⁻³] (Fig. 2A). The association was similar for separate GRSs based on SNPs likely involved in either autoimmune [beta (SE): −0.008 (0.005), p = 8.3 × 10⁻²] or nonautoimmune functions [beta (SE): −0.007 (0.003), p = 6.4 × 10⁻³]. In MR, increased TSH in the reference range was associated with a decreased eGFRcrea [beta (SE): −0.018 (0.007) ln(mL/min/1.73 m2)/SD, p = 6.5 × 10⁻³], and increased fT4 in the reference range was associated with decreased eGFRcrea [beta (SE): −0.019 (0.008) ln(mL/min/1.73 m2)/SD, p = 0.01] (Fig. 2A). None of the thyroid measures associated with CKD in MR (Fig. 2B). Conversely, there was no MR association of eGFRcrea with hypothyroidism, TSH, or fT4 within the reference range (Supplementary Table S11). Similarly, there was no association of CKD with hypothyroidism [beta (SE): −0.31 (0.38), p = 0.41] or fT4 within the reference range [beta (SE): −0.21 (0.18), p = 0.25], and the association with TSH [beta (SE): −0.38 (0.18), p = 0.03] was not significant after Bonferroni correction (Supplementary Table S11).
(
Two-sample MR using CKDGen
Hypothyroidism predicting kidney function
Using the fixed-effects approach (IVW-FE), hypothyroidism was associated with a decrease in eGFRcrea [beta (SE): −0.004 (0.001) ln(mL/min/1.73 m2), p = 2.0 × 10⁻²²] based on all SNPs, with comparable estimates based on autoimmune SNPs and nonautoimmune SNPs [beta (SE), p: −0.003 (0.001), 5.2 × 10⁻⁷ d. −0.006 (0.001), 2.1 × 10⁻¹⁹] (Fig. 3A, Supplementary Tables S12 and S13, and Supplementary Fig. S2A, B). Using all SNPs, the IVW-RE, WM, and weighted mode estimates were similar and significant, but the regression dilution statistic (I 2 GX) in the MR-Egger regression was 0.85, indicating violation of NOME. However, using all SNPs, the heterogeneity in MR-Egger (I 2 = 0.92) and IVW-FE (I 2 = 0.93) was similar (Supplementary Table S14), indicating that MR-Egger was not a better fit to the data than IVW-FE. There was no evidence of horizontal pleiotropy influencing the estimates in that (a) the MR-Egger intercept was not significant (p = 0.34), (b) the MR-PRESSO outlier adjustment, which showed that even removing the instrument with the largest distorting effect, rs2396084 (at the VEGFA locus), did not result in a significantly different estimate [p(distortion test) = 0.14] (Supplementary Table S15), and (c) the funnel plot of individual SNP effects showed a symmetrical distribution around the overall IVW-FE effect estimate (Supplementary Fig. S2C).

(
Regarding other measures of kidney function, hypothyroidism was associated with eGFRcys in IVW-FE [beta (SE): −0.008 (0.003) ln(mL/min/1.73 m2), p = 0.007], but other MR methods were nonsignificant (Supplementary Fig. S3A–D). The MR-PRESSO distortion test for eGFRcys was significant (p < 0.001), indicating outsized influences for both rs3184504 (SH2B3) and rs2396084 (VEGFA) (Supplementary Tables S14 and S15). However, hypothyroidism based on autoimmune SNPs was associated with eGFRcys in IVW-FE [beta (SE): −0.017 (0.004) ln(mL/min/1.73 m2), p = 3.8 × 10⁻⁵] with similar and significant results for IVW-RE and WM, and with similar but nonsignificant results for weighted mode and MR-Egger (Supplementary Fig. S3A). Hypothyroidism based on nonautoimmune SNPs was not associated with eGFRcys in any models (Supplementary Fig. S3A).
Hypothyroidism was associated with an increase in CKD in IVW-FE (odds ratio, OR [confidence interval, CI]: 1.05 [1.03–1.08], p = 3.3 × 10⁻⁵, I 2 = 0.73) based on all SNPs (Fig. 3B and Supplementary Fig. S4A–C), with comparable estimates based separately on autoimmune SNPs (OR [CI]: 1.04 [1.01–1.08], p = 8.8 × 10⁻³) and nonautoimmune SNPs (OR [CI]: 1.06 [1.03–1.10], p = 9.3 × 10⁻⁴). Using all SNPs, the IVW-RE estimate was comparable and significant, whereas the WM or weighted mode was comparable but nonsignificant, and the MR-Egger not significant. There was no evidence (all p > 0.05) for an association between hypothyroidism and UACR (Supplementary Fig. S5A–D).
TSH and fT4 within the reference range predicting kidney function
Increased TSH within the reference range was associated with a decrease in eGFRcrea [beta (SE): −0.008 (0.001) ln(mL/min/1.73 m2)/SD, p = 6.8 × 10⁻¹⁷], with comparable estimates for IVW-RE, WM, and weighted mode, and comparable but not significant for MR-Egger (Supplementary Fig. S6A−D). TSH also associated with an increase in CKD in IVW-FE (OR [CI]: 1.10 [1.04–1.15], p = 3.1 × 10⁻⁴) and IVW-RE, with comparable but nonsignificant estimates for WM, weighted mode, and MR-Egger. However, there was no MR association of TSH with eGFRcys or UACR (Fig. 4A, B, and Supplementary Figs. S6A–S9C). fT4 within the reference range associated with an increase in eGFRcrea in IVW-FE [beta (SE): 0.004 (0.001) ln(mL/min/1.73 m2)/SD, p = 3.4 × 10⁻³] (Fig. 4A), but with noncomparable estimates in other analyses, and did not associate with eGFRcys, CKD, or UACR (Supplementary Figs. S10A–S13C and Supplementary Tables S14–S17).

(
TPOAb predicting kidney function
TPOAb were inversely associated with eGFRcrea with IVW-FE [beta (SE): −0.041 (0.009) ln(mL/min/1.73 m2)/SD, p = 6.2 × 10⁻⁶, I 2 = 0.83], with similar and significant estimates in IVW-RE and WM, and with a similar but nonsignificant estimate in weighted mode but not MR-Egger (Supplementary Figs. S14, S15A–C and Supplementary Tables S14, S15, and S18). TPOAb were also inversely associated with eGFRcys in IVW-FE [beta (SE): −0.294 (0.065) ln(mL/min/1.73 m2), p = 6.2 × 10⁻⁶, I 2 = 0.83], with a similar and significant estimate in IVW-RE (p = 0.02), and similar but nonsignificant estimates in WM and weighted mode (both p = 0.06), and nonsignificant for MR-Egger (Supplementary Figs. S14 and S16A–C). The MR-PRESSO distortion test was significant for TPOAb on eGFRcys (p < 0.001) for ATXN2 (rs653178) with an outlier-corrected estimate for eGFRcys of [beta (SE): −0.172 (0.036) ln(mL/min/1.73 m2)/SD, p = 4.0 × 10⁻²] (Supplementary Fig. S14 and Supplementary Tables S14 and S15). Increased TPOAb were associated with an increase in CKD (OR [CI]: 1.7 [1.06–2.74], p = 0.027) (Supplementary Fig. S17A−C), with comparable but nonsignificant estimates for IVW-RE, WM, weighted mode, and the MR-PRESSO outlier-corrected estimate, but nonsignificant for MR-Egger. TPOAb were not associated with UACR (Supplementary Fig. S18A−C).
Discussion
Using genetic analysis, we investigated the potential role of hypothyroidism in the development of decreased kidney function using the WGHS and summary statistics from the CKDGen. We found that genetically predicted hypothyroidism was associated with decreased eGFRcrea and an increased odds for CKD defined by eGFRcrea <60 mL/min/1.73 m2. Genetically predicted TSH within the reference range was associated with an increase in eGFRcrea in WGHS and CKDGen, and with an increase in CKD in CKDGen, with a similar but nonsignificant result in WGHS. There was no robust MR association of hypothyroidism or TSH with eGFRcys or UACR. In MR, fT4 in the reference range was inconsistently associated with kidney function in the WGHS and CKDGen. Using CKDGen summary statistics, genetically predicted TPOAb were associated with decreased eGFRcrea and eGFRcys but not with UACR. TPOAb were associated with increased CKD in some but not all analyses. In the reverse MR in the WGHS, eGFRcrea and CKD were not associated with hypothyroidism or either TSH or fT4 in the reference range.
For the association between hypothyroidism and decreased eGFRcrea, the observational analysis, the GRS-based MR in the WGHS, and the various MR methods in CKDGen (IVW, WM, and weighted mode) were all significant and in the same directions and with similar effects for autoimmune versus nonautoimmune instruments. These findings were strengthened by the MR association of TPOAb, a measure of autoimmune hypothyroidism, and TSH in the physiological range with kidney function. The finding is also consistent with the glomerular involvement seen in patients with Hashimoto's thyroiditis, an autoimmune thyroid disease (66). The power for fT4 should have been comparable with TSH, given the comparable samples contributing to the two GWASs. Given that both measures reflect thyroid function, it is therefore difficult to reconcile the TSH MR association with kidney function with the lack of an fT4 MR association. However, we note that the instruments for TSH and fT4 were different and that TSH may better represent thyroid function in as much as the TSH instruments are associated with TSH levels both outside and within the reference range, whereas the fT4 instruments are only associated with thyroid function within the reference range (44). Observational estimates in the WGHS also suggested an association between kidney and thyroid functions as in previous observational studies (14,24 –26), but neither genetically predicted eGFRcrea nor CKD was consistently associated with thyroid function.
Bidirectional MR may clarify directionality of associations from observational studies. We performed bidirectional MR analyses in the WGHS, but we could only perform the forward direction with the thyroid genetic instruments in two-sample analysis using CKDGen, due to lack of available genome-wide summary statistics for thyroid measures, which therefore prohibited formal assignment of effect direction with Steiger filtering analysis (67).
The hypothalamic/pituitary/thyroid axis represents a system of hormones dependent on each other through tight regulation. This vertical pleiotropy risks also being accompanied by horizontal pleiotropy that may have contributed to the high heterogeneity, for example, I 2 >0.50, in many analyses. However, the MR sensitivity analysis suggested that potential directional horizontal pleiotropy (i.e., consistent genetic effects on kidney not mediated by thyroid function) did not bias the findings, specifically due to SNPs at SH2B3 (rs3184504) and VEGFA (rs2396084) in the MR association of hypothyroidism with eGFRcys, and the SNP at ATXN2 (rs653178) for the MR association of TPOAb with eGFRcys. These SNPs are nevertheless interesting. Rrs3184504 at SH2B3 (encoding SH2B adaptor protein 3), neighboring and in high linkage disequilibrium (LD) (R 2 > 0.9) with rs653178 at ATXN2, is highly pleiotropic and also associated with systolic and diastolic blood pressure, fibrinogen, red and white cell traits, platelet count, and cardiovascular disease, strongly suggesting the potential to affect kidney function through mechanisms other than thyroid function (68). Rs2396084 near VEGFA was strongly associated with both TSH in the reference range and hypothyroidism in previous GWAS (41,42), and was also GWAS significant for decreased eGFRcrea, decreased eGFRcys, risk of CKD, and decreased UACR after accounting for multiple testing (49,52,53), and therefore unsuitable as an MR instrument as revealed by the MR-PRESSO analysis. It is possible that variation at the VEGFA locus influences vascular development in a way that creates susceptibilities to dysfunction for both thyroid and kidney. For example, genetic variants in the VEGFA gene have been associated with vasculitis that in some settings may be exacerbated by an autoimmune response that may underlie hypothyroidism (69).
Associations between exposures and outcomes may not always be linear. Recent developments in MR statistical methodology include exploration of nonlinear associations by approximating associations as linear within piecewise ranges of a continuous exposure (70). Implicitly, this was also our approach by leveraging separate instruments from a separate GWAS for the reference ranges of fT4 and TSH (euthyroid individuals) and for hypothyroidism (elevated TSH). It was not possible to explore nonlinearity in the MR for anti-TPO GWAS because separate ranges of this biomarker are not available.
The power to detect small differences increases with a larger sample size. The CKDGen was 20 times larger than WGHS and thus had a greater power to detect smaller differences in kidney function explained by the genetic variants compared with WGHS. For hypothyroid, TSH, and fT4 SNPs, the power was above 80% and the precision better with narrower CIs for eGFRcrea and CKD in the larger CKDGen compared with WGHS. We also note that the significant MR point estimates for TPOAb predicting eGFRcrea and eGFRcys differed in the IVW-RE/FE analysis even though the two measures are estimating the same aspect of kidney function, that is, GFR. The estimates for eGFRcys generally had wider CIs compared with the eGFRcrea estimates because the GWAS sample for eGFRcys was substantially smaller than for eGFRcrea. In the sensitivity analysis, these CIs overlapped the estimates for eGFRcrea, possibly reconciling the different primary estimates of TPOAb effects.
Despite leveraging some of the best powered samples and data sets available, misclassification remains a potential limitation. The diagnosis of hypothyroidism in both the WGHS and for the GWAS summary statistics was either by self-reporting (41) or by TSH cutoff (44), but not ICD-coding or physician verified. Thus, with either method it was not possible to uniformly distinguish subclinical from overt hypothyroidism, and there is a risk of misclassification. It was also not possible to investigate Hashimoto's thyroiditis directly in this MR study, as only one GWAS article has addressed Hashimoto's disease (71), finding only one SNP in PTPN22 (rs2476601) that was also GWAS significant for Graves' disease and in complete LD (R 2, and D2 = 1) with the SNP (rs6679677) we included for hypothyroidism. Larger GWASs need to be performed for these autoimmune diseases. However, we stratified into autoimmune (including the variant in PTPN22) versus nonautoimmune instruments, thereby potentially addressing hypothyroidism due to Hashimoto's thyroiditis somewhat. Similarly, in assessing CKD, we used the same definition in the WGHS as was used by CKDGen, namely eGFRcrea <60 mL/min/1.73 m2, but this definition was not based on kidney disease verified by a nephrologist or ICD-codes.
Hypothyroidism is more common in women than in men (72). While we did not investigate sex differences, the eGFR measure used to derive the CDKGen summary statistics is already sex adjusted, the WGHS included only women, and there were no sex differences for the TSH and fT4 GWAS SNPs published by Teumer et al. (44), all supporting generalizability of our findings in both men and women. However, the GWAS SNPs for hypothyroidism or TPOAb were not assessed for sex differences (41,46).
In summary, bidirectional MR supports the direction of the association of hypothyroidism and increased TSH with decreased eGFRcrea and increased CKD, but not vice versa.
Footnotes
Authors' Contributions
D.I.C. and P.M.R. collected the data in the WGHS. S.M. collected information on thyroid function in the WGHS. C.E. and D.I.C. designed the present study. C.E. and D.I.C. analyzed the data. C.E. made the figures and tables. C.E. and D.I.C. drafted the article. All authors revised the article. All authors approved the final version of the article. Data from CKDGen were publicly available.
Acknowledgments
The corresponding authors had full access to all the data in the study and had final responsibility for the decision to submit for publication. We gratefully acknowledge Dr. Alexander Teumer for facilitating access to summary statistics for thyroid measures as well as for insights into the genetic analysis of both thyroid and kidney function.
Author Disclosure Statement
No competing financial interests exist.
Funding Information
The Women's Genome Health Study (WGHS) is supported by the National Heart, Lung, and Blood Institute (HL043851 and HL080467) and the National Cancer Institute (CA047988 and UM1CA182913), with collaborative scientific support and funding for genotyping provided by Amgen. Additional funding was also provided to Dr. Mora by an investigator-initiated grant from Atherotech Diagnostics (for thyroid measurements), the National Heart, Lung, and Blood Institute by R01HL134811 and K24 HL136852, and the National Institute of Diabetes and Digestive and Kidney Diseases (DK112940). The funding sources did not have any influence on the study design, analyses, interpretation of data, writing of the article, or the decision to submit the article for publication. S.M. received investigator-initiated institutional research grant from Atherotech Diagnostics to measure the thyroid function in the WGHS.
Supplementary Material
Supplementary Data
Supplementary Figure S1
Supplementary Figure S2
Supplementary Figure S3
Supplementary Figure S4
Supplementary Figure S5
Supplementary Figure S6
Supplementary Figure S7
Supplementary Figure S8
Supplementary Figure S9
Supplementary Figure S10
Supplementary Figure S11
Supplementary Figure S12
Supplementary Figure S13
Supplementary Figure S14
Supplementary Figure S15
Supplementary Figure S16
Supplementary Figure S17
Supplementary Figure S18
Supplementary Table S1
Supplementary Table S2
Supplementary Table S3
Supplementary Table S4
Supplementary Table S5
Supplementary Table S6
Supplementary Table S7
Supplementary Table S8
Supplementary Table S9
Supplementary Table S10
Supplementary Table S11
Supplementary Table S12
Supplementary Table S13
Supplementary Table S14
Supplementary Table S15
Supplementary Table S16
Supplementary Table S17
Supplementary Table S18