
Abstract
Background:
A greater decrease in 24-hour energy expenditure (EE) during fasting and a smaller increase in 24-hour EE during low-protein overfeeding (metabolic “thrifty” phenotype) predict weight gain. As thyroid hormones (TH) are implicated in energy intake and metabolism, we assessed whether: (i) TH concentrations are altered by 24-hour fasting or overfeeding diets with varying protein content and (ii) diet-related changes in TH correlate with concomitant changes in EE.
Methods:
Fifty-eight euthyroid healthy subjects with normal glucose regulation underwent 24-hour dietary interventions including fasting, eucaloric feeding, and five overfeeding diets in a crossover design within a whole-room indirect calorimeter to measure the 24-hour EE. Overfeeding diets (200% of energy requirements) included three diets with 20% protein, one diet with 3% protein (low-protein overfeeding diet [LPF]: 46% fat), and one diet with 30% protein (high-protein overfeeding diet [HPF]: 44% fat, n = 51). Plasma free thyroxine (fT4), free triiodothyronine (fT3), and fibroblast growth factor 21 (FGF21) concentrations were measured after overnight fast the morning of and after each diet.
Results:
On average, fT4 increased by 8% (+0.10 ng/dL, 95% confidence interval [CI 0.07–0.13], p < 0.0001) and fT3 decreased by 6% (−0.17 pg/mL [CI −0.27 to −0.07], p = 0.001) after 24-hour fasting, whereas both fT4 and fT3 decreased by 5% (−0.07 ng/dL [CI −0.11 to −0.04], p < 0.0001) and 4% (−0.14 pg/mL [CI −0.24 to −0.04], p = 0.008) following HPF, respectively. Greater decreases in fT3 after HPF are associated with larger decreases in FGF21 (r = 0.40, p = 0.005). Following LPF, the mean fT3 increased by 6% (+0.14 pg/mL [CI 0.05–0.2], p = 0.003) with no change in fT4 (p = 0.7). No changes in TH were observed after normal-protein overfeeding diets (all p > 0.1). No associations were observed between TH concentrations and diet-related changes in 24-hour EE during any diet (all p > 0.07).
Conclusions:
Acute (200%) short-term (24 hours) changes in food intake induce small changes in TH concentrations only after diets with low (0% fasting and 3% protein overfeeding) or high (30% protein overfeeding) protein content. The fT3-FGF21 association after high-protein overfeeding suggests a role for TH in inhibiting FGF21 secretion by the liver during protein excess. These results indicate that TH are involved in protein metabolism; however, they do not mediate the short-term EE response to diets that characterize the metabolic phenotypes and determine the individual susceptibility to weight gain.
Introduction
The global prevalence of obesity and its related comorbidities has risen substantially over the past decades (1) due to a persistent imbalance between energy intake and energy expenditure (EE) as a result of increased food intake or reduced physical activity. The difference in the propensity to weight gain among individuals may depend on both environmental and genetic factors that influence the two components of daily energy balance. Among these factors, the ability to increase EE in response to overeating, namely the diet-induced thermogenesis (2), has been recently proposed to be a novel determinant of weight change (3). Dietary interventions such as 24-hour overfeeding or fasting lead to EE responses with a wide interindividual variability that characterizes thrifty versus spendthrift metabolic phenotypes (4). Compared with subjects who are more metabolically “spendthrift,” subjects with a “thrifty” metabolism have a greater propensity to weight gain, which is associated with an impaired capacity to dissipate the excess energy during overeating and increased capacity to save energy during fasting (4 –6). Thrifty and spendthrift metabolic phenotypes can be characterized by the magnitude of short-term (24-hour) EE responses to fasting, as well as overfeeding a high-carbohydrate and a low-protein diet (6). Notably, a greater decrease in 24-hour EE during fasting, a lower increase in 24-hour EE during low-protein overfeeding, and a greater increase in 24-hour EE during high-carbohydrate overfeeding predict greater weight gain after 6 months in free-living conditions (6). The hepatically secreted hormone, fibroblast growth factor 21 (FGF21), increases acutely after a low-protein overfeeding diet, mediates the diet-related change in EE, and predicts interindividual variability in free-living weight change (7). Furthermore, FGF21 may interact with thyroid hormones (TH) due to their similarities in metabolic functions (8,9). Triiodothyronine (T3) can induce changes in whole-body energy metabolism similar to those exerted by FGF21 (10). In the liver, the major organ where FGF21 is primarily secreted into the circulation in humans, TH receptors (β isoform) play a role in mediating the majority of actions of T3 (11), and FGF21 has emerged as a novel hepatic regulator mediating glucose homeostasis and lipid oxidation (LIPOX) (9). In mice, it has been recently shown that the active form of TH, T3, plays a role in regulating fgf21 expression (12). Whether changes in TH may affect circulating FGF21 concentrations in humans is not known.
TH have been implicated in the metabolic pathways that control energy balance by influencing energy storage and EE (13,14) and are involved in maintaining basal metabolism (15) by increasing ATP (adenosine triphosphate) synthesis for metabolic processes and by generating ion gradients (16 –18). Human studies investigating the effects of short-term dietary interventions such as overfeeding or fasting on TH concentrations are limited and results are mixed. Serum T3 concentrations, but not thyroxine (T4) (19,20), increase after short-term overfeeding regardless of dietary macronutrient content (carbohydrates 82%, fat 74%, and protein 71%) (19). Total T3 decreases and reverse triiodothyronine (rT3) increases with fasting (21,22). During caloric restriction, T3 concentrations decrease along with a slight increase in T4 possibly as a compensatory mechanism to maintain energy stores in a setting of increased EE or decreased food intake (21,23,24).
Whether 24-hours of fasting or overfeeding diets with differing macronutrient content acutely affect circulating TH concentrations and any diet-related changes in TH concentrations correlate with the changes in 24-hour EE following these dietary interventions is not known. Thus, we sought to evaluate whether 24 hours of fasting and five different overfeeding diets alter TH concentrations and whether any of these changes are associated with changes in FGF21 concentrations and mediate the EE responses to these diets.
Methods and Study Design
Study volunteers
This analysis was performed using data from an ongoing clinical trial (
Upon admission to the clinical research unit, individuals were fed a weight-maintaining diet (WMD; 50% carbohydrate, 30% fat, and 20% protein) with a caloric intake calculated using unit-specific equations based on sex and weight (25). Body weight was recorded daily and was maintained within 1% of the admission weight by adjusting the WMD. On the second day of admission, dual-energy X-ray absorptiometry (DPX-1; Lunar Corp, Madison, WI) was used to assess body composition, with fat mass (FM) and fat-free mass (FFM) calculated from percentage body fat (%fat). An oral glucose tolerance test (OGTT) was performed after 3 days on the WMD, and only subjects with normal glucose regulation based on the American Diabetes Association criteria (26) continued the study. All the participants signed written and informed consent before admission. The study was approved by the institutional review board of the National Institute of Diabetes and Digestive and Kidney Diseases (NIDDK), National Institutes of Health.
EE measurements
The assessment of 24-hour EE and respiratory quotient (RQ) (an index of substrate oxidation) inside the whole-room indirect calorimeter was previously described in detail (27) (Supplementary Data). Briefly, after an overnight fast and following breakfast (7 am), subjects entered the calorimeter around 8 am. During each dietary intervention, three meals were provided to the subjects through an airtight interlock at 11 am, 4 pm, and 7 pm. Uneaten food was returned and weighed in the metabolic kitchen to determine the actual energy intake during each 24-hour session. The air temperature was maintained constant at 23.7 ± 1.4°C by an air conditioning system. Volunteers resided in the calorimeter for 23.25 hours, during which both carbon dioxide (CO2) production and oxygen (O2) consumption were recorded every minute, averaged, and extrapolated to 24 hours. Quality control assessments were performed monthly and demonstrated average recoveries of 98 ± 3% (coefficient of variation [CV] = 3.4%) and 99 ± 3% (CV = 3.6%) for CO2 and O2, respectively. The 24-hour RQ was calculated as the ratio of 24-hour CO2 production to 24-hour O2 consumption, and the 24-hour EE was calculated using Lusk's equation (28). Carbohydrate oxidation (CARBOX) and LIPOX rates were derived from the 24-hour RQ, after accounting for protein oxidation (PROTOX), which was estimated from measurement of 24-hour urinary nitrogen excretion (29).
Dietary interventions
The experimental protocol for dietary interventions (Supplementary Data; Supplementary Fig. S2) was previously described in detail (27). Briefly, two 24-hour EE measurements were performed to precisely measure EE in energy balance conditions inside the whole-room calorimeter. During the first 24-hour session, the caloric intake of WMD was reduced by 20% to account for reduced activity inside the metabolic chamber; subsequently, the second 24-hour session was performed 2 days later when the energy intake was set to the 24-hour EE value from the first assessment. The 24-hour EE value from the second session was considered the baseline EE (28). The baseline 24-hour EE was doubled to determine the energy intake of overfeeding diets. In a random order, subjects underwent six 24-hour EE assessments (fasting and five overfeeding diets) in the whole-room indirect calorimeter with 3-day washout period between each intervention on the WMD. The 200% overfeeding diets (Supplementary Fig. S3) included one diet with low-protein overfeeding diet content (LPF: 3% protein, 51% carbohydrate, and 46% fat), one diet with a high-protein overfeeding diet (HPF: 30% protein, 44% fat, and 26% carbohydrate, n = 51), and three overfeeding diets with normal protein content (20%): standard (50% carbohydrate and 30% fat), high-carbohydrate (75% carbohydrate and 5% fat), and high-fat (60% fat and 20% carbohydrate) overfeeding diet. Available data for HPF are limited to only 51 individuals as this diet was added to the protocol only after 20 subjects completed the initial study.
During 24-hour fasting, only water was permitted. Sessions when subjects consumed <95% of energy intake provided with the overfeeding diets were excluded from data analysis.
Hormone measurements
During admission, TSH was measured by a homogeneous sandwich chemiluminescent immunoassay based on LOCI® technology from Dimension Vista® 500 System (Siemens). Blood for measurements of plasma free triiodothyronine (fT3), free thyroxine (fT4), and FGF21 concentrations was collected in the morning after an overnight fast both before and upon exit the whole-room indirect calorimeter during each dietary intervention. Plasma samples were collected in ethylenediamine tetraacetic acid-containing tubes and stored in a freezer at −70°C for later measurements of hormones by the NIDDK Core Laboratory (Bethesda, MD). Plasma fT4 and fT3 concentrations were measured using the EIA Kit (Phoenix Pharmaceuticals, Burlingame, CA). Intra-assay and inter-assay CVs were 3.0% and 4.5% for fT3, and 2.8% and 4.0% for fT4, respectively. Plasma FGF21 concentrations were measured by ELISA (R&D Systems, Minneapolis, MN). The intra-assay CV was 2.5% and the inter-assay CV was 5.2%.
Due to changes in fT4 and fT3 mean concentrations observed after the 24-hour fasting, HPF, and LPF, plasma samples of these dietary interventions were used for measurements of TSH and rT3. Plasma TSH concentration was measured using the EIA Kit (Phoenix Pharmaceuticals). Intra-assay and inter-assay CVs were 5.4% and 7.7%, respectively. Plasma rT3 was measured using the competitive ELISA Kit (ALPCO, Salem, NH). Intra-assay and inter-assay CVs were 8.7% and 11.9%, respectively. Insulin concentrations during the OGTT were measured by an Automated Immunoenzymometric Assay (Tosoh Bioscience, Inc., Tessenderlo, Belgium).
Statistical analysis
Data are presented as mean with standard deviation or as geometric mean with its 95% confidence interval (CI) as appropriate. For each hormone, the CV and intra-class correlation coefficient (ICC) were calculated for all the fasting prechamber measurements to assess precision and reproducibility. All the fasting hormone concentrations measured before entering the calorimeter were then averaged in each subject and used as baseline value to determine interindividual differences according to sex and race/ethnicity by unpaired t-test and analysis of variance, respectively. Fasting rT3 and TSH data were log10 transformed before analyses to meet the assumptions of linear regression (i.e., homoscedasticity and normal distribution). The Spearman correlation was used to assess the effect of storage time on hormone measurements. The Pearson correlation index was used to quantify the relationships between hormone concentrations and body composition measures. Multiple linear regression analysis was used to assess the determinants of TH. The individual change (Δ) in hormone concentrations after each diet was calculated as the difference between the post-diet minus the pre-diet absolute values and analyzed by paired t-test. The relationships between changes in hormone concentrations and diet-induced changes in the 24-hour EE were quantified by the Pearson correlation. The individual changes in TH concentrations were analyzed via mixed-model analysis including all diets and accounting for repeated measurements within a subject using a compound symmetry covariance structure.
Linear models with the 24-hour RQ, 24-hour EE, and its components as dependent variables and as covariates were calculated to evaluate the effect of each hormone on metabolic measures during each dietary intervention. Linear regression analysis was used to calculate residuals of RQ, EE, and its components after adjustment for known covariates (30).
Results
Baseline characteristics of the study population are shown in Table 1. Fasting plasma TSH, fT4, fT3, and rT3 concentrations were not affected by storage time (p = 0.09, p = 0.15, p = 0.10, and p = 0.12, respectively).
Demographic, Anthropometric, and Metabolic Characteristics of the Study Group
Data are presented as mean ± standard deviation (minimum, maximum), except for TSH, which is shown as median with IQR (minimum, maximum). Fasting plasma fT4 and fT3 were obtained by averaging all fasting pre-diets measurements.
TSH concentration as measured on the first day of admission.
p < 0.05 versus women by Student's unpaired t-test or χ2 test as appropriate.
BLK, black; BMI, body mass index; EE, energy expenditure; FFM, fat free mass; FM, fat mass; fT3, free triiodothyronine; fT4, free thyroxin; HIS, Hispanic; IQR, interquartile range; NAM, Native American; OGTT, oral glucose tolerance test; RQ, respiratory quotient; TSH, thyrotropin; WHT, white.
The CVs and ICCs of baseline values were 21%, 9.5%, 7%, and 17.7% and 0.87, 0.79, 0.69, and 0.62 (all p < 0.001) for TSH, fT4, fT3, and rT3, respectively, indicating good precision and within-subject consistency of hormone measurements.
Fasting plasma fT4 concentration was on average lower in women than in men (Δ = −0.14 ng/dL [CI −0.27 to −0.01], p = 0.03; Fig. 1A) and in blacks compared with Caucasians (p = 0.02) and Hispanics (p = 0.03) (global p = 0.03; Fig. 1B). In a multivariable model, only age (older individuals had lower fT4 by 0.15 ng/dL [−0.22 to −0.06] per 20 years difference, p = 0.001) and race/ethnicity (blacks had a 0.12 ng/dL [−0.23 to −0.01] lower concentration compared with other ethnicities, p = 0.03), but not FM, FFM, or percentage body fat (PFAT) (all p > 0.05), were independent determinants of fasting fT4 concentration (total R 2 = 0.34).

Sex and race/ethnic differences on plasma fT4 and fT3 concentrations. (
Fasting plasma fT3 concentrations were also lower in women compared with men (Δ = −0.59 pg/mL [CI −0.86 to −0.34], p < 0.001; Fig. 1C) but did not differ by race/ethnicity (p = 0.20; Fig. 1D). Both age (older individuals had lower fT3 by 0.25 pg/mL [−0.40 to −0.06] per 20 years difference, p = 0.01) and sex (men had higher fT3 concentrations by 0.81 pg/mL [0.39–1.24] compared with women, p < 0.001), but not FM, FFM, or PFAT (all p > 0.05), were independent determinants of fasting fT3 concentration (total R 2 = 0.45). Fasting plasma fT4 and fT3 concentrations were not associated with fasting glucose, 2-hour glucose, fasting insulin, or 2-hour insulin during OGTT (all p > 0.2).
Changes in TH concentrations after 24-hour dietary interventions
The changes in TH concentrations after each dietary intervention are reported in Table 2. Plasma TH concentrations varied only following 24-hour fasting, high-protein overfeeding, and low-protein overfeeding (also after adjustment for multiple comparisons, see legend of Fig. 2), whereas no changes were found after normal-protein overfeeding diets (Fig. 2). The fT4 and fT3 concentrations before and after each diet are shown in Supplementary Figures S4 and S5, respectively.
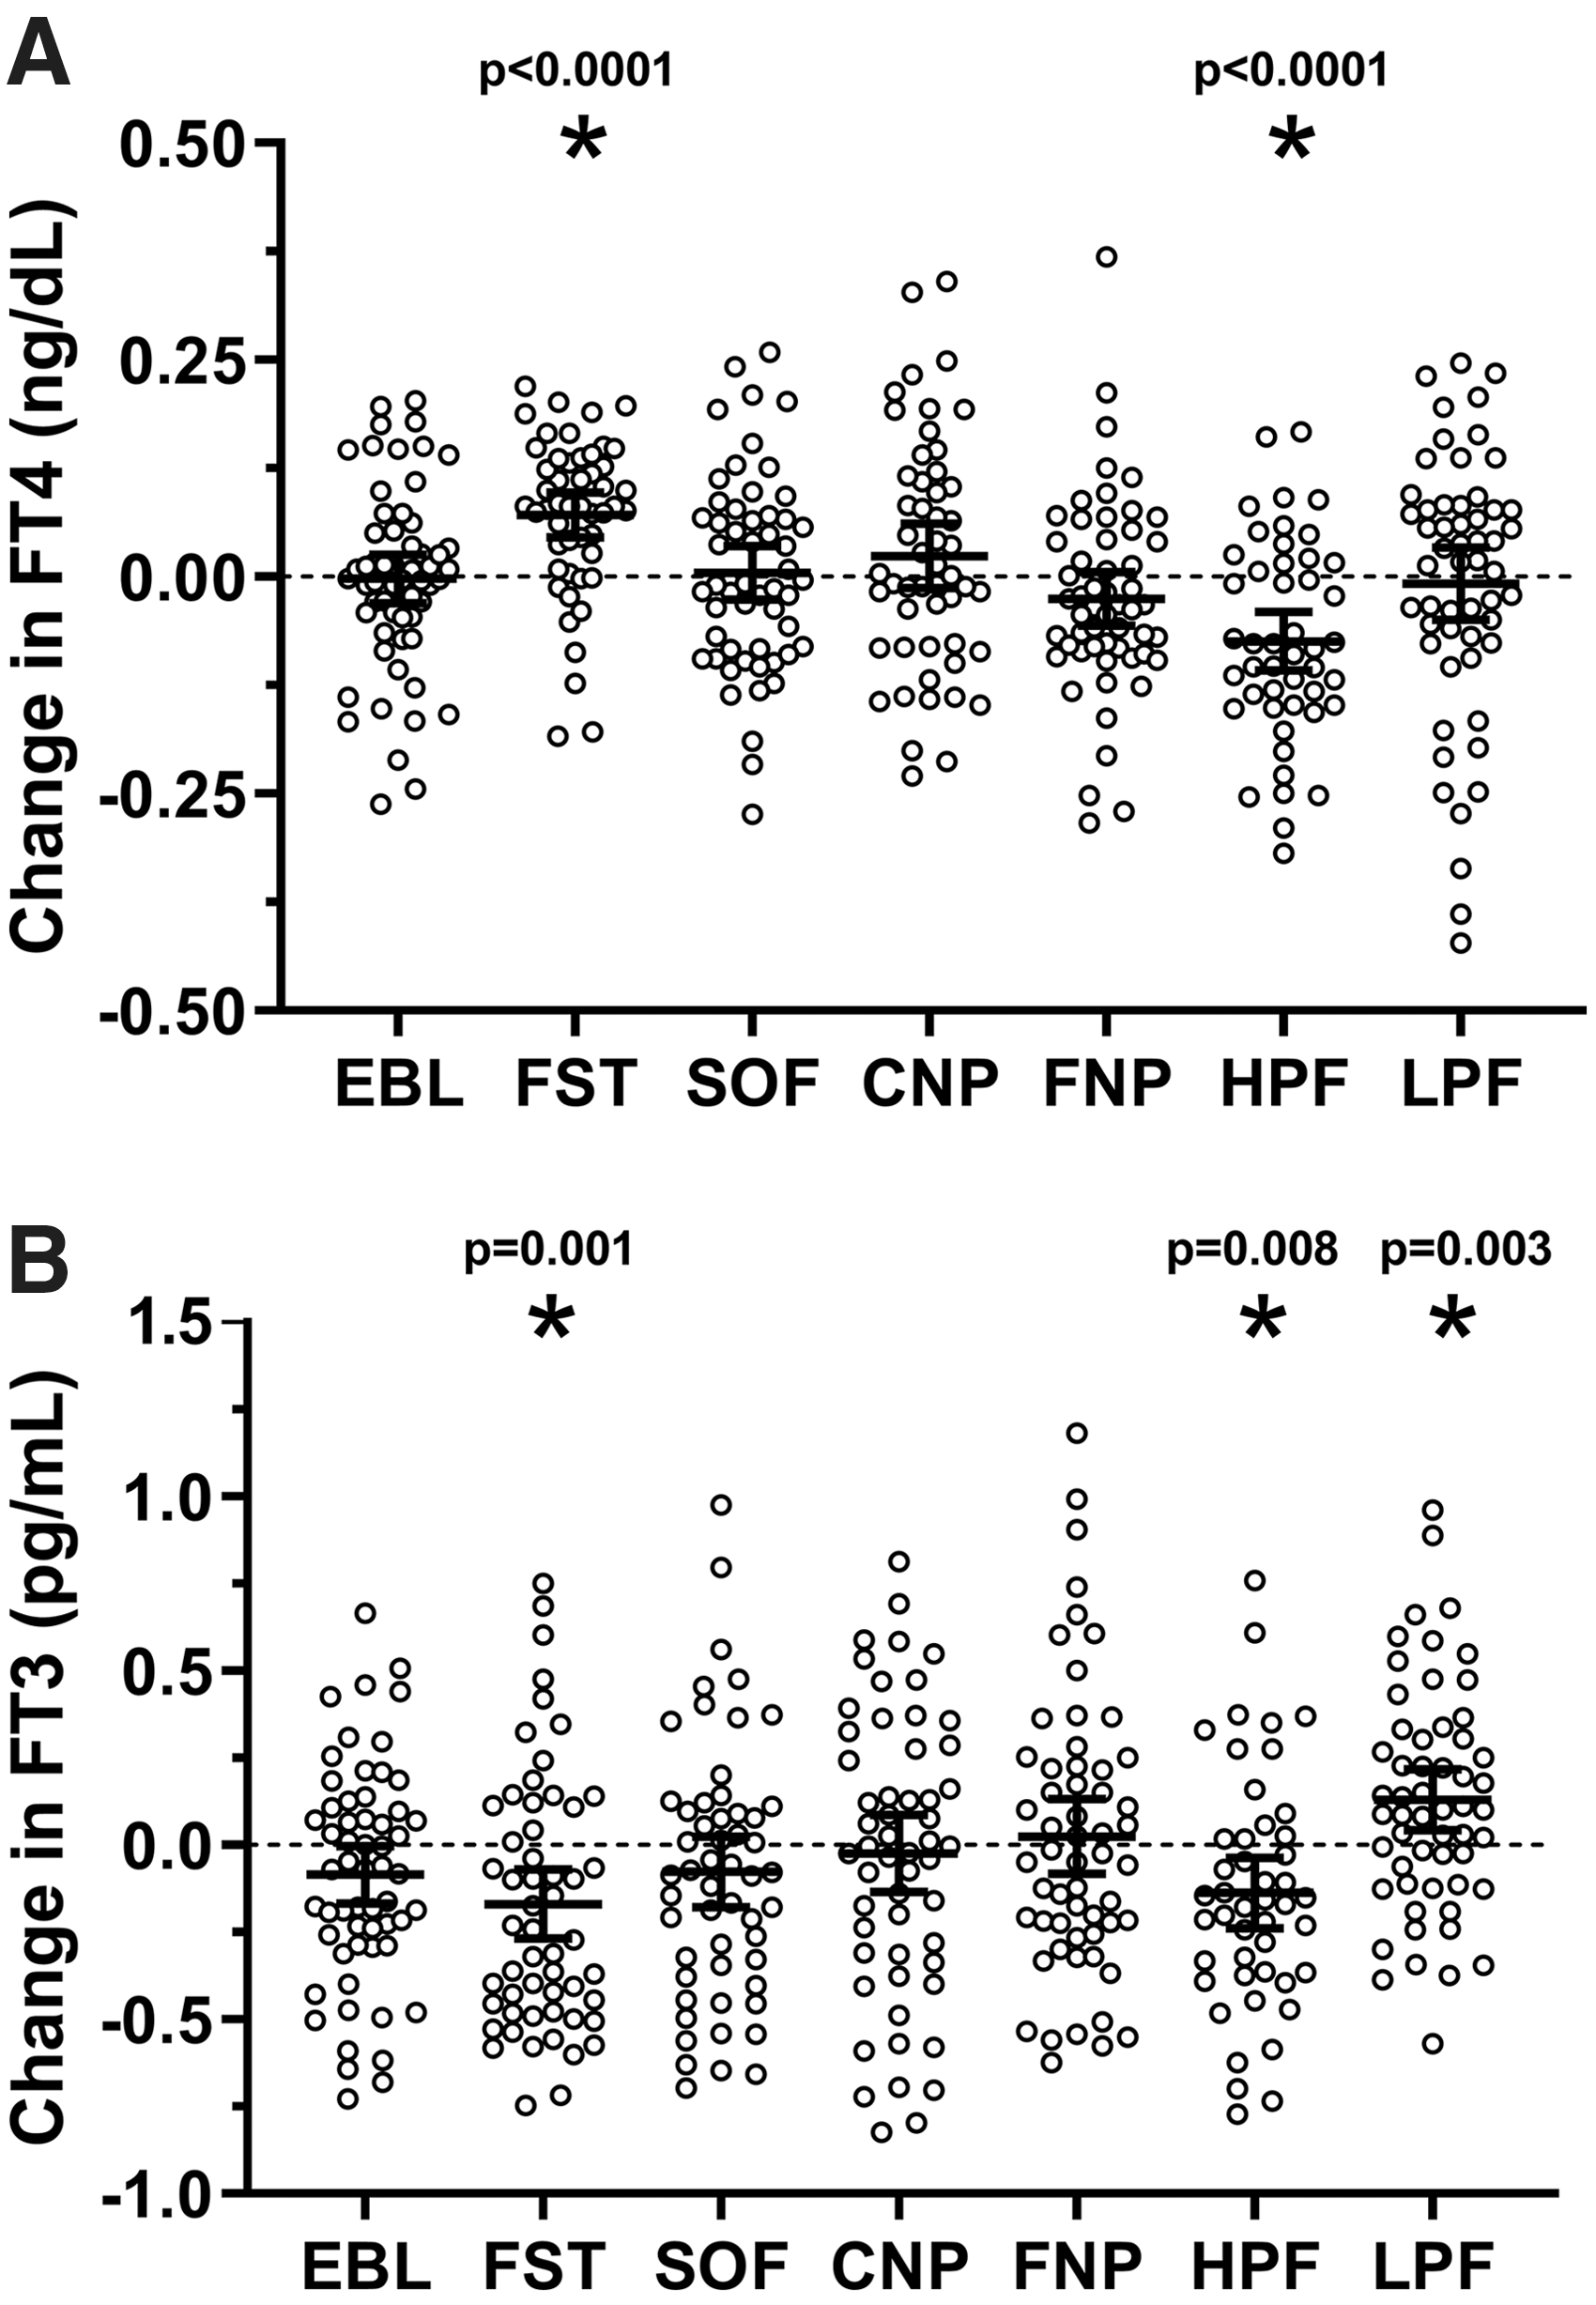
Changes in plasma fT4 and fT3 concentrations after each 24-hour dietary intervention. (
Hormone Concentrations Before and After Each Dietary Intervention
Bold values indicate p < 0.05.
Plasma fT3 and fT4 concentrations are expressed as mean with its 95% CI. Plasma TSH, plasma rT3, and plasma FGF21 concentrations are expressed as geometric mean with its 95% CI, but their absolute changes are reported as arithmetic mean with its 95% CI. Percent changes in fT3 and fT4 were calculated as the average absolute change divided by the average pre-diet absolute value, whereas percent changes in TSH and rT3 were calculated as the ratio of geometric means ( = post-diet/pre-diet). p-Values were calculated by Student's paired t-test. The caloric intake of overfeeding diets was calculated as twice the 24-hour energy expenditure during energy balance. Dietary composition: SOF (50% carbohydrate, 30% fat, 20% protein), CNP (75% carbohydrate, 5% fat, 20% protein), FNP (20% carbohydrate, 60% fat, 20% protein), HPF (26% carbohydrate, 44% fat, 30% protein), and LPF (51% carbohydrate, 46% fat, 3% protein).
CI, confidence interval; CNP, high-carbohydrate overfeeding; EBL, energy balance; FGF21, fibroblast growth factor 21; FNP, high-fat overfeeding; FST, 24-hour fasting; HPF, high-protein overfeeding diet; LPF, low-protein overfeeding diet; rT3, reverse triiodothyronine; SOF, standard overfeeding.
Fasting
After 24-hour fasting, both plasma fT4 and rT3 concentrations increased on average by 8% (Δ = +0.10 ng/dL [CI 0.07–0.13], p < 0.0001; Fig. 2A) and by 16% (Δ = +0.03 ng/mL [CI 0.01–0.04], p = 0.0004), respectively, whereas plasma fT3 and TSH concentrations decreased on average by 6% (Δ = −0.17 pg/mL [CI −0.27 to −0.07], p = 0.001; Fig. 2B) and by 43.3% (Δ = −1.75 μIU/mL [CI −2.16 to −1.35], p < 0.0001), respectively. No associations were observed between the change in plasma FGF21 concentration after 24-hour fasting and concomitant changes in plasma TH concentrations (all p > 0.2).
Low-protein overfeeding diet
After low-protein overfeeding, plasma TSH decreased on average by 16% (Δ = −0.76 μIU/mL [CI −0.35 to −1.17], p = 0.0002), whereas mean plasma fT4 was unchanged (p = 0.7; Fig. 2A). Plasma fT3 increased on average by 6% (Δ = +0.14 pg/mL [CI 0.05–0.22], p = 0.003; Fig. 2B) with no change in mean rT3 concentration (p = 0.08). No associations were observed between the increase in FGF21 after low-protein overfeeding and changes in TSH (p = 0.08), fT4 (p = 0.06), fT3 (p = 0.38), or rT3 (p = 0.6).
High-protein overfeeding diet
After high-protein overfeeding, plasma TSH decreased on average by 13% (Δ = −0.40 μIU/mL [CI −0.20 to −0.04], p = 0.004). Similarly, both plasma fT4 and fT3 concentrations decreased on average by 5% (Δ = −0.07 ng/dL [CI −0.11 to −0.04], p < 0.0001; Fig. 2A) and 4% (−0.14 pg/mL [CI −0.24 to −0.04], p = 0.008; Fig. 2B), respectively, with no change in mean plasma rT3 (p = 0.7). The changes in fT4 concentration following high-protein overfeeding did not differ by race/ethnicity or sex (all p > 0.2). The change in FGF21 after high-protein overfeeding was positively associated with the change in fT3, such that a larger decrease in FGF21 correlated with a greater decrease in fT3 (r = 0.40, p = 0.005; Fig. 3). No associations were observed between changes in FGF21 and changes in TSH (p = 0.5), fT4 (p = 0.9), or rT3 (p = 0.8).

Relationships between the change in fasting plasma fT3 concentration and the change in FGF21 concentration after 24-hour high-protein, FNP diet. The individual change in hormone concentrations on each axis was calculated as the difference between the post-diet minus the pre-diet absolute values. The strength of association was quantified by the Pearson correlation index (r) and the coefficient of determination (R 2). Diet composition of high-protein, FNP diet (200% daily energy requirements): 26% carbohydrate, 44% fat, 30% protein. The sample size includes 44 subjects (35 men and 9 women) with available measurements of FGF21 and fT3before and after 24-hour HPF. FGF21, fibroblast growth factor 21.
The individual changes in fT4 after HPF and LPF were correlated within a subject, such that a greater decrease in fT4 following HPF was associated with a decrease following LPF (r = 0.43, p = 0.003; Supplementary Fig. S6A). Similarly, a greater decrease in fT3 following HPF correlated with a decrease in fT3 following LPF (r = 0.42, p = 0.005; Supplementary Fig. S6B). No associations were observed between the changes in TH after 24-hour fasting and low-/high-protein overfeeding (all p > 0.1).
Relationships between TH and EE measures
As we have previously reported in this cohort, the 24-hour EE increased from eucaloric conditions during each overfeeding diet, with the largest increases during high-carbohydrate normal-protein overfeeding (Δ = +14% [CI 12%–15%], p < 0.001) and high-protein overfeeding (Δ = +14% [CI 11%–16%], p < 0.001) and the smallest increase during LPF (Δ = +3% [CI 2%–4%], p < 0.001), whereas a reduction in 24-hour EE was observed during 24-hour fasting (Δ = −8% [CI −9% to −6%], p < 0.001). No associations were observed between changes in plasma fT4 or fT3 concentration and 24-hour RQ, CARBOX, LIPOX, or PROTOX during fasting, low-, or high-protein overfeeding (all p > 0.07; Supplementary Table S1). However, fasting plasma fT3 concentration measured before eucaloric feeding was negatively correlated with residual RQ (i.e., 24-hour RQ after adjustment for its known determinants via regression analysis), such that a lower plasma fT3 was associated with relatively higher RQ during energy balance (β = −0.03 per pg/mL difference in fT3 [CI −0.05 to −0.01], p = 0.003; Fig. 4A), higher CARBOX (β = −231.4 kcal/day [CI −368.7 to −94.1] p = 0.001; Fig. 4B), and lower LIPOX (β = +217.0 kcal/day [CI 46.1–388.0], p = 0.01; Fig. 4C) and PROTOX (β = +54.8 kcal/day [CI −0.8 to 110.5], p = 0.05; Fig. 4D) after adjustment for their known determinants.
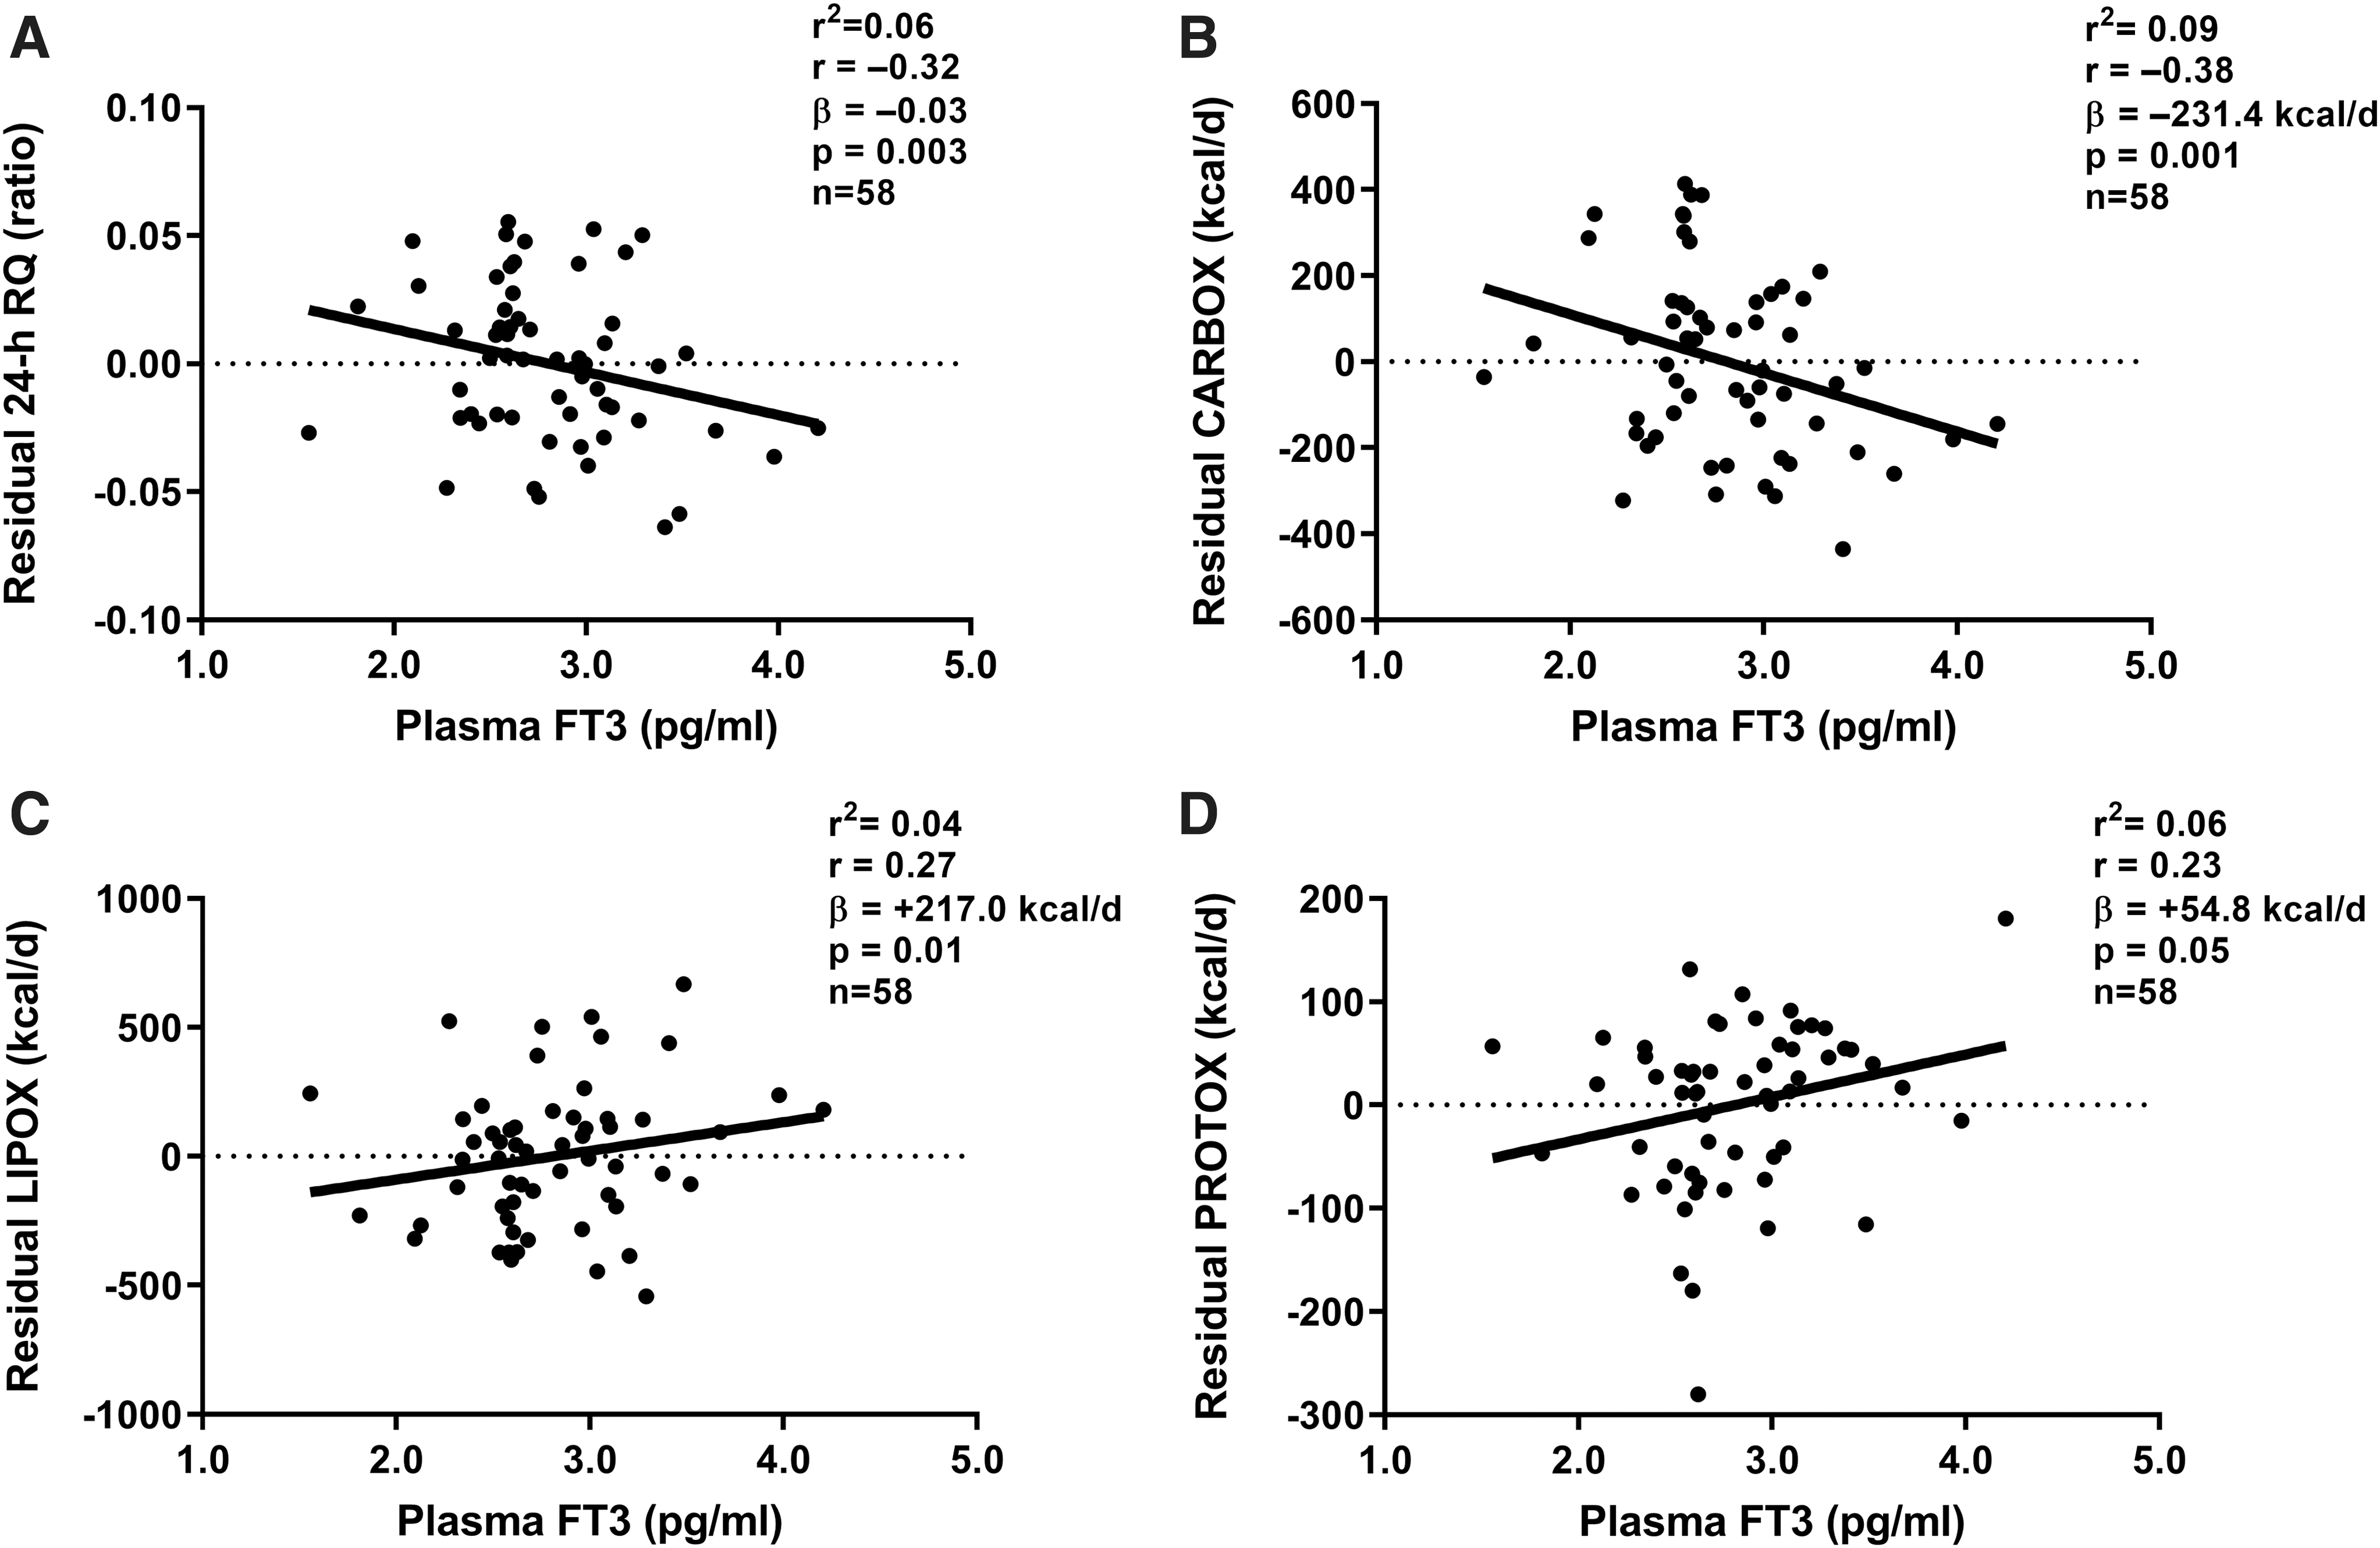
Relationships between fasting plasma fT3 concentration and 24-hour RQ and macronutrient oxidation rates during energy balance. Linear regression analysis was used to calculate residuals of 24-hour RQ, CARBOX, LIPOX, and PROTOX after adjustment for known covariates (age, sex, race/ethnicity, fat free mass, fat mass, and chamber temperature). Residuals of 24-hour RQ and macronutrient oxidation rates are shown on the y-axis of each panel. (
Discussion
In the present study including healthy euthyroid subjects with normal glucose regulation, we sought to assess the role of TH in the 24-hour EE responses to acute dietary interventions such as fasting and low-protein overfeeding, which characterize metabolic phenotypes associated with weight change (6,7). TH concentrations changed following diets with altered protein content including low- and high-protein overfeeding and fasting, but we did not observe any association between these changes and diet-induced changes in 24-hour EE or RQ.
Fasting
After 24 hours of fasting, the mean plasma fT4 concentrations increased, whereas TSH and fT3 concentrations decreased with a concomitant increase in rT3 concentrations. Studies uniformly demonstrate a decline in fT3 and increase in rT3 with fasting (31,32), but the T4 and TSH responses vary depending on the study (21,33), implying either a hypothalamic–pituitary–thyroid (HPT) axis or peripheral mechanism. Thyrotropin-releasing hormone (TRH) infusion decreases TSH secretion after a 10-day fasting period, and TSH and T3 responses to prolonged TRH infusion were not restored completely after 5 days of refeeding (34). Serum TSH decreases in the early phase (i.e., after 48 hours) of TRH infusion during fasting with an increase in fT4 concentrations, indicating that during the early acute phase of fasting temporary suppression of TSH secretion might be due to an effect of fT4 rather than being directly TRH-mediated (35). Peripheral conversion of T4 into T3 and rT3 is also affected by fasting (36). In humans, fasting induces altered peripheral TH metabolism leading to a decrease in T4-to-T3 conversion and rT3 degradation (21,32,37).
Our current results confirm an alteration in both TSH and TH concentrations after 24-hour fasting. Thus, we speculate that the directionality of these changes might indicate an effect of fasting on both central (TSH response) and peripheral (based on the T3 and rT3 response) mechanisms. Concordant with a previous study in health men during a 10-day fast (38), we did not observe any association between changes in FGF21 and TH concentrations after 24-hour fasting, indicating no substantial interaction between TH and FGF21 during prolonged fasting. As the effect of fasting on FGF21 concentration in humans is controversial (39) and differences between human and rodent studies are not fully understood, the increase in FGF21 following fasting observed in rodent models must be taken with caution when considering human studies, particularly because of the differences in tissue-specific FGF21 gene expression between the two species.
Low-protein overfeeding
After 24 hours of low-protein overfeeding, the mean circulating fT3 concentrations increased while TSH decreased and no changes were observed in circulating fT4 or rT3 concentrations. Dietary protein intake affects the physiological and neurobiological homeostatic regulatory system (40), and diets with reduced protein content alter the HPT axis via central and peripheral mechanisms (40). Our results indicate that with relatively acute overfeeding with low protein circulating fT3 concentrations increase and exert a negative feedback on the HPT axis with a consequent reduction in plasma TSH concentrations. The lack of change in plasma fT4 concentration is unclear but may be due to the short period of overfeeding (24 hours).
In rats, a protein-free diet leads to a decrease in TRH gene expression, pituitary TSH gene expression, and plasma T3 concentrations (41), indicating that protein reduction does also have a central effect on the TRH response at the hypothalamic level, possibly due to the absence of essential amino acids that have a role in the neurotransmitter system (42,43). However, the results of studies of low-protein diets in rodent models are mixed with two studies demonstrating an increase in serum T3 following a low-protein high-carbohydrate diet (44,45), and other study demonstrating a decrease in fT3, fT4, and TSH concentrations (46). Men overfed with a low-protein high-carbohydrate diet over ∼20 days increase their fT3 concentrations but decrease their fT4 concentrations (47), consistent with our observation of an upregulation of peripheral T4-to-T3 conversion after 24 hours. Despite our previously observed nearly threefold increase in plasma FGF21 following low-protein overfeeding (7), in the current analysis, we did not find any associations between the increase in FGF21 and changes in TH concentrations following this overfeeding diet.
High-protein overfeeding
Following 24-hour high-protein overfeeding, the mean circulating plasma TSH decreased along with the reduction in both fT4 and fT3 and no change in rT3 concentrations. To the best of our knowledge, very few studies have investigated the effect of short-term high-protein overfeeding on TH concentration. In healthy young adults, an 8-day period of eucaloric high-protein diet (35%, 30%, and 35% of total calories derived from protein, fat, and carbohydrate) led to reduction in TSH and T3 concentrations with no changes in T4 and rT3 (48). In overweight women (aged 30–54 years), high-protein diet (70 g protein a day) led to a reduction in circulating T3 concentrations but no changes in T4 (49).
Based on our current results, the reduction in each component of the pituitary–thyroid axis (plasma TSH, fT4, and fT3 concentrations) with no change in rT3 concentrations indicates a central mechanism reducing hypothalamic TRH secretion with consequent decrease in TSH production and fT4 and fT3 concentrations.
The decrease in plasma fT3 concentrations after high-protein overfeeding was associated with the previously reported decrease in plasma FGF21 concentrations (7). The interaction between TH receptors and other nuclear receptors, including the peroxisome proliferator-activated receptors (PPARs) and the liver X receptor, might mediate TH action on FGF21 production in the liver (50,51). In mice treated with exogenous T3, there is a dose–dependent increase in fgf21 expression (52). T3 regulates FGF21 via a PPAR-α-dependent mechanism in the liver (52). FGF21 may also regulate TH metabolism as a 7-day infusion of FGF21 in mice increased hypothalamic TRH and circulating TSH, T4, and T3 concentrations (53).
Effects of TH on EE response to diets
T3 has been shown to play a role, although minor, as a determinant of human EE, particularly, basal metabolic rate (15) and small changes in TH concentration after hormone treatment effect EE (54). Previous studies in euthyroid subjects have shown that circulating serum or plasma T3 concentrations are associated with 24-hour EE (55), sleeping (56), and resting (57) metabolic rate. In euthyroid subjects, lower fT3 concentrations, but not fT4, are associated with higher RQ reflecting a reduction in LIPOX (58). This finding might suggest that a reduction of T3 production in metabolically active tissue could lead to a shift from carbohydrates to lipids as source of energy. The current findings in our ethnically diverse cohort showing associations between circulating fT3 concentrations and 24-hour RQ and substrate oxidation corroborate the previous findings in a cohort of Native Americans (58). Indeed, TH signaling through deiodinases is a mechanism involved in energy homeostasis (59,60).
D2 is expressed in the brain, pituitary, thyroid, and brown adipose tissue (BAT) (61 –65) and is responsible for local conversion of T3 from T4 (66). Dio2-knockout mice have reduced lipolysis and lipogenesis, which lead to BAT dysfunction (65,67). Although we found an association between fT3 and RQ during energy balance, the changes in TH concentrations after 24-hour fasting or overfeeding diets with altered protein content were not associated with diet-related changes in 24-hour EE or RQ. The lack of association with EE measures could be explained by the small changes in TH concentrations (5–8%) after these short-term dietary interventions, which may not be physiologically meaningful enough to exert a change in whole-body energy metabolism. Furthermore, the TH concentrations in plasma might not reflect their concentrations in peripheral tissues.
Limitations
Our study has several limitations. First, the female subgroup was small. Second, TH have a circadian rhythm, and it is possible that our results were affected by the timing of blood draw in the early morning. Also, other hormonal factors (e.g., catecholamines and adipokines) might be responsible for the small changes in circulating TH concentrations in response to diets. Future interventional studies specifically including no/low-/high-protein diets with concomitant measurements of hormones are warranted to elucidate the causal mechanisms by which TH concentrations may change in response to these dietary interventions. Third, dietary intervention given for only 24 hours might be too short to obtain a complete picture of the changes in TH, which may require longer time periods. However, sustained overfeeding or fasting may result in substantial changes in body weight and body composition, which in turn may impact circulating TH concentrations as a result of the metabolic adaptation to weight gain/loss (68). As our aim was to assess the short-term effects of fasting and overfeeding diets on TH concentrations during weight stability, we sought to assess whether TH mediate the diet-induced changes in energy metabolism observed over 24 hours. It is noteworthy that the changes in fT4 and fT3 after the LPF and HPF were related, indicating a role for protein intake in regulating circulating TH concentrations.
In summary, 24-hour fasting and overfeeding diets with altered protein content (high and low) induce variable changes in TH concentrations; however, these changes were not associated with changes in 24-hour EE or substrate oxidation during these acute, short-term dietary interventions. Circulating TH concentrations changed differently by diet, implying different regulatory mechanisms in each case and suggesting that other factors (e.g., hormones) might be involved in the TH response to diet. Although the current study was not designed to prove causality between the changes in fT3 and FGF21 following dietary interventions, we did find an association between those changes after high-protein overfeeding, which might suggest an effect of T3 on FGF21 or vice versa during this specific dietary intervention.
In conclusion, despite their involvement in protein metabolism in settings of proteins surplus or deficit, TH do not mediate the short-term effects of acute dietary interventions on 24-hour EE, indicating that TH do not likely explain the interindividual differences in diet-induced thermogenesis that quantifies the susceptibility to weight gain.
Footnotes
Acknowledgments
The authors wish to thank the subjects who were enrolled in the study and the clinical staff of the Phoenix Epidemiology and Clinical Research Branch for conducting the examinations. This research was supported by the Intramural Research Program of the National Institutes of Health, National Institute of Diabetes and Digestive and Kidney Diseases.
Prior Presentation
The study has not been published previously in abstract form or article.
Authors' Contributions
A.B. analyzed and interpreted the data and wrote the article. B.B. and T.H. assisted with the data analysis and revised the article. P.P. and F.S. supported with the interpretation of the data and reviewed the article. K.L.V. conducted the study, and P.P. and J.K. designed and implemented the study. M.W. performed hormone measurements. All authors critically revised the draft and approved the final article. A.B. and P.P. had full access to all the data in the study and take responsibility for the integrity of the data and the accuracy of the data analysis.
Author Disclosure Statement
No competing financial interests exist.
Supplementary Material
Supplementary Data
Supplementary Figure S1
Supplementary Figure S2
Supplementary Figure S3
Supplementary Figure S4
Supplementary Figure S5
Supplementary Figure S6
Supplementary Table S1