
Abstract
Background:
The thyroid hormones (THs) triiodothyronine (T3) and thyroxine (T4) are crucial regulators of brain development and function. Cell-specific transporter proteins facilitate TH uptake and efflux across the cell membrane, and insufficient TH transport causes hypothyroidism and mental retardation. Mutations in the TH transporters monocarboxylate transporter 8 (MCT8, SLC16A2) and the organic anion-transporting polypeptide 1C1 (OATP1C1, SLCO1C1) are associated with the psychomotor retardation Allan-Herndon-Dudley syndrome and juvenile neurodegeneration, respectively.
Methods:
To understand the mechanisms and test potential treatments for the recently discovered OATP1C1 deficiency, we established an oatp1c1 mutant (oatp1c1−/− ) zebrafish.
Results:
oatp1c1 is expressed in endothelial cells, neurons, and astrocytes in zebrafish. The activity of the hypothalamic–pituitary–thyroid axis and behavioral locomotor activity increased in oatp1c1−/− larvae. Neuropathological analysis revealed structural alteration in radial glial cells and shorter neuronal axons in oatp1c1−/− larvae and adults. Notably, oatp1c1−/− and oatp1c1−/− Xmct8−/− adults exhibit an enlarged thyroid gland (goiter). Pharmacological assays showed that TH analogs, but not THs, can reduce the size and improve the color of the thyroid gland in adult mutant zebrafish.
Conclusion:
These results establish a vertebrate model for OATP1C1 deficiency that demonstrates endocrinological, neurological, and behavioral alterations mimicking findings observed in an OATP1C1-deficient patient. Further, the curative effect of TH analogs in the oatp1c1−/− zebrafish model may provide a lead toward a treatment modality in human patients.
Introduction
In all vertebrates, the thyroid hormones (THs) thyroxine (T4) and triiodothyronine (T3) are essential regulators of development, neurogenesis, growth, and metabolism (1). Abnormal TH signaling causes various neurological and metabolic disorders, ranging from enlargement and overactivity of the thyroid gland (goiter) to TH resistance, mental retardation, and congenital hypothyroidism (2). TH secretion is regulated by the hypothalamic–pituitary–thyroid (HPT) axis and a negative TH feedback loop. The hypothalamic thyrotropin-releasing hormone (TRH) stimulates the anterior pituitary to produce thyroid stimulating hormone (TSH), which regulates the production and secretion of THs by the follicular cells of the thyroid gland (3). In the central nervous system (CNS), the iodothyronine deiodinase type 2 (D2) converts T4 into the active form of TH T3, which binds to its nuclear thyroid receptors (TRs) and activates or represses the expression of a wide spectrum of genes (4). Thus, to function, THs require efficient transport across the cell membrane.
Several TH transmembrane transporters have been described and functionally characterized, including the monocarboxylate transporter 8 (MCT8, SLC16A2) (5), which primarily transports T3 and T4, and the organic anion-transporting polypeptide 1C1 (OATP1C1, SLCO1C1, also known as OATP14 or OATP-F) (6), which is a T4-specific transporter (7). Their critical role in regulating TH signaling, metabolism, and brain development is evident by the symptoms of TH transporter disorders. Mutations in MCT8 are associated with the X-linked Allan-Herndon-Dudley syndrome (AHDS), which is characterized by severe cognitive deficits, spastic quadriplegia, hypotonia, and elevated serum T3 levels (8,9). Recently, a disease-specific mutation in OATP1C1 was discovered in an adolescent patient. Between ages 9 and 14 years, the patient gradually lost speech, cognitive and motor functioning. Magnetic resonance imaging (MRI) and positron emission tomography–computed tomography showed severely decreased glucose metabolism in the entire brain and degeneration of axonal fibers in the brain, as indicated by an increase in neurofilament light protein concentration in the cerebrospinal fluid (CSF). It was suggested that astrocytes are involved in the degenerative process, because the glial fibrillary acidic protein (GFAP) was mildly elevated. Endocrinological tests showed that the levels of TSH, T3, and T4 were normal in the blood serum; thus, animal models are required to clarify how the loss of function of OATP1C1 causes this neurodegeneration disorder in human patients (10).
The human mutated OATP1C1 displayed impaired plasma membrane localization and decreased cellular T4 uptake in cell lines (10). In mice, Oatp1c1 is expressed in brain endothelial cells and in the choroid plexus; while in primates, OATP1C1 is primarily expressed in astrocytes, is not detected in endothelial cells of the blood
The zebrafish is a simple translucent vertebrate with a conserved organization of the brain and the HPT axis, and it is ideally suited for studying TH signaling and neuronal development and behavior in live animals (14,15). Thus, this model has become an attractive high-throughput model for drug discovery (16). We previously characterized the expression pattern of genes encoding for the TH transporters Mct8, Mct10, and Oatp1c1 in zebrafish (17). Further, an mct8 mutant (mct8−/− ) zebrafish was established. This model fish exhibits altered development of neuronal axons, synapses, and myelin-producing oligodendrocytes, as well as behavioral defects, mimicking symptoms found in AHDS patients (15,18,19). Studies on the role of Mct8 were carried out on several additional non-mammalian models, including chicken and frogs (20). However, the role of Oatp1c1 in regulating TH signaling, brain development, and behavior has not been defined in zebrafish, and it has not been characterized in detail in humans. We hypothesized that the consequences of Oatp1c1 deficiency and potential treatment modalities can be further elucidated by using a zebrafish model.
Materials and Methods
Zebrafish husbandry
Adult zebrafish were raised and maintained in fully automated zebrafish housing systems (temperature 28°C ± 0.5°C, pH 7.0, conductivity 500 μS; Aquazone) under 14 hours light/10 hours dark cycles, and they were fed twice a day. Embryos were produced by natural spawning and raised in egg-water containing methylene blue (0.3 ppm) in a light-controlled incubator at 28°C ± 0.5°C, as previously described (21). All animal protocols were reviewed and approved by the Bar-Ilan University Bioethics Committee.
Quantitative real-time polymerase chain reaction
The relative messenger RNA (mRNA) levels of trh (NCBI accession No. NM_001012365.2), tsh (NM_181494.2), thyroglobulin (tg; NM_001329865.1), mbp (AY860977.1), gfap (NM_131373.2), and actin (AY222742.1) were determined by using a real-time polymerase chain reaction (RT-PCR). Total mRNA was extracted from at least 5 batches of 15 oatp1c1+/+ and oatp1c1−/− 3 and 6 days post-fertilization (dpf) larvae, or three groups of two oatp1c1+/+ and oatp1c1−/− adult brains, using the RNeasy Protect Mini Kit (Qiagen, Redwood City, CA) according to the manufacturer's instructions. One microgram mRNA was reverse transcribed by using qScript complementary DNA (cDNA) SuperMix (Quanta BioSciences, Gaithersburg, MD). Relative transcript levels were determined by the 7900HT Fast Real-Time PCR System (Applied Biosystems, Foster City, CA). Triplicates of each cDNA sample were PCR-amplified by using the PerfeCTa SYBR Green FastMix (Quanta BioSciences) and the following specific primers: tg: 5′-agcagagccaagaacactaag-3′ and 5′-gtaaagagtagaaccaggtcg-3′; tsh: 5′-cccactgactacaccatctac-3′ and 5′-catcccctctgaacaataaaacg-3′; trh: 5′-gcagacccacagcatcag-3′ and 5′-caggccaagacgaacaca-3′; mbp: 5′-gaggagacaagaagagaaaggg-3′ and 5′-gaaatgcacgacagggttg-3′; and gfap: 5′-ctgctcaatgtcaaactggc-3′ and 5′-gctggtgtctctctaaactgtaaattg-3′. The relative quantification of gene expression levels was normalized against β-actin (5′caacagggaaaagatgacacag-3′ and 5′-catcaccagagtccatcacg-3′) in all assays (22), and ΔΔCT analysis was performed (23). The β-actin gene was selected since its expression did not significantly change between mutant and wild-type (WT) zebrafish during the various developmental stages. Gene levels were normalized by dividing the absolute levels of each sample with the average of all WT samples.
Whole-mount in situ hybridization and probe preparation
To prepare mRNA anti-sense probes, the full coding sequences of oatp1c1 (NCBI accession No. NM_001044997.3), trh, tsh, and tg were amplified. The PCR products were cloned into a pCRII-TOPO (Invitrogen, Carlsbad, CA) or pGEM vector (Promega, Madison, WI), which served as a template to transcribe digoxigenin-labeled and/or fluorescein-labeled anti-sense mRNA probes for oatp1c1, trh, tsh, and tg. oatp1c1−/− zebrafish and WT-sibling larvae (48 hours post-fertilization, 3 dpf, and 6 dpf); adult brains were fixed in 4% paraformaldehyde (PFA) overnight at 4°C and stored in 100% methanol. The location and level of mRNA expression were detected by whole-mount in situ hybridization (ISH), as previously described (21).
ISH—immunofluorescence
Single oatp1c1 ISH was performed, as described earlier, in adult brains. For signal detection, we presoaked the brains in 0.1 Tris HCl, pH 8.2, for 1 hour, and incubated the samples in FastRed or TSA (Roche) at 37°C in a dark incubator until staining appeared. To stop the staining, the samples were rinsed three times in PBT 0.1% for 5 minutes. The brains were then blocked with 20% normal goat serum diluted in PBT for 1 hour at room temperature. After blocking, the brains were incubated with the following primary antibodies: rabbit anti-EGFP (SC-8334; Santa Cruz Biotechnology, Santa Cruz, CA), 1:250 dilution; and mouse anti-HuC/HuD (A-21271; Invitrogen), 1:100 dilution. Next, the brains were washed in phosphate buffered saline (PBS) with Tween and blocked for 1 hour. Primary antibodies were detected with the following secondary antibodies: goat anti-rabbit Alexa Fluor 594 IgG (H+L) antibody (2 mg/mL, A-11037; Invitrogen); with secondary goat anti-mouse Alexa Fluor 594 IgG (2 mg/mL, A-11005; Invitrogen).
Immunofluorescence
In immunofluorescence assays, the brains were rehydrated with a reduced methanol concentration, and they were rinsed two times in PBT 0.1% for 10 minutes. The brains were then blocked with 20% normal goat serum diluted in PBT for 1 hour at room temperature. After blocking, the brains were incubated with primary antibody mouse anti-Gfap (zrf-1; Zebrafish International Resource Center, Eugene, OR), 1:500 dilution, in blocking buffer overnight at 4°C. The primary antibody was detected with a secondary goat anti-mouse Alexa Fluor 594 IgG (2 mg/mL, A-11005; Invitrogen).
Histological analysis of the thyroid gland
In histological experiments, the thyroid gland of mct8−/− Xoatp1c1−/− and WT sibling adult zebrafish was dissected and fixed in 4% PFA/PBS at 4°C overnight. After fixation, tissues were dehydrated to 100% ethanol and embedded in paraffin. The embedded tissues were cut to generate 7-μm-thick sections and mounted onto slides. Paraffin-embedded tissue sections were stained with hematoxylin and eosin. The tissue sections were examined under a standard light microscope.
Establishment of an oatp1c1
−/−
zebrafish
The CRISPR system (24) was used to establish the oatp1c1−/−
line. Cas9 (plasmid No. 42251; Addgene, Cambridge, MA) and single-guide RNA (sgRNA; plasmid No. DR274; Addgene) zebrafish expression plasmids were used, as previously described (25). To prepare the sgRNA, two oatp1c1 specific oligos were designed to match the target site (GGCTTGAGCAACAGCGCCGACTGG according to
Genotyping of oatp1c1−/− zebrafish was performed by extracting genomic DNA from embryos, larvae, or adult tail. The sample was incubated in 100 μL of 50 nM NaOH at 95°C for 20 minutes, and it was then kept on ice. After that, 10 μL of Tris (ph = 8) was added, and the sample was subjected to 30 seconds of vortex treatment and 2 minutes of spinning at 12,000 rcf. The genomic DNA was amplified by PCR using the following primers: oatp1c1 forward: 5′-tgacgtgtgcaaactgtgtc-3′, and oatp1c1 reverse: 5′-caagtattccaaccagccatgt-3′. The PCR product was diagnosed on a 1% agarose gel, and heterozygous, homozygous, and WT fragments could be identified by their size (Fig. 2D).
Behavioral assays
Larvae were individually placed in 48-well plates. Larva-containing plates were placed in the Noldus DanioVision tracking system (Noldus Information Technology, Wageningen, Netherlands) and acclimated for 1 hour before activity recording. Light intensity in the tracking system was 70 LUX (25% in the operating software) for all experiments. To monitor responses to light/dark transitions, either 6 and 14 dpf oatp1c1−/− larvae or their WT siblings were subjected to 30 minutes light to 30 minutes dark cycles. Live video-tracking and analysis were conducted by using the EthoVision XT 12 software (Noldus Information Technology), as previously described (21).
Establishment of transgenic fish and transient expression assays
The tol2 system was used to generate the stable transgenic lines Tg(her4.1:mCherry). Capped RNA-encoding transposase (10 ng/μL) and a pT2-her4.1:mCherry-vector (30 ng/μL, a kind gift from Prof. Michael Brand) (26) were co-injected into fertilized eggs at the one-cell stage. The injected embryos were raised to adulthood and out-crossed with WT fish to identify F0 founder fish by using a fluorescence stereomicroscope. Four F0 fish were screened, and one carrier fish was selected. Its F1 progeny were raised to adulthood. A screen of four F1 fish revealed mCherry expression in the progeny of one individual, which was out-crossed with WT fish to generate an F2 stable Tg(her4.1:mCherry) line. Transient expression assays of her4.1:mCherry and hcrt:EGFP DNA constructs were performed by microinjection of ∼2 nL into one-cell-stage zebrafish zygotes at a concentration of 50 ng/μL, using a micromanipulator and a PV830 Pneumatic Pico Pump (World Precision Instruments, Sarasota, FL). At 6 dpf, positive larvae were sorted out and imaged in the confocal microscope.
Imaging and image analysis
An epifluorescent stereomicroscope (Leica M165FC) was used to visualize larvae expressing fluorescent reporters and to image whole-mount ISH-stained larvae and brain sections. Images were taken by using Leica Application Suite imaging software V3.7 (Leica, Wetzlar, Germany). For confocal imaging, larvae were anesthetized with Tricaine (0.01%) and placed in low-melting-point agarose (1.0–2.0%) on a specially designed dish filled with embryo water. A similar mounting protocol was used to image fixed embryos subjected to ISH and immunofluorescence. Confocal imaging was performed by using a Zeiss LSM710 upright confocal microscope (Zeiss, Oberkochen, Germany).
The number of oligodendrocytes as well as the number, structure, and length of radial glial cells, and the length of the axons of Hcrt neurons were quantified by using ImageJ software (National Institutes of Health, Bethesda, MD). To quantify the number of oligodendrocytes, a 425.1 μm × 425.1 μm area was imaged in the midbrain of 6 dpf larvae. Calculation of the number of mbp-positive cells was performed by using cell counter plugin in imageJ. To quantify the length of radial glia extensions, a 212.55 μm × 212.55 μm area in the midbrain was imaged, and the total length was calculated by using NeuronJ plugin. To calculate the length of Hcrt axons, we imaged between two and four overlapping 425.1 μm × 425.1 μm images that cover both the cell body and the tip of the axon in the spinal cord. The images were stitched by using Pairwise stitching plugin. Since the hypothalamic Hcrt neurons project dorsally to the hindbrain and then caudally to the spinal cord, the length of the axons was quantified between the hindbrain and the spinal cord where the axon projection is in the same plane.
Pharmacological assays
In all pharmacological assays, adult zebrafish were placed in glass beakers (three adult fish per beaker) containing a specific drug or 5 × 10⁻⁶ M NaOH diluted in zebrafish water for control groups. The exposure medium (500 mL per beaker) was replaced once a day, and each experiment lasted a total of 48 hours. Stock solutions of 100 μM T3, T4, 3,3′,5-triiodothyroacetic acid (TRIAC/TA3; Sigma-Aldrich, St. Louis, MO), and 3,5-diiodothyropropionic acid (DITPA; Santa Cruz Biotechnology, Dallas, TX) were prepared in 0.05–0.1 M NaOH, and they were diluted in zebrafish water to the final administered concentrations. To choose the appropriate working dilution for each substance, a preliminary dose-dependent assay was performed, as previously described (19). The ventral part of the head, including the thyroid gland, was imaged, and the width of the thyroid gland was quantified by using ImageJ software.
Experimental design and statistical analysis
To analyze the differences in the cell length and number, and to compare gene expression levels between oatp1c1−/− and WT zebrafish, a two-tailed Student's t-test was performed by using the ToolPac in Excel. In the behavior experiments, to compare activity values during the light versus the dark, a mixed-effect model with repeated measures was performed. Two-tailed Student's t-test was used to show differences in average locomotor activity during the light/dark transitions in the activity experiment. Data for all experiments are presented as the mean ± standard error of the mean.
Results
Oatp1c1 is expressed in astrocytes, neurons, and primarily in brain endothelial cells
To characterize the spatial expression pattern of oatp1c1 during development and in adults, whole-mount ISH experiments were performed. While mct8 was widely expressed in the CNS and peripheral regions (17), oatp1c1 was found to be expressed specifically in the brain in 2 dpf embryos (Fig. 1A). In 6 dpf embryos, oatp1c1 expression was not detected in peripheral tissues such as the thyroid gland (Fig. 1B), and it was specifically expressed in the brain, primarily in the midbrain and hindbrain (Fig. 1C). In adults, oatp1c1 expression was detected in several brain regions, including the hypothalamus and optic tectum (TeO) (Fig. 1D–I). To study the localization of oatp1c1 in specific cell types, double ISH/immunohistochemistry was performed on adult brain sections by using an oatp1c1 mRNA probe and the antibody anti-EGFP on the following transgenic fish: tg(flk:EGFP) (fetal liver kinase 1) (Fig. 1J–L), tg(gfap:EGFP) (Fig. 1M–O), and tg(mbp:EGFP) (Fig. 1S–U), as well as anti-HuC/HuD in WT fish (Fig. 1P–R), which mark endothelial cells, astrocytes, oligodendrocytes, and neurons, respectively. The double labeling showed that oatp1c1 was strongly expressed in endothelial cells across wide brain areas (Fig. 1J–L). In specific brain areas, oatp1c1 expression was also detected in neurons and astrocytes (Fig. 1M–R), but not in oligodendrocytes (Fig. 1S–U). These results show that oatp1c1 is primarily expressed in endothelial cells of the BBB, but also in neurons and astrocytes in specific brain regions.

The expression pattern of oatp1c1 in embryos, larvae, and adults. (
Hyperactivity of the HPT axis in oatp1c1
−/−
larvae and adults
The expression of oatp1c1 in endothelial cells of the BBB suggests that it could be crucial for T4 transport into the brain; thus, a loss of Oatp1c1 could affect the endocrine function of the HPT axis. To study the function of Oatp1c1, we generated an oatp1c1−/− fish by using the CRISPR/Cas9 system. The sgRNA was engineered to recognize a target sequence located in the first exon of the oatp1c1 gene. Screening of F1 adults allowed us to identify a fish that carried four insertions and three transitions of nucleotides, which resulted in the introduction of a stop codon after amino acid 72 (Fig. 2A, B). While the WT protein length was 689 amino acids, the truncated protein length was 72 amino acids (Fig. 2C). This F1 fish was the founder of the oatp1c1−/− line. Digestion of the genomic DNA fragment with HaeII restriction enzyme confirmed the Mendelian inheritance of the mutation (Fig. 2D), and rescue with TH analogs confirmed the specific loss of function of Oatp1c1 (Fig. 6). To test whether loss of Oatp1c1 affects the expression of the hypothalamic trh, the pituitary tsh, and tg, which marks follicular cells of the thyroid gland, whole-mount ISH and quantitative RT-PCR experiments were performed in the developing larvae. While the expression of trh, tsh, and tg mRNA did not change in 3 dpf oatp1c1−/− larvae, the expression of all three genes increased in 6 dpf oatp1c1−/− larvae (Fig. 2E–S), which reflects hyperactivity of the HPT axis. This alteration in the function of the HPT axis was detected only in relatively mature 6 dpf larvae, possibly because of the wider spatial expression pattern of oatp1c1 (Fig. 1A–C) in 6 dpf larvae, and because the zebrafish BBB develops between 3 and 10 dpf (27). Altogether, these results show hyperactivity of the HPT axis, which can reflect hypothyroidism in the hypothalamus and pituitary or possibly in the whole brain of the oatp1c1−/− fish.
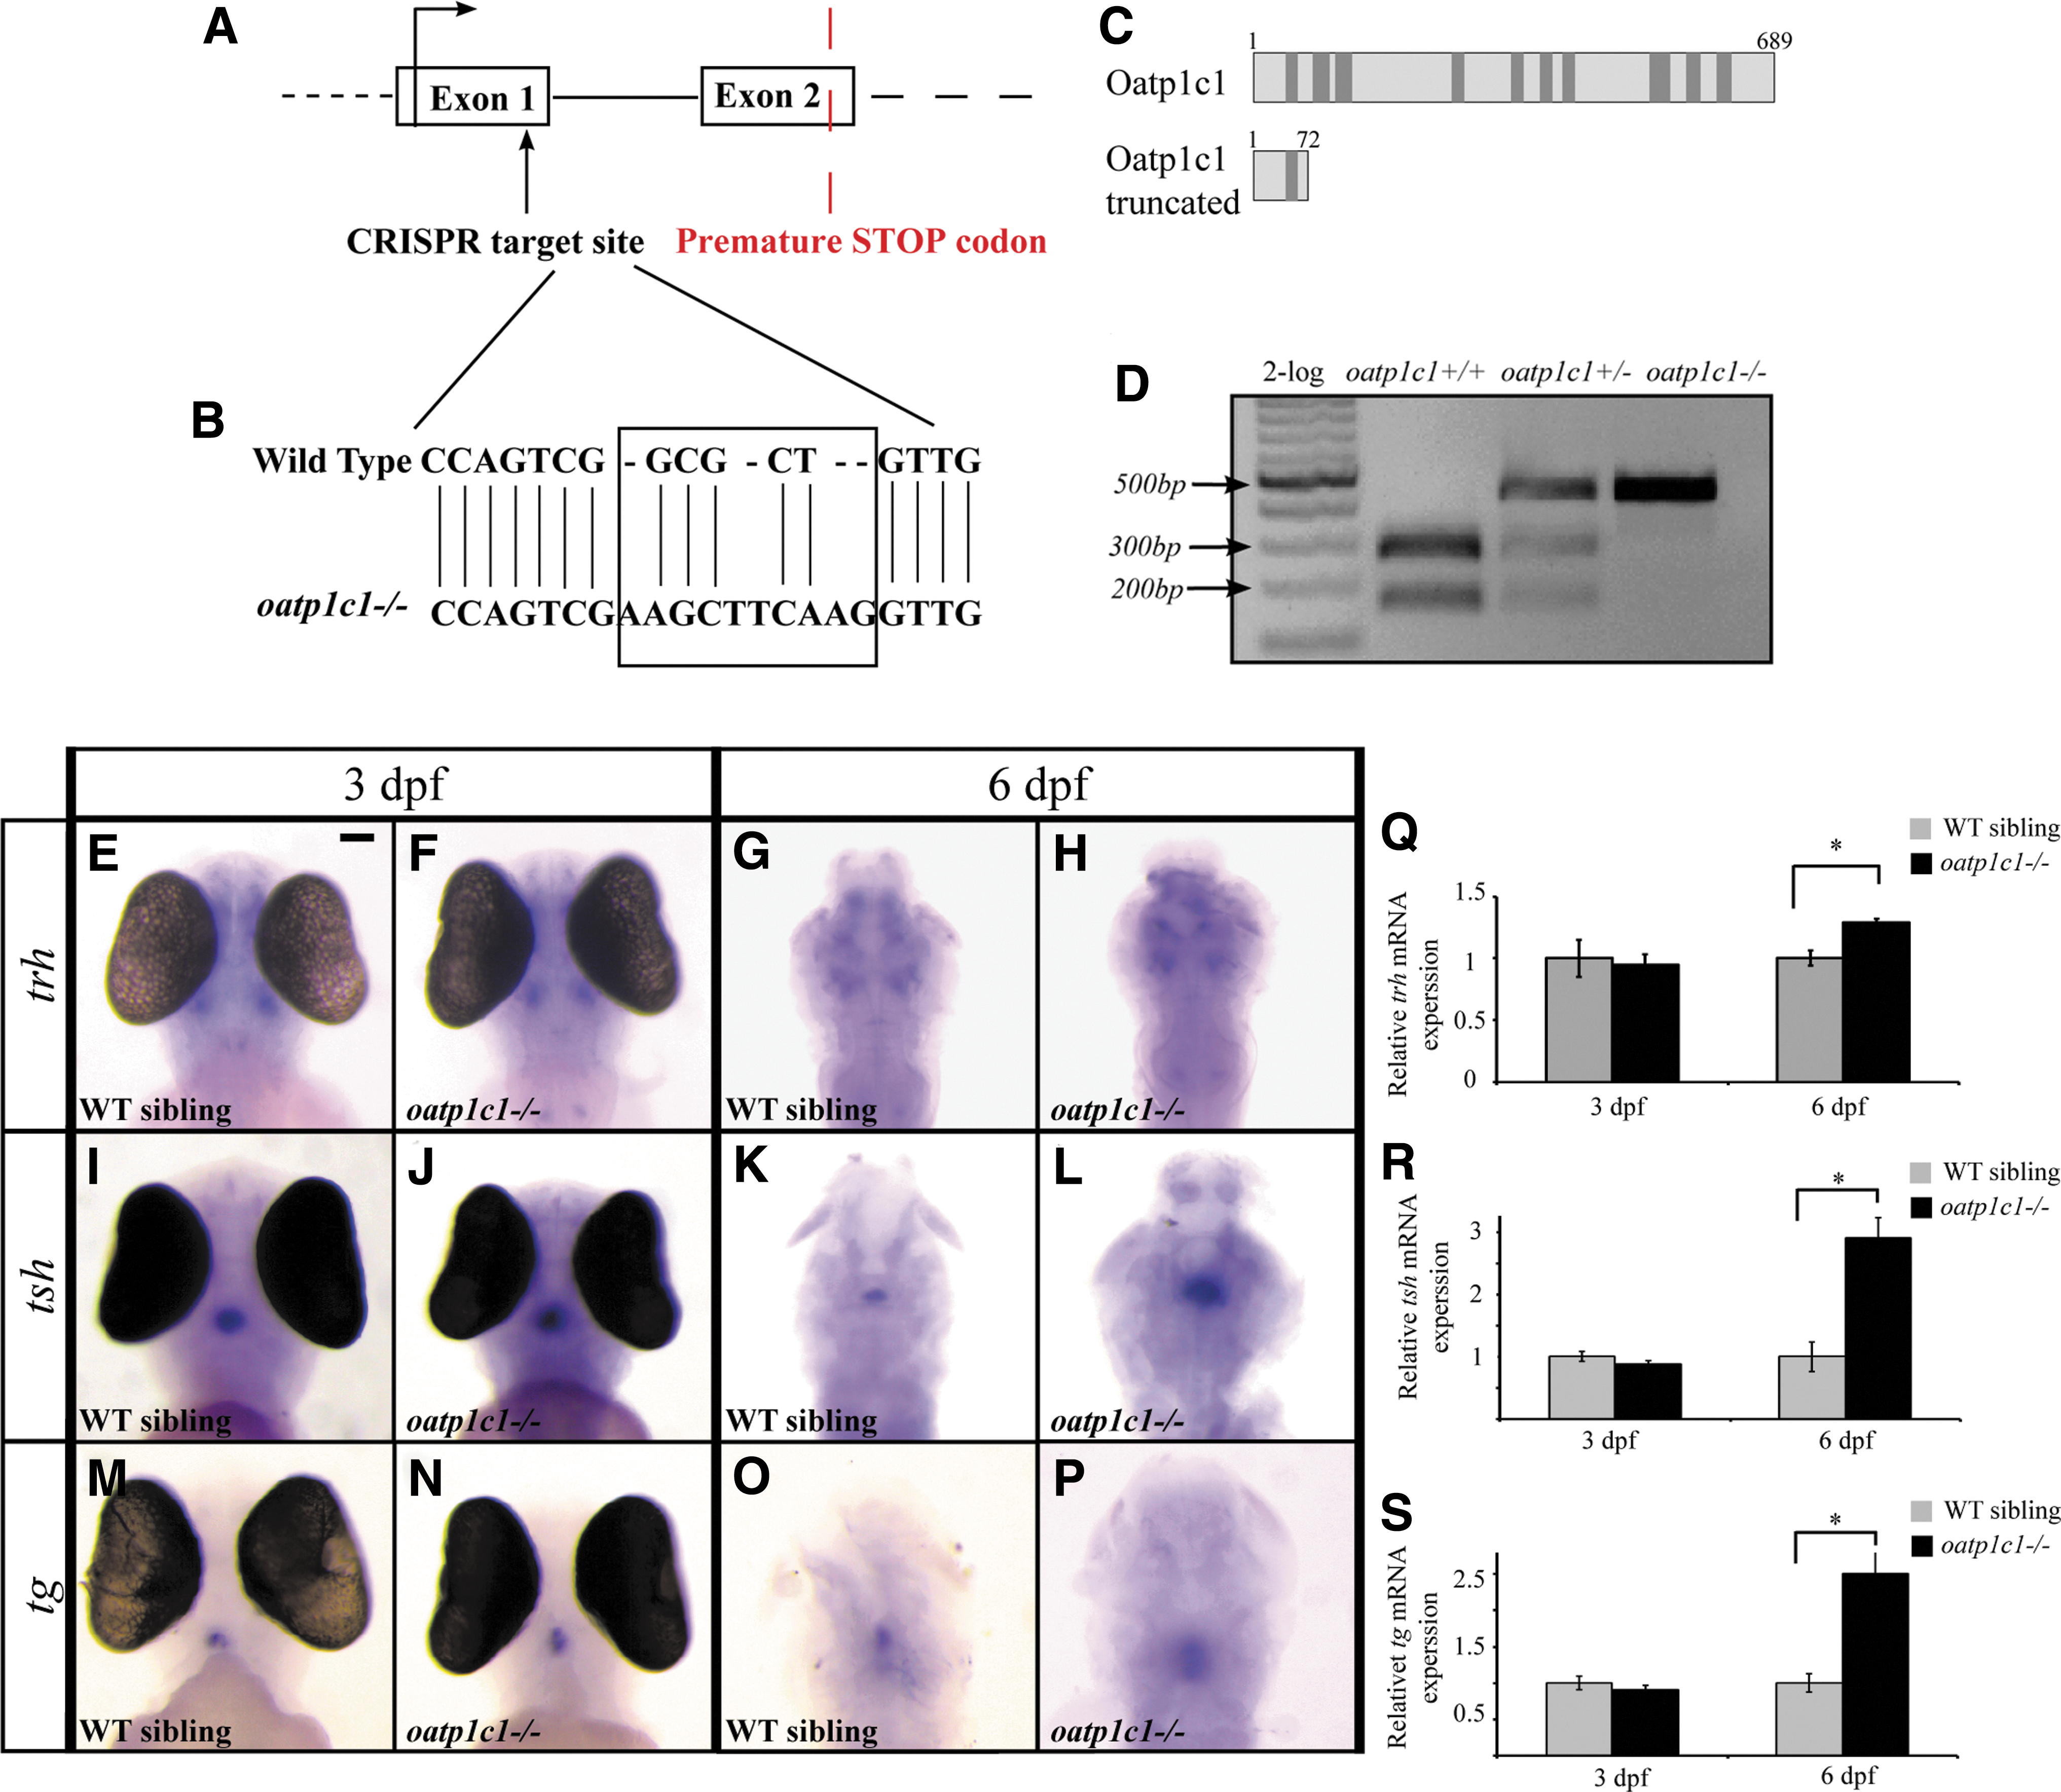
Establishment of an oatp1c1−/−
zebrafish and the expression of trh, tsh, and tg genes in oatp1c1−/−
embryos and larvae. (
Hyperlocomotor activity in oatp1c1
−/−
larvae
Spasticity of the lower limbs and difficulty using the hands are pronounced symptoms observed in a patient deficient for OATP1C1 (10). Accordingly, we tested whether behavioral performance was altered in oatp1c1−/− larvae. Locomotor activity was monitored in 6 dpf larvae by using a video tracking behavioral system under alternating 30-minute periods of dark and light. Locomotor activity increased by ∼10% during the light and dark periods in 6 dpf oatp1c1−/− larvae compared with their WT siblings (Fig. 3A, C). Further, analysis of behavior during the light-to-dark transitions showed that the response to dark stimuli decreased in 6 dpf oatp1c1−/− compared with their WT-sibling larvae. Notably, this tendency was present in all three light/dark cycles (oatp1c1−/− : 6.5 ± 0.5, 7.11 ± 0.54, 7.77 ± 0.56 cm/min; WT sibling: 8.97 ± 0.42, 9.18 ± 0.46, 9.25 ± 0.41 cm/min) (Fig. 3E). During the dark-to-light transitions, oatp1c1−/− larvae exhibited an increase in freezing behavior compared with their WT sibling (Fig. 3E). We next analyzed the locomotor activity and response to light and dark transitions in 14 dpf oatp1c1−/− and oatp1c1+/− larvae (Fig. 3B). These more mature larvae showed similar and a slightly more pronounced behavioral phenotype compared with 6 dpf larvae. The activity of oatp1c1−/− larvae increased by 13.03% and by 12.77% compared with oatp1c1+/− larvae during the light and dark periods, respectively (Fig. 3D, F). Altogether, these results show hyperlocomotor activity and an altered behavioral response to light/dark transitions in oatp1c1−/− larvae.
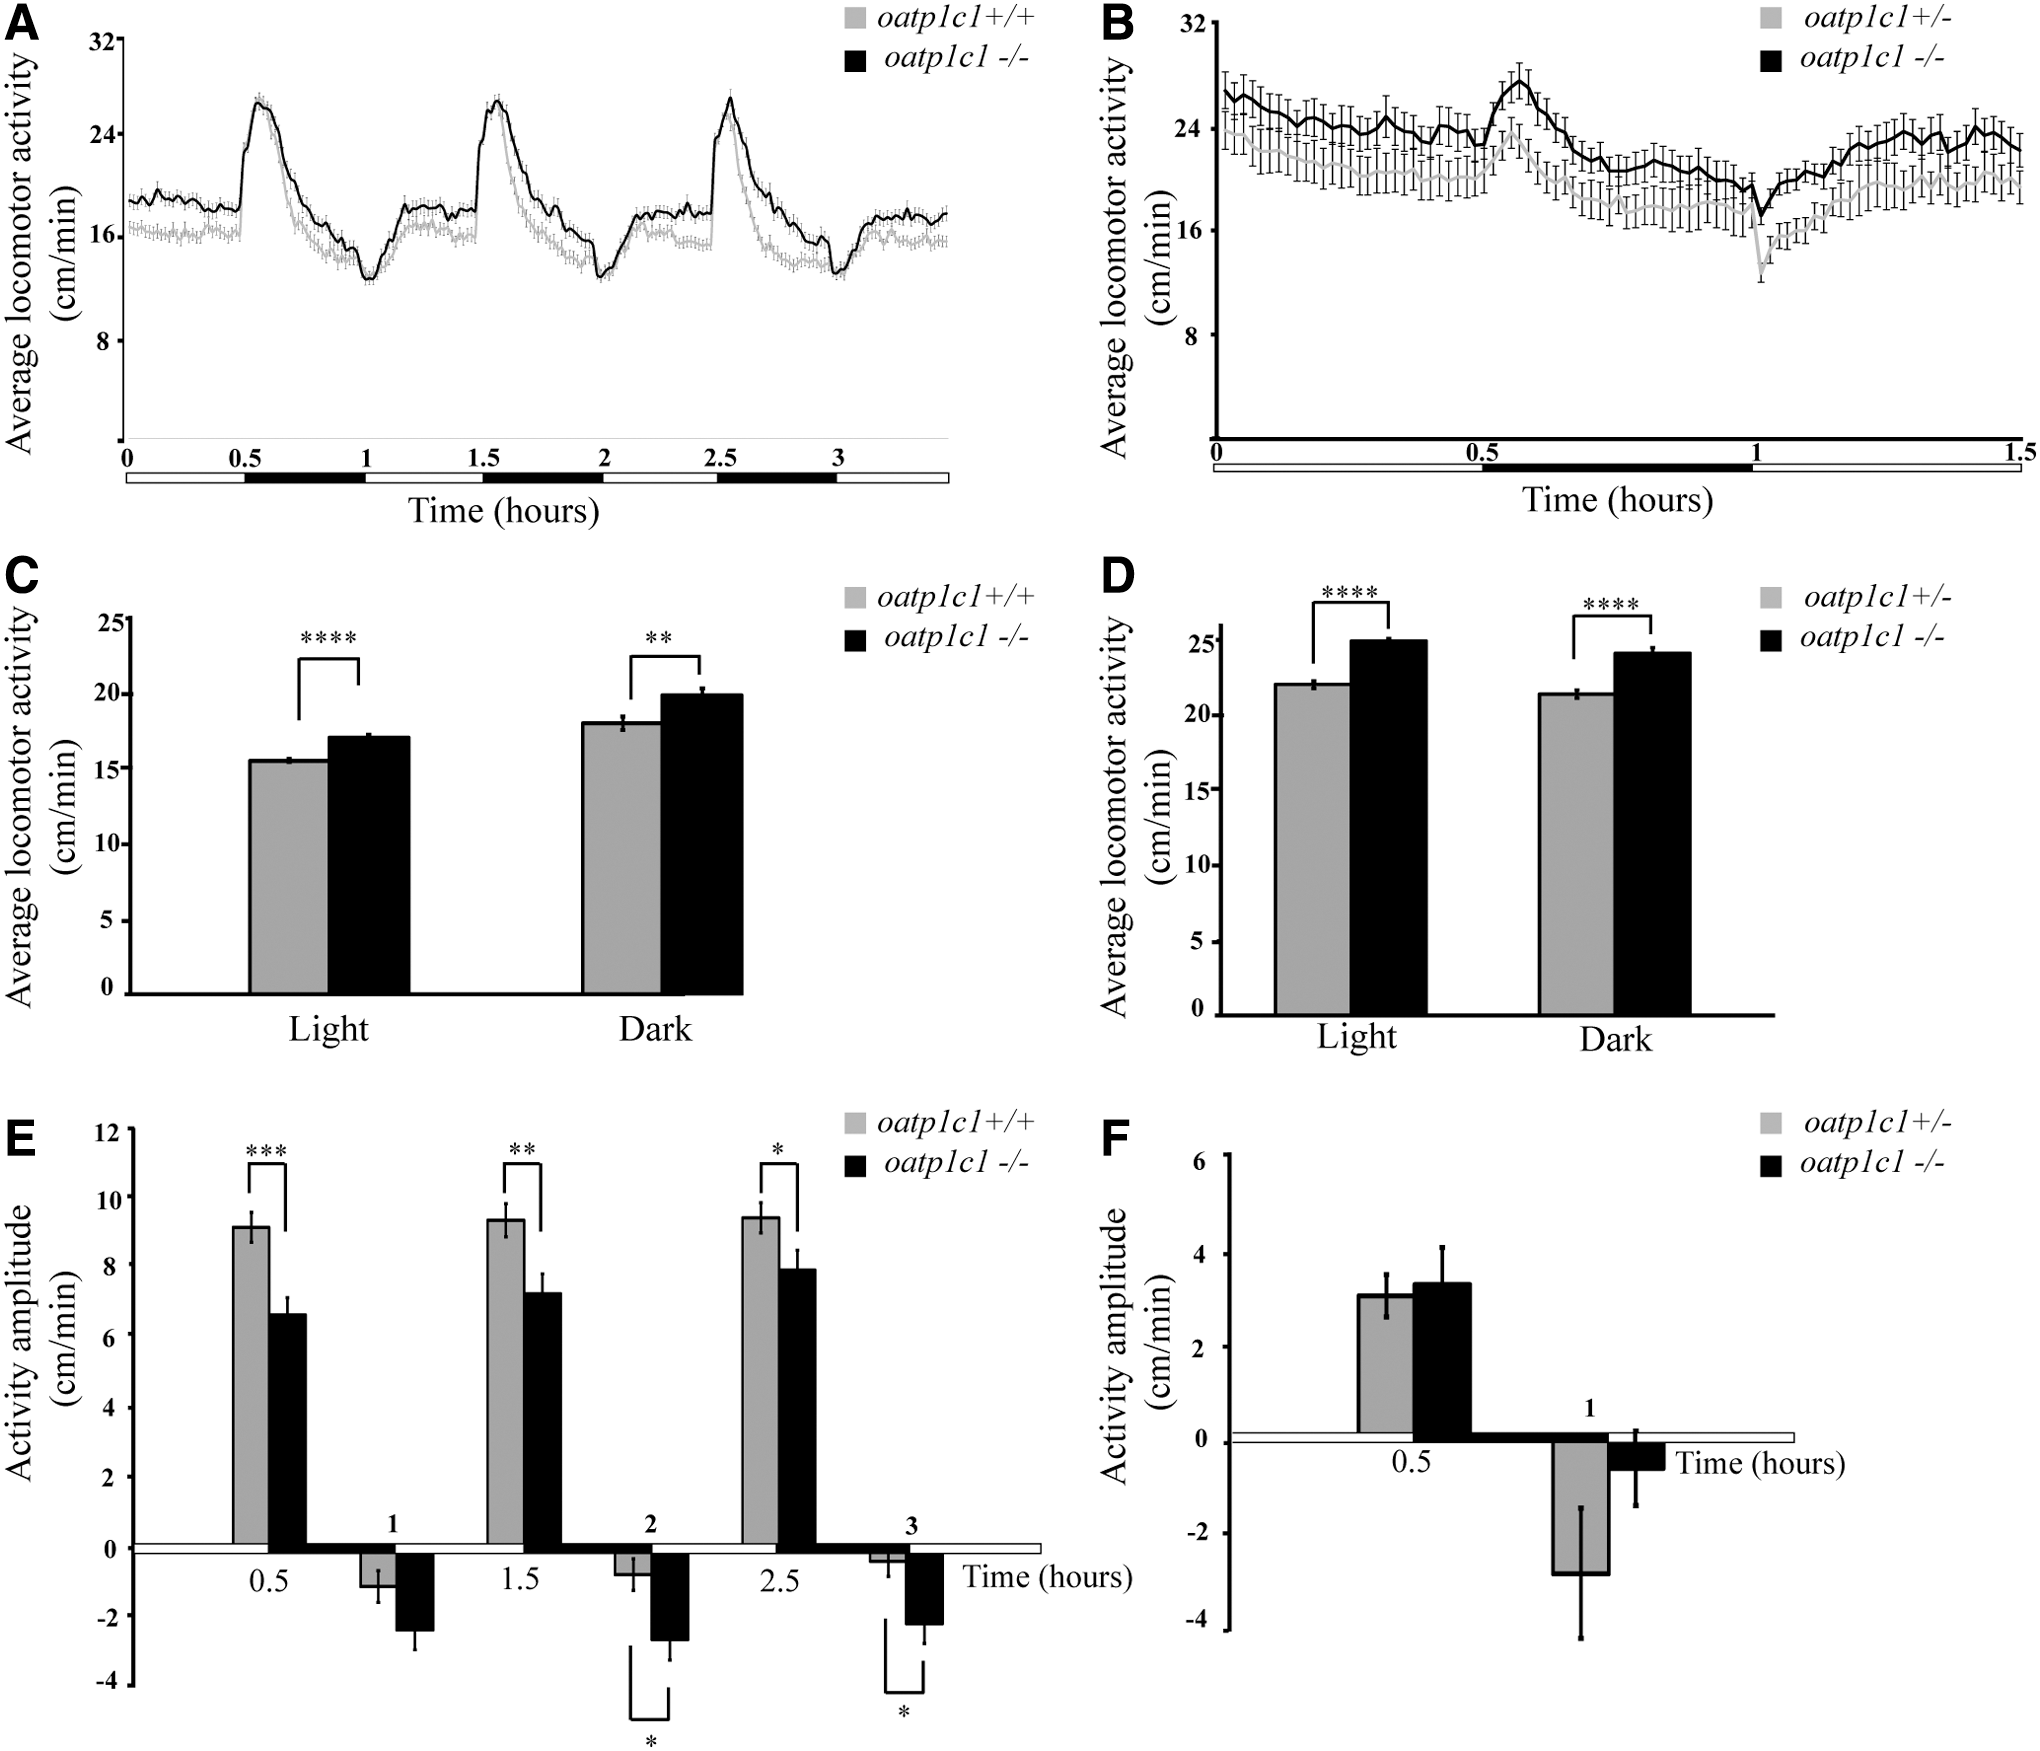
oatp1c1−/−
larvae exhibit increased locomotor activity and altered responses to light and dark transitions. (
Altered development of radial glial cells in oatp1c1
−/−
larvae
Loss of central white matter and brain degeneration were observed in the OATP1C1-deficient patient. In addition, a reduced number of oligodendrocytes were found in mct8−/− larvae, and hypomyelination is one of the hallmarks of AHDS (18). Therefore, to study the neurological cause for the behavioral alteration, we initially tested myelination and the development of oligodendrocytes in oatp1c1−/− larvae. The oatp1c1−/− fish were crossed with tg(mbp:EGFP) fish, which show EGFP expression in oligodendrocytes (28). The tg(mbp:EGFP)/oatp1c1+/− fish were inter-crossed, and the progeny was imaged and subsequently genotyped. At 6 dpf, the number of oligodendrocytes was quantified in the entire midbrain, and the width of the midbrain was measured. No differences were found between tg(mbp:EGFP)/oatp1c1−/− and tg(mbp:EGFP)/oatp1c1+/+ larvae (Fig. 4A–C), suggesting that myelination and brain size are intact in these brain regions.

Structural alteration in astrocytes and neurons of oatp1c1−/−
zebrafish. (
Based on measurements in the CSF and the expression of OATP1C1 in human astrocytes, it was hypothesized that glial cells are involved in the degenerative process observed in the OATP1C1-deficient patient. In mammals, a key attribute of neural stem cells is the expression of GFAP, an intermediate filament protein expressed in astrocytes and radial glial cells (29). In zebrafish, radial glial cells are neural/glial precursor cells and serve some of the specialized roles of astrocytes in mammals (30). Since oatp1c1 is expressed in Gfap-positive cells (Fig. 1M–O), we hypothesized that the development of the radial glial cells in oatp1c1−/− larvae could be altered. Supporting this notion, OATP1C1 is expressed in radial glial cells of the human fetal brain (31). To visualize single radial glial cells in live larvae, we used the her4.1:mCherry construct, which marks radial glia-type progenitors (32). A double labeling assay revealed that a significant population of her4-positive cells in the TeO is also Gfap positive in tg(her4.1:mCherry) X tg(gfap:Gal4/uas:EGFP) 6 dpf larvae (Fig. 4D–G). Thus, we injected the her4.1:mCherry construct into the progeny of oatp1c1−/− and WT-sibling fish. At 6 dpf, although the number of the radial glial cells did not change (Fig. 4H), the length of the glial cell extensions was longer by ∼11 μm in oatp1c1−/− larvae (106.07 ± 2.6 μm) compared with the WT larvae (94.85 ± 1.9 μm) (Fig. 4I–L, Q). Immunohistochemistry was used to monitor the expression pattern and structure of Gfap-positive cells in adult brain sections. The results showed increased Gfap expression and altered morphology of the glial-cell extensions in oatp1c1−/− compared with WT adult zebrafish (Fig. 4M–P). To validate these results, quantitative RT-PCR experiments were performed on adult brains. While no differences were found in the expression of mbp mRNA, the expression of gfap mRNA increased by 230% in oatp1c1−/− compared with WT sibling adult brains (Fig. 4R). Thus, loss of Oatp1c1 resulted in increased Gfap expression and structural alteration in the development of radial glial cells in zebrafish.
Reduced neuronal axons in oatp1c1
−/−
larvae
In the OATP1C1-deficient patient, brain MRI revealed reduced subcortical white matter and alteration in CSF, suggesting degeneration of neuronal extensions (10). Defects in glial development could affect the maintenance and maturation of neuronal axons (33). To examine the development of neuronal axons in oatp1c1−/− larvae, we imaged the neurites of the hypocretin/orexin (Hcrt) neurons. These neurons are located in the hypothalamus, and we characterized their wide axonal projections (34). The hcrt:EGFP construct (35) was injected into the progeny of oatp1c1−/− and WT-sibling fish, and the length of the axons projecting toward the spinal cord was quantified. At 6 dpf, the length of the axons was shorter by ∼130 μm in oatp1c1−/− larvae (723.03 ± 41.7 μm) compared with WT larvae (852.84 ± 28.3 μm) (Fig. 4S, T). These results show that loss of Oatp1c1 and TH transport into the brain alter the development of neuronal axons.
The development of goiter in oatp1c1−/− and oatp1c1−/− Xmct8−/− adults
Loss of Oatp1c1 resulted in hyperactivity of the HPT axis and possibly brain hypothyroidism in larvae (Fig. 2). Specifically, at 6 dpf, oatp1c1−/− larvae demonstrated increased expression of tg, presumably due to the increased size of the thyroid gland (Fig. 2O, P, S). Since OATP1C1 deficiency is a progressive disease, the endocrinological phenotype found in larvae is expected to persist and develop in adults. Indeed, a large red protrusive mass was observed under the jaw and anterior to the heart in oatp1c1−/− adults (Fig. 5C, D) compared with WT zebrafish (Fig. 5A, B). This red mass was bigger in mct8−/− Xoatp1c1−/− adults, where both TH transporters are mutated (Fig. 5E, F). In accordance with morphological criteria (36), The histopathological diagnosis showed that the mass is caused by thyroid follicular hyperplasia, that is, a goiter.

oatp1c1−/−
and mct8−/−
Xoatp1c1−/−
zebrafish exhibit abnormal large thyroid gland (goiter). (
Multiple round-to-oval follicles of various sizes were found in the thyroid gland of mct8−/− Xoatp1c1−/− adults (Fig. 5I, J), while a homogenous population of normal-size follicles was observed in WT siblings (Fig. 5G, H). Taking into account the increased trh and tsh levels in oatp1c1−/− larvae (Fig. 2), these results suggest that increased activity of the HPT axis causes goiter in both oatp1c1−/− and mct8−/− Xoatp1c1−/− adults.
TRIAC can normalize the goiter phenotype in oatp1c1−/− and oatp1c1−/− Xmct8−/− adults
The zebrafish is ideally suited for studying the mechanism and treatment of human disease, and the pronounced goiter provides an attractive opportunity to test therapeutic options. Thus, we conducted a comparative pharmacological assay and evaluated the restorative potential of two TH analogs: TRIAC/TA3 and DITPA. In vitro and in vivo studies have demonstrated that these TH analogs can enter the cells independently of the presence of Mct8 (37,38). Further, the effect of the T3 analog TRIAC and the TH receptor agonist DITPA on TH-dependent gene expression and neuropathology has been evaluated in Mct8-KO mice (38,39) and mct8−/− larval zebrafish (18,19). Although the effect of TH analogs on AHDS and Mct8 deficiency in model animals was intensively studied, little is known about the effect of TH analogs on Oatp1c1 deficiency. Intriguingly, TRIAC treatment given to the OATP1C1-deficient patient improved some of the clinical signs, including reduction of muscle spasms and startle-response episodes. However, it is unclear where and how much TRIAC penetrates the brain and whether it improves downstream TH signaling and the neurological symptoms in humans.
To monitor the putative therapeutic effect of TH analogs on Oatp1c1 deficiency, we treated adult oatp1c1−/− zebrafish with TH and TH analogs, and we monitored the size, color, and structure of their enlarged thyroid gland. The oatp1c1+/− adults were treated with 50 nM T4 (n = 3, the thyroid gland width was undetectable) (Fig. 6A), while the oatp1c1−/− adults were treated with 50 nM NaOH, T4, T3, DITPA, or TRIAC (n = 3 per treatment, thyroid gland width before treatment: 1.21 ± 0.29 mm, 0.67 ± 0.04 mm, 0.75 ± 0.09 mm, 1.03 ± 0.33 mm, 1.14 ± 0.41 mm, respectively) (Fig. 6B–F). These concentrations were chosen based on pre-calibration assays, and the highest dose that did not affect pigmentation, behavior, and the general morphology of the adult zebrafish was selected. Drugs were administered into the fish water for 48 hours, and the thyroid gland was imaged both before and after the treatment in each individual fish. As expected, the thyroid gland was not affected by T4 in the control oatp1c1+/− adults, which did not show thyroid gland abnormalities under baseline conditions (Fig. 6G). In oatp1c1−/− adults exhibiting goiter before treatment, NaOH, T4, and T3 did not affect thyroid gland structure, size, and color (thyroid gland width after the treatments: 1.25 ± 0.26 mm, 0.62 ± 0.08 mm, and 0.74 ± 0.18 mm, respectively) (Fig. 6H–J). However, DITPA slightly reduced the size (thyroid gland width after the treatment: 0.96 ± 0.32 mm) (Fig. 6K) and normalized the color of the thyroid gland, and TRIAC normalized the size and color of the thyroid gland in oatp1c1−/− adults (the thyroid gland was undetectable) (Fig. 6L). Next, we performed a similar experiment on mct8−/− Xoatp1c1−/− adults exhibiting an enlarged goiter (n = 4 in TRIAC treatment, n = 3 in all other treatments). T4 treatment of the control mct8+/+ Xoatp1c1+/+ adults did not affect the size and color of the normal thyroid gland (Fig. 6M, S). In addition, NaOH, T4, and T3 did not rescue the goiter in mct8−/− Xoatp1c1−/− adults (thyroid gland width before the treatments: 1.78 ± 0.48 mm, 1.79 ± 0.64 mm, 1.85 ± 0.12 mm; after treatments: 1.64 ± 0.53 mm, 1.77 ± 0.59 mm, 1.80 ± 0.21 mm) (Fig. 6N–P, T–V). Notably, DITPA slightly reduced the size (thyroid gland width before the treatment: 1.46 ± 0.67 mm; after treatment: 1.23 ± 0. 7 mm) (Fig. 6Q, W) and TRIAC normalized the size and color of the thyroid gland in mct8−/− Xoatp1c1−/− adults (thyroid gland width before the treatment: 1.16 ± 0.25 mm; after treatment: the thyroid gland was undetectable) (Fig. 6R, X). These results show that TRIAC, but not THs, can rescue the goiter phenotype. Since oatp1c1 is expressed primarily in brain endothelial cells (Fig. 1J–L), but not in the thyroid gland (Fig. 1B), the results suggest that TRIAC can cross the BBB even in the absence of Oatp1c1 or both Oatp1c1 and Mct8, and normalize the function of the HPT axis.
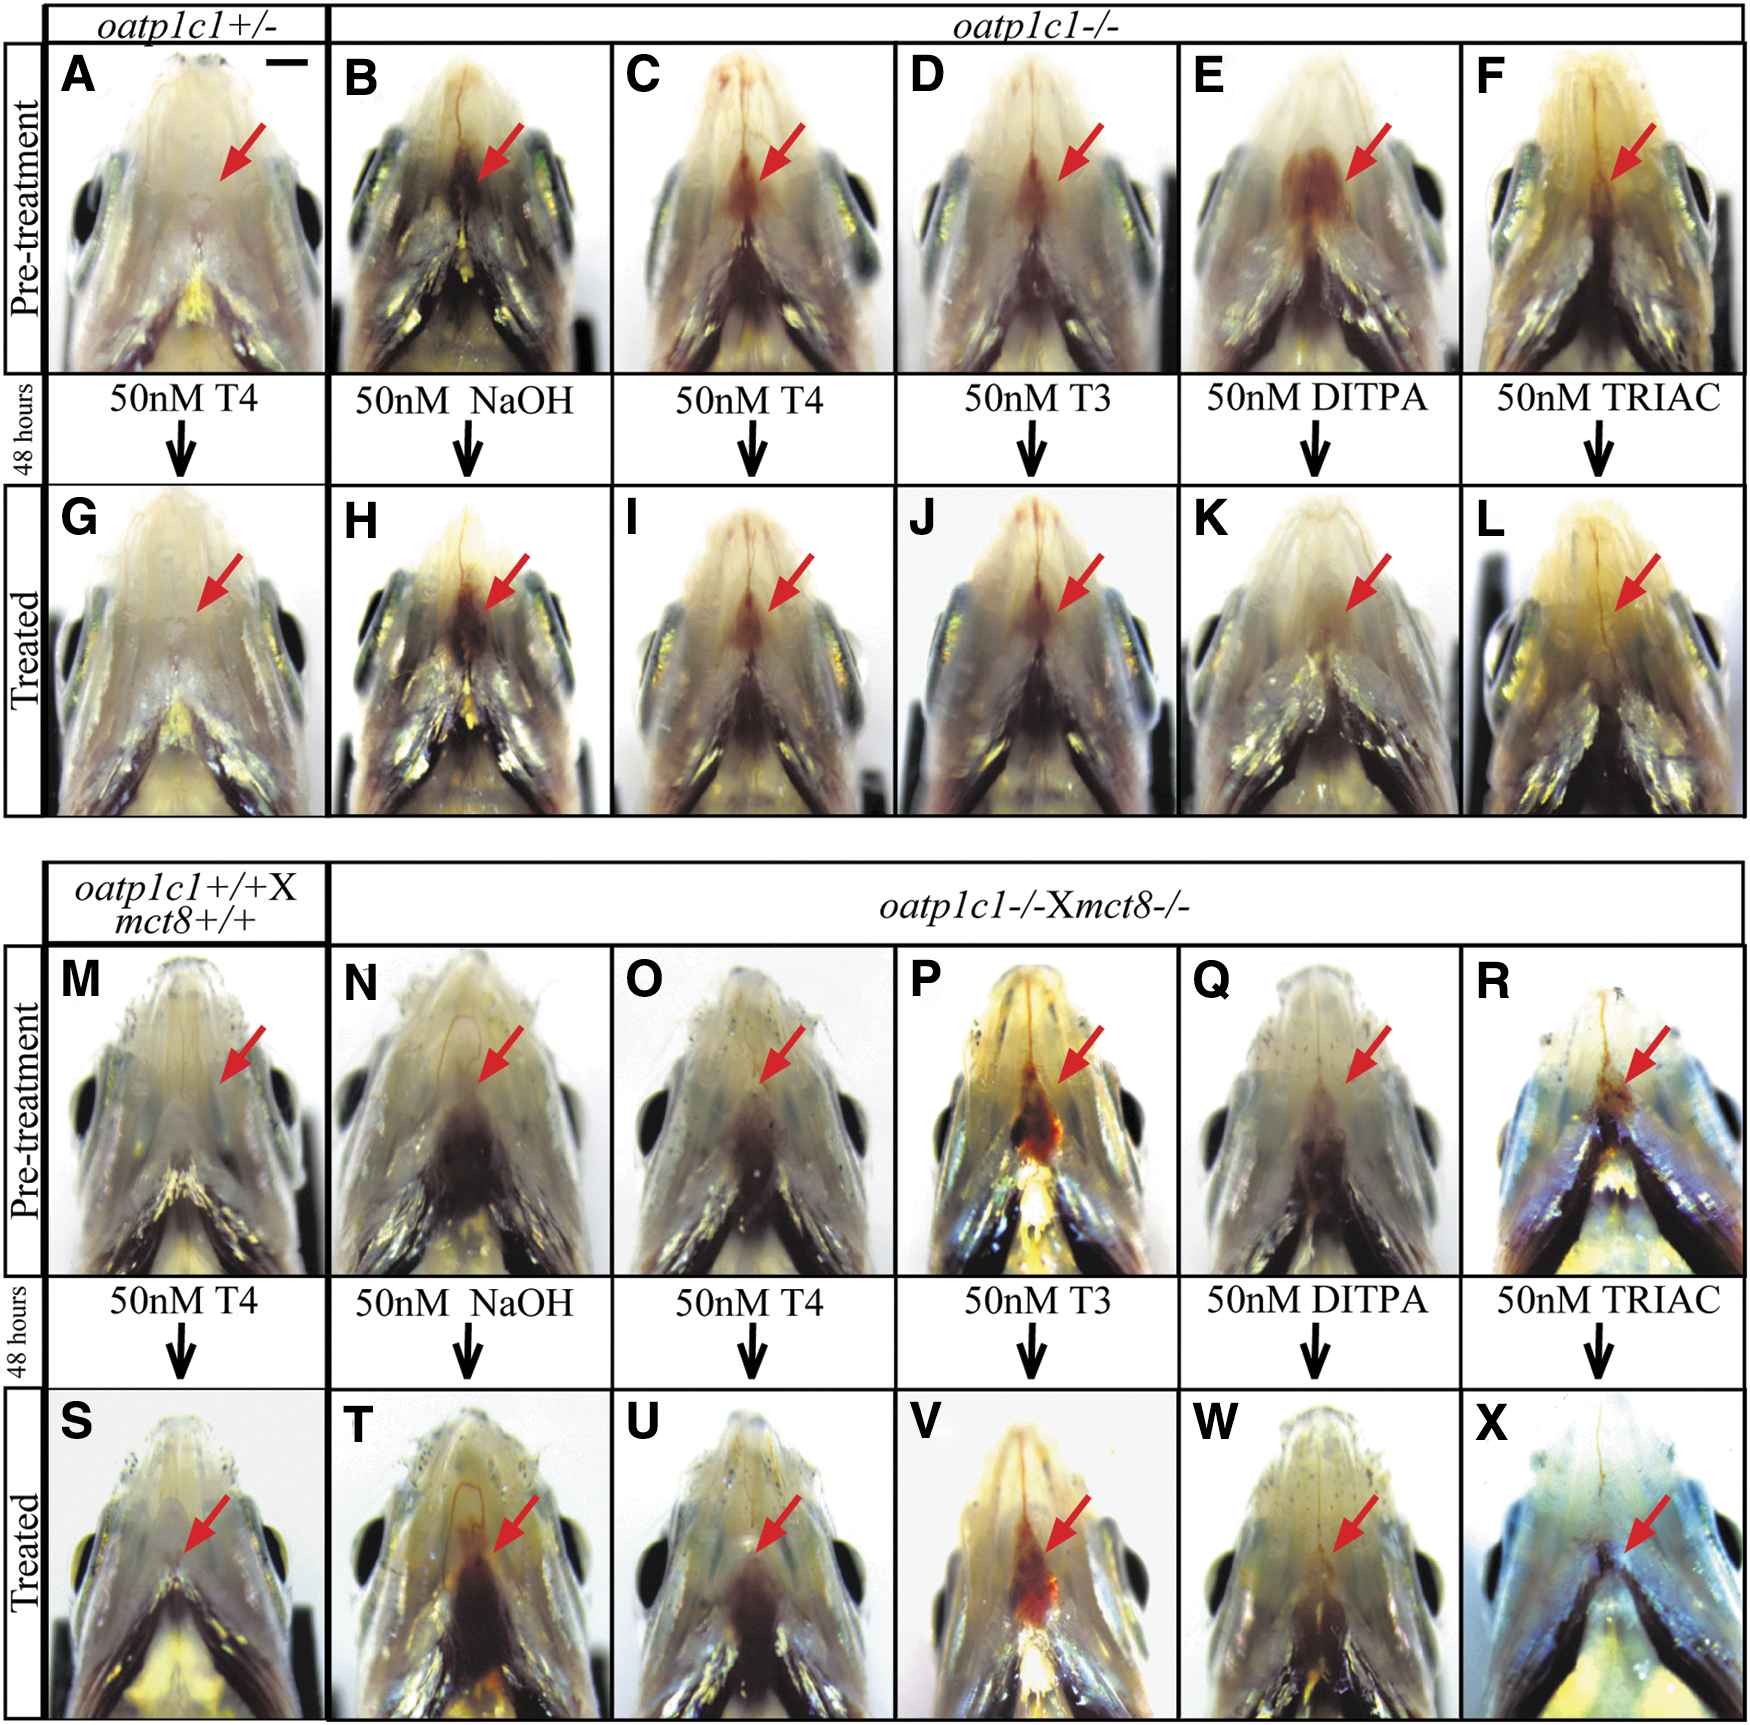
The TH analog Triac normalize the size of the thyroid gland in oatp1c1−/−
and mct8−/−
Xoatp1c1−/−
adults. All photos show the ventral part and the thyroid gland (marked with red arrow) of adult zebrafish. (
Discussion
Mutations in TH transporters and hypothyroidism in the brain result in severe developmental impairments (40). Recently, a new TH-resistant disease associated with a mutation in OATP1C1 was discovered. It is characterized by dementia, spasticity, intolerance to cold, gray, and white matter degeneration, and glucose hypometabolism (10). To study the mechanism and potential treatment of this disease, we established an oatp1c1−/− zebrafish model. Since oatp1c1 is primarily expressed in brain endothelial cells, lack of Oatp1c1 results in over-activation of the HPT axis and goiter in zebrafish, possibly because of brain hypothyroidism. Neuropathological examination revealed short neuronal axons in oatp1c1−/− larvae. Moreover, the extensions of radial glial cells are folded and longer in both larvae and adults. These neurological deficiencies are accompanied by hyperlocomotor activity. To test potential pharmacological treatments, the effect of THs and TH analogs were tested in oatp1c1−/− adult fish. Remarkably, TRIAC and, to a lesser extent, DITPA normalized the size and color of the thyroid gland, suggesting that these analogs can enter the brain and rescue the consequences of the underlying hypothyroidism.
A limited number of studies analyzed the spatial expression of OATP1C1 in the brain and its localization in specific cell types in humans. RNA-seq and immunostaining data suggest that OATP1C1 is expressed in radial glial cells, astrocytes, and epithelial cells of the choroid plexus in fetal and mature human brain. Minor expression was also detected in neurons and endothelial cells (31,41). In agreement, low or undetectable amounts of OATP1C1 mRNA were found in human induced pluripotent stem cell-derived neural cells and brain microvascular endothelial cells, respectively (42). Likewise, OATP1C1 expression in the human BBB was not detected by using proteomic assays (43). In contrast to the situation in humans, Oatp1c1 is primarily expressed in brain microvessels and endothelial cells in rodents. It is also expressed in astrocytes and—to a lower extent—in neurons in mice (11,12,44). Similar to the expression pattern found in mice, we showed that oatp1c1 is expressed primarily in the brain vascular system, but also in neurons and astrocytes in zebrafish. Unlike mct8, which is widely expressed in the vascular and neural systems in the entire zebrafish body (17), the expression of oatp1c1 is restricted to the brain. Although the cell-type expression pattern of OATP1C1 is not similar in all species, it is specifically expressed in the brain, where it regulates TH transport either through the BBB, the CSF–brain barriers, or directly in the glial cells and neurons. Further research is needed, particularly in humans, to understand the differences and similarities in OATP1C1 expression between animal models and humans.
In the reported patient, a homozygous missense mutation in OATP1C1 presumably causes hypothyroidism in the brain. In vitro studies showed that this mutation affects protein maturation, stability, and intracellular trafficking, thus its ability to function as a T4 transporter (10). Reinforcing the causal link between OATP1C1 deficiency and brain hypothyroidism, the expression levels of trh, tsh, and tg increased in oatp1c1−/− larvae, and pronounced goiter developed in adults. Notably, oatp1c1 is not expressed in the thyroid gland of zebrafish, and TRIAC, but not T3 and T4, can normalize the size of the thyroid gland in oatp1c1−/− adults. These results suggest that TRIAC penetrates the BBB even in the absence of Oatp1c1, normalize the activity of the HPT axis, and rescue the TH levels in oatp1c1−/− zebrafish. In Oatp1c1-KO mice, the activity of the HPT axis was unaffected; however, the concentrations of both T4 and T3 were reduced in the forebrain (12). The HPT axis is not affected in Oatp1c1-KO mice, possibly because other TH transporters, such as Mct8, are expressed in the hypothalamic TRH neurons and the supporting tanycytes and compensate for the lack of Oatp1c1. Altogether, the findings in zebrafish suggest that loss of Oatp1c1 reduces TH levels in the hypothalamus and possibly in the entire brain, which is similar to the endocrinological state hypothesized in the OATP1C1-deficient patient.
What is the neuropathological effect of OATP1C1-dependent brain hypothyroidism? In the patient carrying a homozygous missense mutation in OATP1C1, an increase in neurofilament light protein concentration was shown, suggesting cytoskeletal decay of axonal fibers. Indeed, the brain MRI of the affected patient revealed subcortical white matter atrophy and shrinkage of the corpus callosum (10). Similarly, in zebrafish, the axons of the Hcrt neurons were shorter in oatp1c1−/− larvae. These neurons were studied because they project widely in the brain, and their axonal organization and targets are well described (45). However, additional neuronal populations should be studied to identify the brain regions that are most affected by the lack of Oatp1c1 in zebrafish and mammals. Additional key cell types that seem to be affected by OATP1C1 deficiency in humans are astrocytes. This glial deficiency was proposed to be involved, because T4 uptake by astrocytes is facilitated by OATP1C1 in humans (46) and GFAP levels in the CSF were found to be elevated in the OATP1C1-deficient patient (10). In mammals, astrocytes are involved in a variety of brain functions, including responding to neuronal injury, providing metabolic support to neurons, and maintenance of the BBB. The zebrafish radial glia cells can play some specialized roles of mammalian differentiated astrocytes. We used live imaging of single radial glial cell body and extension, as well as quantification of gfap expression, to monitor glial abnormalities in oatp1c1−/− larvae and adults. Similar to the findings in the OATP1C1-deficient patient, gfap expression increased in the brain of oatp1c1−/− zebrafish. Further, the morphology of the glial extension was altered in larvae and adults. Since oatp1c1 is expressed in Gfap-positive glial cells, and radial glial cells function as neural/glial precursor cells, it is possible that lack of THs, specifically in radial glial cells, leads to the neural defects. However, since oatp1c1 is primarily expressed in brain endothelial cells, an alternative mechanism could be that hypothyroidism in the entire brain is the cause for both glial and neuronal defects.
The symptoms associated with human OATP1C1 deficiency are severe, yet no apparent phenotype was observed in the mouse model (10,12). Similarly, Mct8-KO mice did not exhibit a neurological and behavioral phenotype, most likely because of functional overlap between Oatp1c1 and Mct8 in the murine brain (13). In contrast and similar to the reported human case, we found a significant neurological and behavioral phenotype in oatp1c1−/− larvae and adults. One of the most striking phenotypic characteristics is goiter, which is apparent in oatp1c1−/− adult zebrafish. Goiter provides a convenient readout to test the effect of drugs on the HPT axis and the thyroid gland. In the human patient, the clinical course was improved by treatment with TRIAC (30). Thus, we tested the effect of THs, TRIAC, and DITPA on the size of the thyroid gland in oatp1c1−/− adult zebrafish. TRIAC and, to a lesser extent, DITPA, but not T4 and T3, were able to rescue the goiter phenotype, which suggests that the TH analogs can penetrate the BBB and normalize not only the activity of the HPT axis but also additional Oatp1c1-dependent neurological and behavioral deficiencies. Since the zebrafish is well suited for high-throughput pharmacological screens (16), future experiments involving oatp1c1−/− zebrafish could further characterize the therapeutic effects of TH analogs on an array of neurological symptoms, and they may lead to the identification of new therapeutic molecules.
Footnotes
Acknowledgment
The authors thank Ms. Yael Laure for assistance in editing this article.
Author Disclosure Statement
No competing financial interests exist.
Funding Information
This work was supported by grants from the Sherman Foundation and the University of Technology Sydney (590262), the Chief Scientist Office of the Ministry of Health (CSO-MOH), Israel, as part of the ERA-Net for Research Programmes on Rare Diseases (E-RARE, 3-10861), the German-Israeli Foundation for Scientific Research and Development (GIF, I-1314-418.13/2015), and Fondation Jérôme Lejeune (1675).