
Abstract
Background:
Overdiagnosis is the leading factor contributing to the rapid increase in thyroid cancer incidence of the last decades. During this period, however, thyroid cancer incidence has not been increasing at a constant pace. We hypothesized that changes in the slope of the incidence trends curve, called joinpoints, could be associated with changes in clinical practice guideline recommendations.
Methods:
Data were obtained from the initial nine registries of the Surveillance, Epidemiology, and End Results (SEER) Program. Thyroid cancer incidence was analyzed from 1975 to 2016. Joinpoints in thyroid cancer incidence trends and clinical variables were correlated with significant changes in clinical practice recommendations.
Results:
Incidence rate trends of medullary and anaplastic thyroid cancer were constant during the study period. Among papillary thyroid cancers (PTCs), three main joinpoints were identified, mainly driven by changes in incidence trends of smaller cancers. First, acceleration followed by two deceleration periods in thyroid cancer incidence coincident in time with the release of American Thyroid Association guidelines in 1996, 2009, and 2015. In 1996, the use of thyroid ultrasound and fine needle aspiration biopsy for the evaluation of thyroid nodules was described; and in 2009 and 2015, higher size thresholds for the biopsy of thyroid nodules were set. For the follicular variant of PTC, a joinpoint was observed around 1988, when the histological diagnosis of this entity was revised in the World Health Organization classification; and another one in 2015 coinciding with the proposal to remove the term carcinoma from noninvasive follicular-pattern tumors with papillary-like nuclear features which contributed to drive down the overall thyroid cancer incidence. Follicular thyroid cancer incidence was affected as well by changes in the guidelines, but to a lesser extent, and it was fairly stable during the study period.
Conclusions:
This study suggests that thyroid cancer incidence trends have been shaped, in large part, but not completely, by changes in professional guideline recommendations.
Introduction
Thyroid cancer incidence is increasing the second fastest among solid tumors, and it is already the sixth most common cancer among women in the United States (1). Most newly diagnosed thyroid cancers are less than 2 cm in size, presumably largely asymptomatic disease (2). Several studies have linked thyroid cancer incidence with socioeconomic status and access to health care (3,4), use of thyroid ultrasound (5 –7), and even with indirect factors of thyroid ultrasound use such as physicians' age and American Association of Clinical Endocrinologists' (AACE) membership status, a professional association that has played a key role in training physicians in thyroid ultrasound imaging (7 –9). Although a true increase in thyroid cancer incidence has not been ruled out, overdiagnosis has been recognized as the driving force in this “thyroid cancer epidemic” (10,11). Recently the U.S. Preventive Services Task Force has issued a recommendation statement against screening for thyroid cancer in asymptomatic patients (12).
Thyroid cancer incidence rates have been consistently increasing for the last four decades (13,14). However, the incidence rates have not been increasing at a constant pace, nor homogeneously across tumor types. In fact, when examining the incidence trends, one can identify points in which the slope of the curve changes. These are called joinpoints. A recent study suggested that a decrease in thyroid cancer incidence trends, a joinpoint, in 2009 could be associated with the release that same year of new management guidelines by the American Thyroid Association (ATA) for patients with thyroid nodules and thyroid cancer (15,16). We hypothesize that other joinpoints could also be reflecting changes in clinical practice following clinical guidelines' recommendations. To test this hypothesis, we analyzed the Surveillance, Epidemiology, and End Results (SEER) program (SEER 9 cancer registries), and looked for changes in clinical practice recommendations around joinpoints that could explain the observations.
Methods
Data source and inclusion criteria
A retrospective analysis was conducted utilizing incidence data from the SEER Program of the National Cancer Institute (NCI). The SEER database contains high-quality data for incidence and population-based variables such as sex, age at diagnosis, and histology. Although the SEER registries cover ∼34.6% of the U.S. population, we used the information of the first 9 SEER registries only (Atlanta, Connecticut, Detroit, Hawaii, Iowa, New Mexico, San Francisco-Oakland, Seattle-Puget Sound, and Utah), which represent 10% of the U.S. population, to analyze incidence trends for a longer period of time (from 1975 to 2016). Incidence rates were calculated based on SEER's allowance for a 22-month standard delay in reporting to account for anticipated future corrections to the data due to lags in data capture and correctness (17,18). Data were downloaded on April 5, 2019, from SEER Program SEER*Stat Database (NCI, DCCPS, Surveillance Research Program, released April 2019, based on the November 2018 submission).
This study was outlined following the guidance provided by the Office of Human Research Protection in 45 CFR 46.102, and approved as Non-Human Subjects Research by the H. Lee Moffitt Cancer Center and Research Institute, Tampa, FL.
All cases with a primary diagnosis of thyroid cancer determined by the International Classification of Diseases for Oncology, Third Edition code C73.9 were included in the study. All cases were classified into the following histologic subtypes: papillary thyroid cancer (PTC): 8050, 8052, 8130, 8260, 8341–8344, 8350, 8450, 8452; follicular thyroid cancer (FTC): 8290, 8330–8332, 8335; medullary thyroid cancer (MTC): 8345–8347, 8510; and anaplastic thyroid cancer (ATC): 8020–8035 (14,19). Incidence trends for the two main PTC variants, conventional PTC (C-PTC) and follicular variant PTC (FV-PTC), were also analyzed. The following codes were classified as C-PTC: 8050 (papillary carcinoma, not otherwise specified [NOS]), 8260 (papillary adenocarcinoma, NOS), 8341 (papillary microcarcinoma), and 8343 (papillary carcinoma, encapsulated). The code 8340 was used for papillary carcinoma, FV-PTC.
In addition to histology, demographic and clinical characteristics such as age, sex, age at diagnosis, tumor size, and tumor stage at diagnosis were evaluated. We divided our population into three groups based on age at diagnosis. (i) Overall population, defined as individuals aged 0 and older. (ii) Adolescent and young adult population, defined as 15–39 years of age (as defined by the NCI). (iii) Older adults, defined as 40 years of age and older (20,21). There were too few cases in the pediatric population (ages 0–14 years; <500 cases during the entire study period) to analyze incidence trends in this group separately. SEER started collecting tumor size in 1983. The size of the primary tumor was extracted from the Extent of Disease-4 codes between 1983 and 1987; from the Extent of Disease-10 codes between 1988 and 2003; from the Collaborative Staging codes between 2004 and 2015; and Tumor Size Summary (2016+). Tumor size was divided into four categories: ≤1.0, 1.1–2.0, 2.1–4.0, and >4.0 cm for our analysis. The SEER categories excluded from our analysis were “no mass identified,” “microscopic,” and “unknown” (Tables 1 and 2).
Clinical and Demographic Characteristics of Thyroid Cancer Cases in SEER 9 Registries (N = 90,803)
Bold values indicate that the AAPC is significantly different from zero at the alpha = 0.05 level.
Overall thyroid cancer includes PTC, follicular thyroid cancer, medullary thyroid cancer, and anaplastic thyroid cancer.
PTC includes ICD-O-3 codes for C-PTC, FV-PTC, and other variants.
Rates (per 100,000) were adjusted to the 2000 U.S. standard population.
Percentage of overall thyroid cancer cases (N = 90,803).
Tumor size was collected from 1983 to 2016.
Code for microscopic tumor size was only used for collaborative staging (2004–2015) even though EOD4, EOD10, and tumor size summary (2016+) included codes for microscopic size.
Missing values for cases from 1975 to 1982.
Missing values for cases in 2016.
AAPC, average annual percentage change; C-PTC, conventional papillary thyroid cancer; FV-PTC, follicular variant papillary thyroid cancer; ICD-O-3, International Classification of Diseases for Oncology, Third Edition; PTC, papillary thyroid cancer; SEER, Surveillance, Epidemiology, and End Results.
Clinical and Demographic Characteristics of Conventional Papillary Thyroid Cancer and Follicular Variant Papillary Thyroid Cancer
Bold values indicate that the AAPC is significantly different from zero at the alpha = 0.05 level.
ICD-O-3 codes for C-PTC and FV-PTC were used.
Rates (per 100,000) were adjusted to the 2000 U.S. standard population.
Percentage of overall thyroid cancer cases (N = 90,803).
Tumor size was collected from 1983 to 2016.
Code for microscopic tumor size was only used for collaborative staging (2004–2015) even though EOD4, EOD10, and tumor size summary (2016+) included codes for microscopic size.
Missing values for cases from 1975 to 1982.
Missing values for cases in 2016.
Because the American Joint Committee on Cancer/Union for International Cancer Control (AJCC/UICC) staging system was not available in SEER until 2004, we used the SEER historic stage A, available from inception to 2015, to characterize staging as follows: localized (single or multifocal invasive tumor(s) confined to thyroid); regional (tumor extended beyond thyroid gland); distant (extended beyond thyroid gland to other organs or also known as primary tumor is metastatic); and unstaged (unknown stage). All variables in SEER are obtained from medical records and cancer registries.
Data analysis
The NCI's SEER*Stat software version 8.3.5. was used to calculate age-adjusted incidence rates (22). All rates were adjusted to the 2000 U.S. standard population (per 100,000 person-years). The Joinpoint Regression software version 4.7.0.0 February 2019 (Statistical Methodology and Applications Branch, Surveillance Research Program, NCI) (23) was used to calculate the annual percent changes (APCs), average annual percentage changes (AAPCs), and 95% confidence intervals [CI] (23). The best-fitting log-linear regression model to identify the minimum number of joinpoints necessary to fit the data was selected (22). Other analyses were performed using SAS version 9.4 (SAS Institute, Cary, NC).
Results
Study cohort
There were a total of 90,803 incident cases of thyroid cancer identified between 1975 and 2016 in the SEER 9 registries. Two-thirds of the incident cases (67.75%) were diagnosed in patients 40 years of age and older and 75.04% of the patients were females (Table 1). PTC was the most common type of thyroid cancer (86.35%); followed by FTC (10.17%), MTC (2.26%), and ATC (1.23%) out of all the thyroid cancer cases. The most common variants of PTC were the C-PTC (61.40%) and FV-PTC (24.20%) out of all the PTC cases (Table 2). Most cases were ≤2 cm in size: 29.96% were between 0.01 and 1.0 cm; 24.42% were between 1.1 and 2.0 cm; 21.03% were between 2.1 and 4.0 cm; and 8.69% were >4.0 cm for overall thyroid cancer. According to the SEER historic stage A, 57.28% of the cases were localized; 31.71% were regional; 3.97% were distant; and 1.98% unstaged at diagnosis of thyroid cancer.
The overall thyroid cancer incidence rate showed a 2.77% increase [CI 1.60–3.74%]. During the entire study period, thyroid cancer incidence rates grew faster in patients 40 years or older than in patients younger than 40 years (2.94% [CI 1.78–4.10%] versus 2.00% [CI 1.33–2.68%], respectively) (Table 1). Between 1975 and 2016, thyroid cancer incidence rates increased faster for PTCs (AAPC of 3.30 compared with −0.02 in FTC; and −0.41 in ATC); for small tumors (AAPC of 6.01, 4.38, 3.35, and 5.12 for tumors ≤1, 1.1–2, 2.1–4, and over 4 cm, respectively); and for tumors with regional SEER historic stage A (AAPC of 4.43 compared with 3.29 for localized, and 1.61 for distant disease) (Table 1).
Joinpoints in thyroid cancer incidence trends
Figure 1 summarizes the trends in incidence rates and tumor characteristics for all thyroid cancers, as well as for PTC, C-PTC, FV-PTC, and FTC separately (see also Supplementary Fig. S1). The trends for MTC and ATC are not displayed individually in the chart because incidence rates and tumor characteristics were stable during the study period.
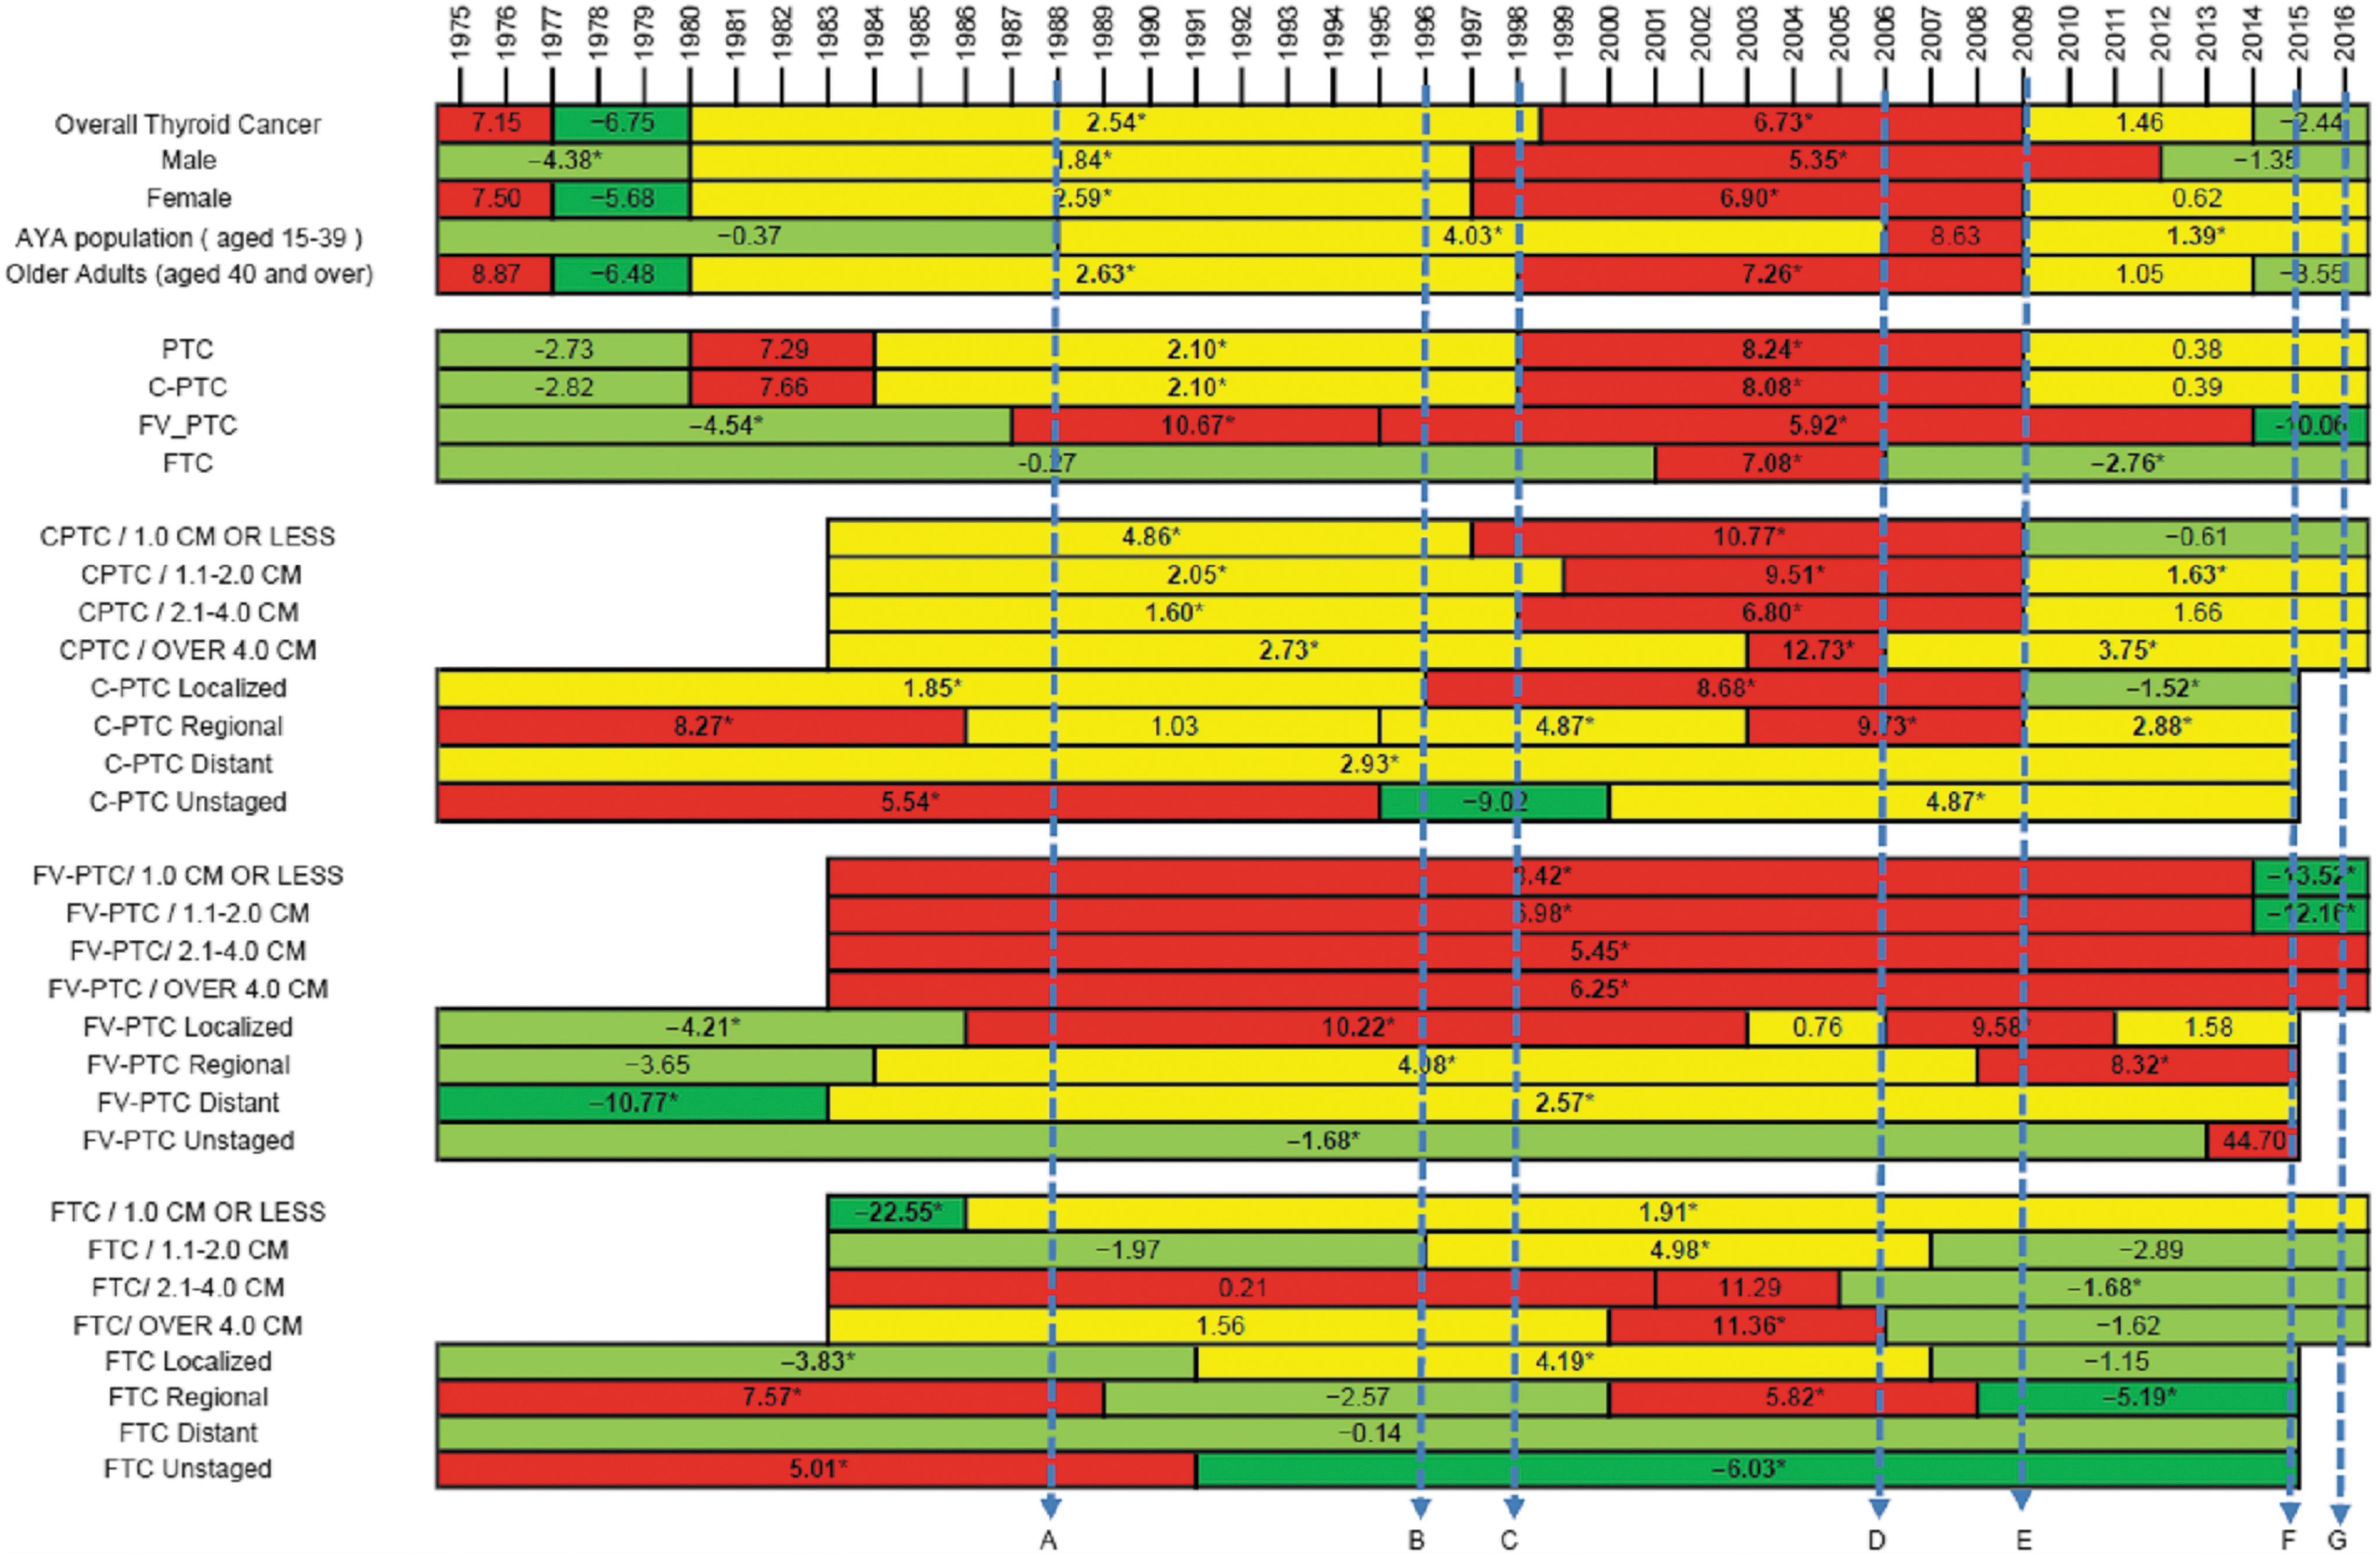
Dark green, negative incidence rate trend with APC ≤ −5.0; light green, negative incidence rate trend with APC between −0.1 and −4.9; yellow, positive incidence rate trend with APC between 0.1 and 4.9; red, positive incidence rate trend with APC ≥5.0. *Indicates that the APC is significantly different from zero at the alpha = 0.05 level. Thyroid cancer incidence rate trends—APCs. Joinpoints are displayed as stacked bars. The number in each bar represents the APC in thyroid cancer incidence for that period. Dashed lines are used to reference clinical landmarks and their association with joinpoints. A: Change in World Health Organization classification to classify follicular pattern lesions with PTC nuclear changes as FV-PTC. B: ATA describes utility of US and FNA within their treatment guidelines. C: AACE first thyroid ultrasound-specific course C. D: ATA recommends for the extent of surgery, indications for pCLND, and use of RAI ablation. E: ATA 2009 guidelines specifying thresholds for biopsy and Bethesda system standardizing cytology reporting. F: ATA 2015 guidelines specifying higher thresholds for biopsy. G: Change in FV-PTC diagnostic criteria (NIFTP terminology proposed). AACE, American Association of Clinical Endocrinologist; AAPC, average annual percentage change; APCs, annual percent changes; ATA, American Thyroid Association; FV-PTC, follicular variant papillary thyroid cancer; FNA, fine needle aspiration; NIFTP, noninvasive follicular thyroid neoplasms with papillary-like nuclear features; pCLND, prophylactic central lymph node dissection; PTC, papillary thyroid cancer; RAI, radioactive iodine; US, ultrasound.
Thyroid cancer incidence increased at an APC of 7.15% [CI −3.90% to 19.4%] between 1975 and 1977. This was followed by a three-year period (1977–1980) of decreasing incidence at an APC of −6.75% [CI −16.00% to 3.60%]. Thyroid cancer incidence trends stabilized thereafter for the next 18 years, growing at an APC of 2.54% [CI 2.20–2.90%] until 1998. Then, the slope of the incidence trend curve became steeper growing at an APC of 6.73% [CI 6.20–7.20%] until 2009, when the increasing incidence plateaued and continued to grow at a slower pace with APC of 1.46% [CI −0.10% to 3.00%] for another 5 years. After 2014, incidence rate trends became negative for the first time in 34 years with an APC of −2.44% [CI −6.80% to 2.20%]. Incidence trends for all thyroid cancers were mostly superimposable to those of PTC (all variants) and C-PTC, were similar for males and females, and for adults 40 years or older but not for younger patients. In patients aged 15 to 40 years, incidence trends showed an increasing trend at APC of 4.03% [CI 3.50–4.50%] between 1998 and 2006, which accelerated between 2006 and 2009, APC of 8.63% [CI −2.80% to 21.4%], and then continued at a slower pace at APC of 1.39% [CI 0.00–2.80%] from 2009 to 2016.
The incidence trends of FV-PTCs were different from those of C-PTC. The APC in FV-PTCs decreased −4.54% [CI −6.30% to −2.70%] annually since 1975 until 1987 when the first joinpoint was observed. Since 1988, FV-PTC incidence started to grow with an APC of 10.67% [CI 6.50–15.00%] until 1995; when incidence trends continued to grow at a slower pace for the next 20 years, APC of 5.92% [CI 5.40–6.40%]. After 2014, however, incidence rate trends of FV-PTC decreased abruptly and became negative, APC −10.06% [CI: −20.60% to 1.90%]. FTC incidence rates were constant between 1975 and 2001, APC −0.27% [CI: −0.70% to 0.10%]; increased with APC 7.08% [CI 1.20–13.30%] from 2001 to 2006; and then decreased at APC −2.76% [CI −4.00% to −1.50%] thereafter.
Incidence trends for different histologic types by size and by SEER stage A are presented in Supplementary Figures S2 and S3.
Association of joinpoints with changes in professional guidelines
There are two main joinpoints common to C-PTC, PTC (all variants), and all thyroid cancers. The first one, around 1996–1999, demarcates an acceleration in thyroid cancer incidence rates. Coincidentally with this abrupt change, we identified two landmarks that consolidated thyroid ultrasound and fine needle aspiration biopsy as the routine tests to characterize thyroid nodules. In 1996, the ATA published their first guidelines for the treatment of patients with thyroid nodules and well-differentiated thyroid cancer, in which the utility of thyroid ultrasound and fine needle aspiration biopsy for the evaluation of thyroid nodules was described (24). Shortly after that, in 1998, the AACE gave the first thyroid ultrasound-specific course. Since then, the AACE has played a major role in training practicing physicians in the use and interpretation of thyroid ultrasound. Supporting the association between these two clinical practice landmarks and the trends in thyroid cancer incidence, the largest AAPC increment was observed for small (<2 cm), localized, C-PTCs, most of which are expected to be impalpable and/or clinically silent, and thus, more likely a consequence of ultrasound screening.
The second relevant joinpoint common to C-PTC, PTC (all variants), and all thyroid cancers was observed between 2009 and 2010. At this time, thyroid cancer incidence trends abruptly decelerated. As pointed out by a recent publication (15), in 2009, the ATA published updated guidelines for the management of patients with thyroid nodules and differentiated thyroid cancer (25). Although a previous update had been released in 2006 (26), it was in 2009 that size thresholds for biopsy were established. In particular, the 2009 guidelines discouraged the biopsy of nodules smaller than 1 cm and set higher biopsy thresholds for less suspicious nodules. Supporting the impact of the guidelines on thyroid cancer incidence rates, AAPCs changed the most for small (≤2 cm), localized, C-PTCs, thus reversing the changes observed following the initial ATA guideline publication.
These two joinpoints, however, do not seem to be correlated as much with the incidence trends of FV-PTC. In fact, the two most relevant joinpoints in the incidence rates of FV-PTC were observed in 1988 and 2015. In 1998, the World Health Organization modified the classification of thyroid tumors (27). In particular, the diagnosis of thyroid cancers was no longer solely dependent on the growth pattern (follicular or papillary), but on the presence of atypical nuclear features. Rapid increases in incidence rate trends of FV-PTCs at the localized and regional stage were observed, while the incidence rate trends of regional FTCs decreased at the same time. The later joinpoint in the FV-PTC curve in 2015 seems to be driving the decrease observed in overall thyroid cancer incidence rates and particularly in older adults in the last 2 years analyzed. This decrease in incidence is mostly at the expense of small (<2 cm) FV-PTCs. Two main hallmarks are likely responsible for this finding. First, the release of the 2015 ATA guidelines in which higher thresholds for biopsy were proposed, particularly for sonographic patterns associated with follicular-pattern lesions, such as FV-PTCs (28). And second, the change in diagnostic criteria for FV-PTC that was published in 2016 (29). As a result of this publication, many tumors previously classified as FV-PTC are expected to be reclassified as noninvasive follicular thyroid neoplasms with papillary-like nuclear features (NIFTP); while some others are expected to be reclassified as C-PTC due to the presence of some areas of true papillae or psammoma bodies despite a predominant follicular architecture (29).
Discussion
Previous studies described an association between direct factors (such as sex, age, and race/ethnicity) or indirect factors (in particular socioeconomic indicators) of increased thyroid cancer screening and thyroid cancer incidence (3 –6,8 –10). This study suggests that abrupt changes in thyroid cancer incidence trends, joinpoints, might be explained, at least in part, by changes in professional guideline recommendations. Although the adherence of practicing physicians to these changes cannot be retrospectively determined, thyroid cancer incidence trends are consistent with the expected effect that the guideline recommendations should have had if appropriately followed.
Incidence trends for all thyroid cancers were mostly superimposable to those of PTC (all variants), and C-PTC in particular. This suggests that, as the most prevalent cancer type, changes in C-PTC incidence trends determine the joinpoints of PTC (all variants) and thyroid cancer overall. C-PTCs are easily identified with thyroid ultrasound. After all, suspicious sonographic features were selected based on their cancer specificity in cohorts where C-PTC was the predominant malignancy (30). In addition, the prevalence of small, clinically silent, C-PTCs in the general population is very high, over 10% in autopsy series (31). For these two reasons, it is not surprising that thyroid cancer incidence trends increased the most among small, localized, C-PTCs, once thyroid ultrasound was consolidated as a necessary test for the evaluation of thyroid nodules following the publication of the initial ATA guidelines in 1996; and that thyroid incidence rates stabilized after 2009, when the biopsy of small, even if suspicious on ultrasound, tumors was discouraged (24,25). Nonetheless, larger size C-PTC (>4 and 2–4 cm) incidence rates also increased over time. This finding is probably not explained by overdiagnosis, thus suggesting that other factors, including a true increase in incidence rates, might be contributing to the observations (2).
FV-PTCs, such as FTCs, are usually associated with a less suspicious sonographic appearance (32,33), and diagnosed with larger tumor sizes than C-PTCs (34). Although thyroid cancer incidence trends for these tumor types continued to grow between 1996 and 2009, the impact of the ATA guidelines on these tumor types is less apparent until 2015 when the latest guidelines suggested a larger size threshold for biopsy of nodules less suspicious by ultrasound. On the contrary, in 1988, there was an abrupt change in thyroid cancer incidence for FV-PTCs that did not affect the trends of other cancer types. It seems that, as a consequence of the new histological classification, invasive tumors with nuclear features of PTC previously classified as FTCs on the basis of follicular architecture started to be classified as FV-PTCs. This is supported by the increase in regional FV-PTCs and specular decrease in regional FTCs. Localized FV-PTCs increased very rapidly as well. This change, however, did not correlate with a decrease in localized FTCs. Although the SEER registry does not have sufficient histological data to know with certainty, the data suggest that NIFTPs, which would have been previously classified as follicular adenomas, started to be classified as FV-PTCs as well. Conversely, recent changes in FV-PTC diagnostic criteria are having a reverse effect on FV-PTC incidence rates. Because of the new terminology, some tumors are no longer considered cancer but rather precursor lesions; and other tumors probably have been reclassified as other variants of PTC, mostly conventional type.
The first two joinpoints affecting C-PTC, PTC (all variants), and thyroid cancer overall in 1977 and 1980 seem not to be related to guideline recommendations, as back then guidelines were uncommon. This study suggests that professional guideline recommendations have significantly contributed to shape thyroid cancer incidence trends for the last three decades. Although in some sense worrisome, this also informs about the impact that public health interventions may have in thyroid cancer incidence, as well as in other cancer types affected by overdiagnosis. The recent recommendation against thyroid cancer screening in asymptomatic patients issued by the U.S. Preventive Task Force in 2017 is expected to have an impact on thyroid cancer incidence as well (12). Although this recommendation might affect all tumor sizes, it will probably impact the incidence rates of small PTCs the most. However, data are not yet available to evaluate this.
It is possible that other professional guidelines contributed to the changes observed in thyroid cancer incidence rates. In this regard, the AACE has been publishing guidelines for the management of patients with thyroid nodules at time intervals similar to the ATA. The AACE also published their first guidelines in 1996, and then in 2006, 2010, and 2016 (33 –38). In their first guidelines, the AACE, recommended not to use ultrasound in the initial evaluation of thyroid nodules routinely, unless it was used to guide the fine needle aspiration biopsy. In subsequent iterations of the AACE guidelines, ultrasound evaluation has been recommended for patients with palpable or known thyroid nodules but not as a screening tool for patients with normal thyroid palpation on physical examination. In the 2016 AACE guidelines, a sonographic pattern-based classification was also presented, which also increases the size threshold for biopsy up to 2 cm for nodules with low- or intermediate-suspicion sonographic patterns, and to 1 cm for high-suspicion sonographic pattern.
This analysis has several strengths and important limitations. Prior studies have examined changes in incidence rates and have suggested potential explanations that may have contributed to the trends, including environmental factors and changes in practice. Our analysis highlights how changes in professional guidelines influenced incidence rates of PTC and FV-PTC in addition to overall thyroid cancer. We used the joinpoint regression analysis to determine if the joinpoints coincide with modifications to detection methods and changes in histology classifications. Similar to prior literature, our analysis is limited by the quality of the SEER 9 data set. Although the SEER 9 data set is the most robust data set available for this time frame, it lacks variables for lifestyle and environmental influences; it only represents 10% of the U.S. population and can contain possible misclassification of data. Although joinpoints are concordant with changes in clinical practice guidelines, we cannot retrospectively determine the adherence of health care professionals to those recommendations. Furthermore, it has been previously suggested that there are barriers that delay practice changes following the publication of clinical guidelines (39,40), and that adherence to the guideline recommendations improves with time and is dependent on the level of evidence, the receptiveness of the physicians, and other external factors such as patient preferences (7,39,41 –43). Few previous studies have focused on adherence to certain therapeutic recommendations of the ATA guidelines, which can be assessed through cancer registries, showing little impact and dependency on quality of care and quality of evidence (41,43 –45). It could be argued that clinical guidelines are unlikely to explain thyroid cancer incidence trends given the immediacy of the joinpoints following their publication. However, we think that due to the high prevalence of thyroid nodules and thyroid cancer in the general population, and the increasing use of thyroid ultrasound in the United States, which has grown 21% annually during the last decades, early adherence by even a low proportion of physicians could arguably lead to noticeable effects in thyroid cancer incidence trends (5,7,46). Nonetheless, it is possible that joinpoints are not fully attributable to guideline publications. The lack of delay between guideline publication and some of the observed changes in incidence trends makes it even possible that changes in guideline recommendations follow changes already taking place in clinical practice. However, this seems unlikely, because in that situation it would be expected that the joinpoint preceded the guideline publication, which was not observed.
Conclusion
This study suggests that thyroid cancer incidence trends have been shaped, in large part, but not completely, by changes in professional guideline recommendations for at least three decades. This finding highlights the potential role that professional guidelines may have in battling cancer epidemics when overdiagnosis is a driving force.
Footnotes
Author Disclosure Statement
No competing financial interests exist.
Funding Information
No funding was received for this project.
Supplementary Material
Supplementary Figure S1
Supplementary Figure S2
Supplementary Figure S3