
Abstract
Background:
Thyrotropin (TSH) and thyroid-stimulating antibodies (TSAbs) activate TSH receptor (TSHR) signaling by binding to its extracellular domain. TSHR signaling has been studied extensively in animal thyrocytes and in engineered cell lines, and differences in signaling have been observed in different cell systems. We, therefore, decided to characterize and compare TSHR signaling mediated by TSH and monoclonal TSAbs in human thyrocytes in primary culture.
Methods:
We used quantitative reverse transcription-polymerase chain reaction to measure mRNA levels of thyroid-specific genes thyroglobulin (TG), thyroperoxidase (TPO), iodothyronine deiodinase type 2 (DIO2), sodium-iodide symporter (NIS), and TSHR after stimulation by TSH or two monoclonal TSAbs, KSAb1 and M22. We also compared secreted TG protein after TSHR activation by TSH and TSAbs using an enzyme-linked immunosorbent assay. TSHR cell surface expression was determined using fluorescence activated cell sorting (FACS).
Results:
We found that TSH at low doses increases and at high doses (>1 mU/mL) decreases levels of gene expression for TSHR, TG, TPO, NIS, and DIO2. The biphasic effect of TSH on signaling was not caused by downregulation of cell surface TSHRs. This bell-shaped biphasic dose–response curve has been termed an inverted U-shaped dose–response curve (IUDRC). An IUDRC was also found for TSH-induced regulation of TG secretion. In contrast, KSAb1- and M22-induced regulation of TSHR, TG, TPO, NIS, and DIO2 gene expression, and secreted TG followed a monotonic dose–response curve that plateaus at high doses of activating antibody.
Conclusions:
Our data demonstrate that the physiological activation of TSHRs by TSH in primary cultures of human thyrocytes is characterized by a regulatory mechanism that may inhibit thyrocyte overstimulation. In contrast, TSAbs do not exhibit biphasic regulation. Although KSAb1 and M22 may not be representative of all TSAbs found in patients with Graves' disease, we suggest that persistent robust stimulation of TSHRs by TSAbs, unrelieved by a decrease at high TSAb levels, fosters chronic stimulation of thyrocytes in Graves' hyperthyroidism.
Introduction
The thyrotropin (TSH) receptor (TSHR) is a G-protein coupled receptor primarily expressed in thyroid follicular cells. Binding of TSH to the extracellular domain of TSHR activates signaling that regulates thyroid hormone synthesis and secretion. These effects are mediated by TSH regulation of various thyroid-specific genes including TSHR, thyroglobulin (TG), thyroperoxidase (TPO), iodothyronine deiodinase type 2 (DIO2), and sodium-iodide symporter (NIS) (1 –4). TSH mediates these effects by regulating the activities of thyroid-specific transcription factors: NKX2-1 (TTF-1), FOXE1 (TTF-2), and PAX 8 (5 –8). TSHR is the primary autoantigen in autoimmune Graves' disease (GD). Thyroid-stimulating antibodies (TSAbs), which constantly activate the TSHR on thyrocytes to induce sustained thyroid hormone production, account for the pathogenic effect causing hyperthyroidism in GD patients (9).
During the past four decades, TSHR signaling involved in the regulation of function of differentiated thyroid cells has been extensively studied (10), and reported observations have been different in different cell models (11). Various thyroid cell culture systems have been developed using primary cells (12 –14) or immortalized cells (15,16) of different species. Two of the most prominent cell systems in which thyroid gene expression was studied are FRTL-5 cells derived from normal rat thyroid and primary cultures of dog thyrocytes (17 –21). Both cell systems express differentiated genes of follicular thyroid cells, including TSHR, TG, TPO, NIS, and DIO2. However, even in these intensely studied cell systems, a systematic pharmacologic comparison of signaling induced by TSH and TSAbs has not been reported. Moreover, relatively few studies have been performed in human thyrocytes (22,23).
Here, we studied the regulation of thyroid-specific gene expression in human thyrocytes in primary cultures. We used TSH and two monoclonal TSAbs, KSAb1 (mouse) and M22 (human) to compare their regulatory effects on TSHR, TG, TPO, NIS, and DIO2 gene expression, and on TG secretion.
Methods
Primary culture of human thyrocytes
Primary cultures of human thyrocytes were established as described previously (24,25). Human thyrocytes were isolated from normal thyroid tissue samples from patients undergoing surgery for thyroid tumors at the National Institutes of Health Clinical Center. Specimens were obtained under NIDDK Institutional Review Board approved protocols after informed consent was obtained from patients. Normal thyroid tissues were kept in Hank's Balanced Salt Solution (Mediatech, Inc., Manassas, VA) on ice, and isolation of cells proceeded within four hours after surgery under sterile conditions.
Tissue samples were minced into small pieces in a 10 cm dish with a small volume of ice-cold HBSS and transferred to a 50 mL tube followed by centrifugation at 150 g for 5 minutes and careful removal of the supernatant. Small pieces of tissue were resuspended in sterile HBSS containing 3 mg/mL collagenase type IV (Gibco™/Thermo Fisher Scientific, Inc., Waltham, MA) and incubated for 30 minutes at 37°C while rotating for enzymatic digestion. After centrifugation at 150 g for 5 minutes, the supernatants were carefully aspirated, and cells were resuspended in 10 mL Dulbecco's modified Eagle's medium (DMEM) (Mediatech, Inc.) with 10% fetal bovine serum (FBS) (Thermo Fisher Scientific, Inc.). Cells were plated in 6 cm tissue culture dishes and incubated at 37°C in a humidified 5% CO2 incubator. After 24 hours, the mediums containing nonadherent cells and tissue remnants were removed, and primary thyrocytes formed a confluent monolayer within 5–7 days. Thyrocytes were propagated and maintained in DMEM containing 10% FBS, 100 IU/mL of penicillin, and 10 μg/mL of streptomycin (Life Technologies Corp., Carlsbad, CA) at 37°C in a humidified 5% CO2 incubator.
Quantitative reverse transcription polymerase chain reaction
Human thyrocytes were seeded into 12-well culture plates (1.5 × 10⁵ cells/well) in DMEM containing 10% FBS. The medium was changed to DMEM containing 0.1% bovine serum albumin (BSA) (MP Biomedicals, Solon, OH) 24 hours before the experiment. Cells were stimulated with 0–1800 nM (0–100 mU/mL) bovine TSH (Millipore Sigma, Burlington, MA) or KSAb1 (0–20 nM; generated as described in Ref. 26) or M22 (0–20 nM; Kronus, Star, ID) in 0.1% BSA-containing DMEM for 48 hours. Subsequently, the cells were lysed, and total RNA was purified using RNeasy Mini Kits (Qiagen, Hilden, Germany) followed by reverse transcription to synthesize first-strand cDNA using High Capacity cDNA Archive Kit (Applied Biosystems, Foster City, CA). Quantitative RT-PCR was performed in a 25 μL reaction volume using the prepared cDNA and iTaq™ Universal Probe Supermix (Bio-Rad Laboratories, Hercules, CA). Primers and probes (TSHR, TG, TPO, NIS, and DIO2) were Assay-on-Demand (Applied Biosystems). Quantitative RT-PCR results were normalized to GAPDH to correct for differences in RNA input and calculated using the 2−ΔΔCT method. Results were then normalized to each individual donor's maximal response to the TSHR ligand that varied by gene and donor.
Secreted TG assay
Cells were seeded into 24-well culture plates (8 × 10⁴ cells/well) in DMEM containing 10% FBS. The medium was replaced with 0.1% BSA-containing DMEM before stimulation with TSH, KSAb1, or M22 for desired time points (4 to 168 hours). For secreted TG measurement, conditioned media were collected and assayed using a Human Thyroglobulin ELISA kit (Sigma-Aldrich) according to the manufacturer's direction.
Measurement of TSHR cell surface expression
TSHR cell surface expression was determined using fluorescence activated cell sorting (FACS). Alexa Fluor was directly conjugated to the activating TSHR antibody KSAb1 (KSAb1-647) according to manufacturer's directions using the Alexa Fluor™ 647 antibody labeling kit (Thermo Fisher Scientific, Inc.). Thyrocytes were seeded in 12-well culture plates (1.5 × 10⁵ cells/well) in DMEM containing 10% FBS. The media were changed to DMEM containing 0.1% BSA 24 hours before the experiment. Cells were stimulated with 0, 1, and 100 mU/mL of TSH in 0.1% BSA-containing DMEM. Subsequently, cells were harvested at different time points (0, 4, 8, 24, and 48 hours) on ice with Accutase according to manufacturer's directions and fixed with 4% paraformaldehyde (Electron Microscopy Sciences, Hatfield, PA) for 10 minutes. Fixed cells were resuspended at a concentration of 7 × 10⁵ cells/mL in ice-cold PBS with 5% FBS. KSAb1-647 was added to cells to a final concentration of 5 μg/mL. Cells were incubated for 2 hours on ice with mixing every 15 minutes. After the incubation, cells were washed three times in PBS with 1% BSA. Subsequently, cells were resuspended in PBS with 1% BSA and subjected to flow cytometric analysis on a BD FACSAria II (BD Biosciences, Franklin Lakes, NJ). Viable cells were gated based on forward light scatter, and data were analyzed with BD FACS Diva software.
Statistical analysis
All experiments were performed with a minimum of thyrocytes from three different donors with biological duplicates. Statistical analysis was performed by GraphPad Prism version 8.1.0 for Windows (GraphPad Software, La Jolla, CA). All data are presented as mean ± standard error, and a Student's t-test was used to consider statistical significance with p < 0.05.
Results
TSHR, TG, TPO, NIS, and DIO2 gene expression was examined in a time course of TSH stimulation up to 48 hours in primary human thyrocytes (Fig. 1A–E). A low dose of TSH (1 mU/mL or 1.8 × 10⁻⁸ M) and a high dose of TSH (100 mU/mL or 1.8 × 10⁻⁶ M) increased the expression of thyroid-specific genes during the first 8 hours after administration with similar rates. The upregulation of gene expression induced by 1 mU/mL of TSH continued to increase after 8 hours and attained a constant level after 24 hours. In contrast, gene expression regulated by 100 mU/mL of TSH decreased after 8 hours, although this was most marked for TSHR and DIO2 (Fig. 1A, E), and was near baseline at 48 hours. This observation indicates a biphasic response to TSH and led us to examine a full dose response of TSH at 48 hours.
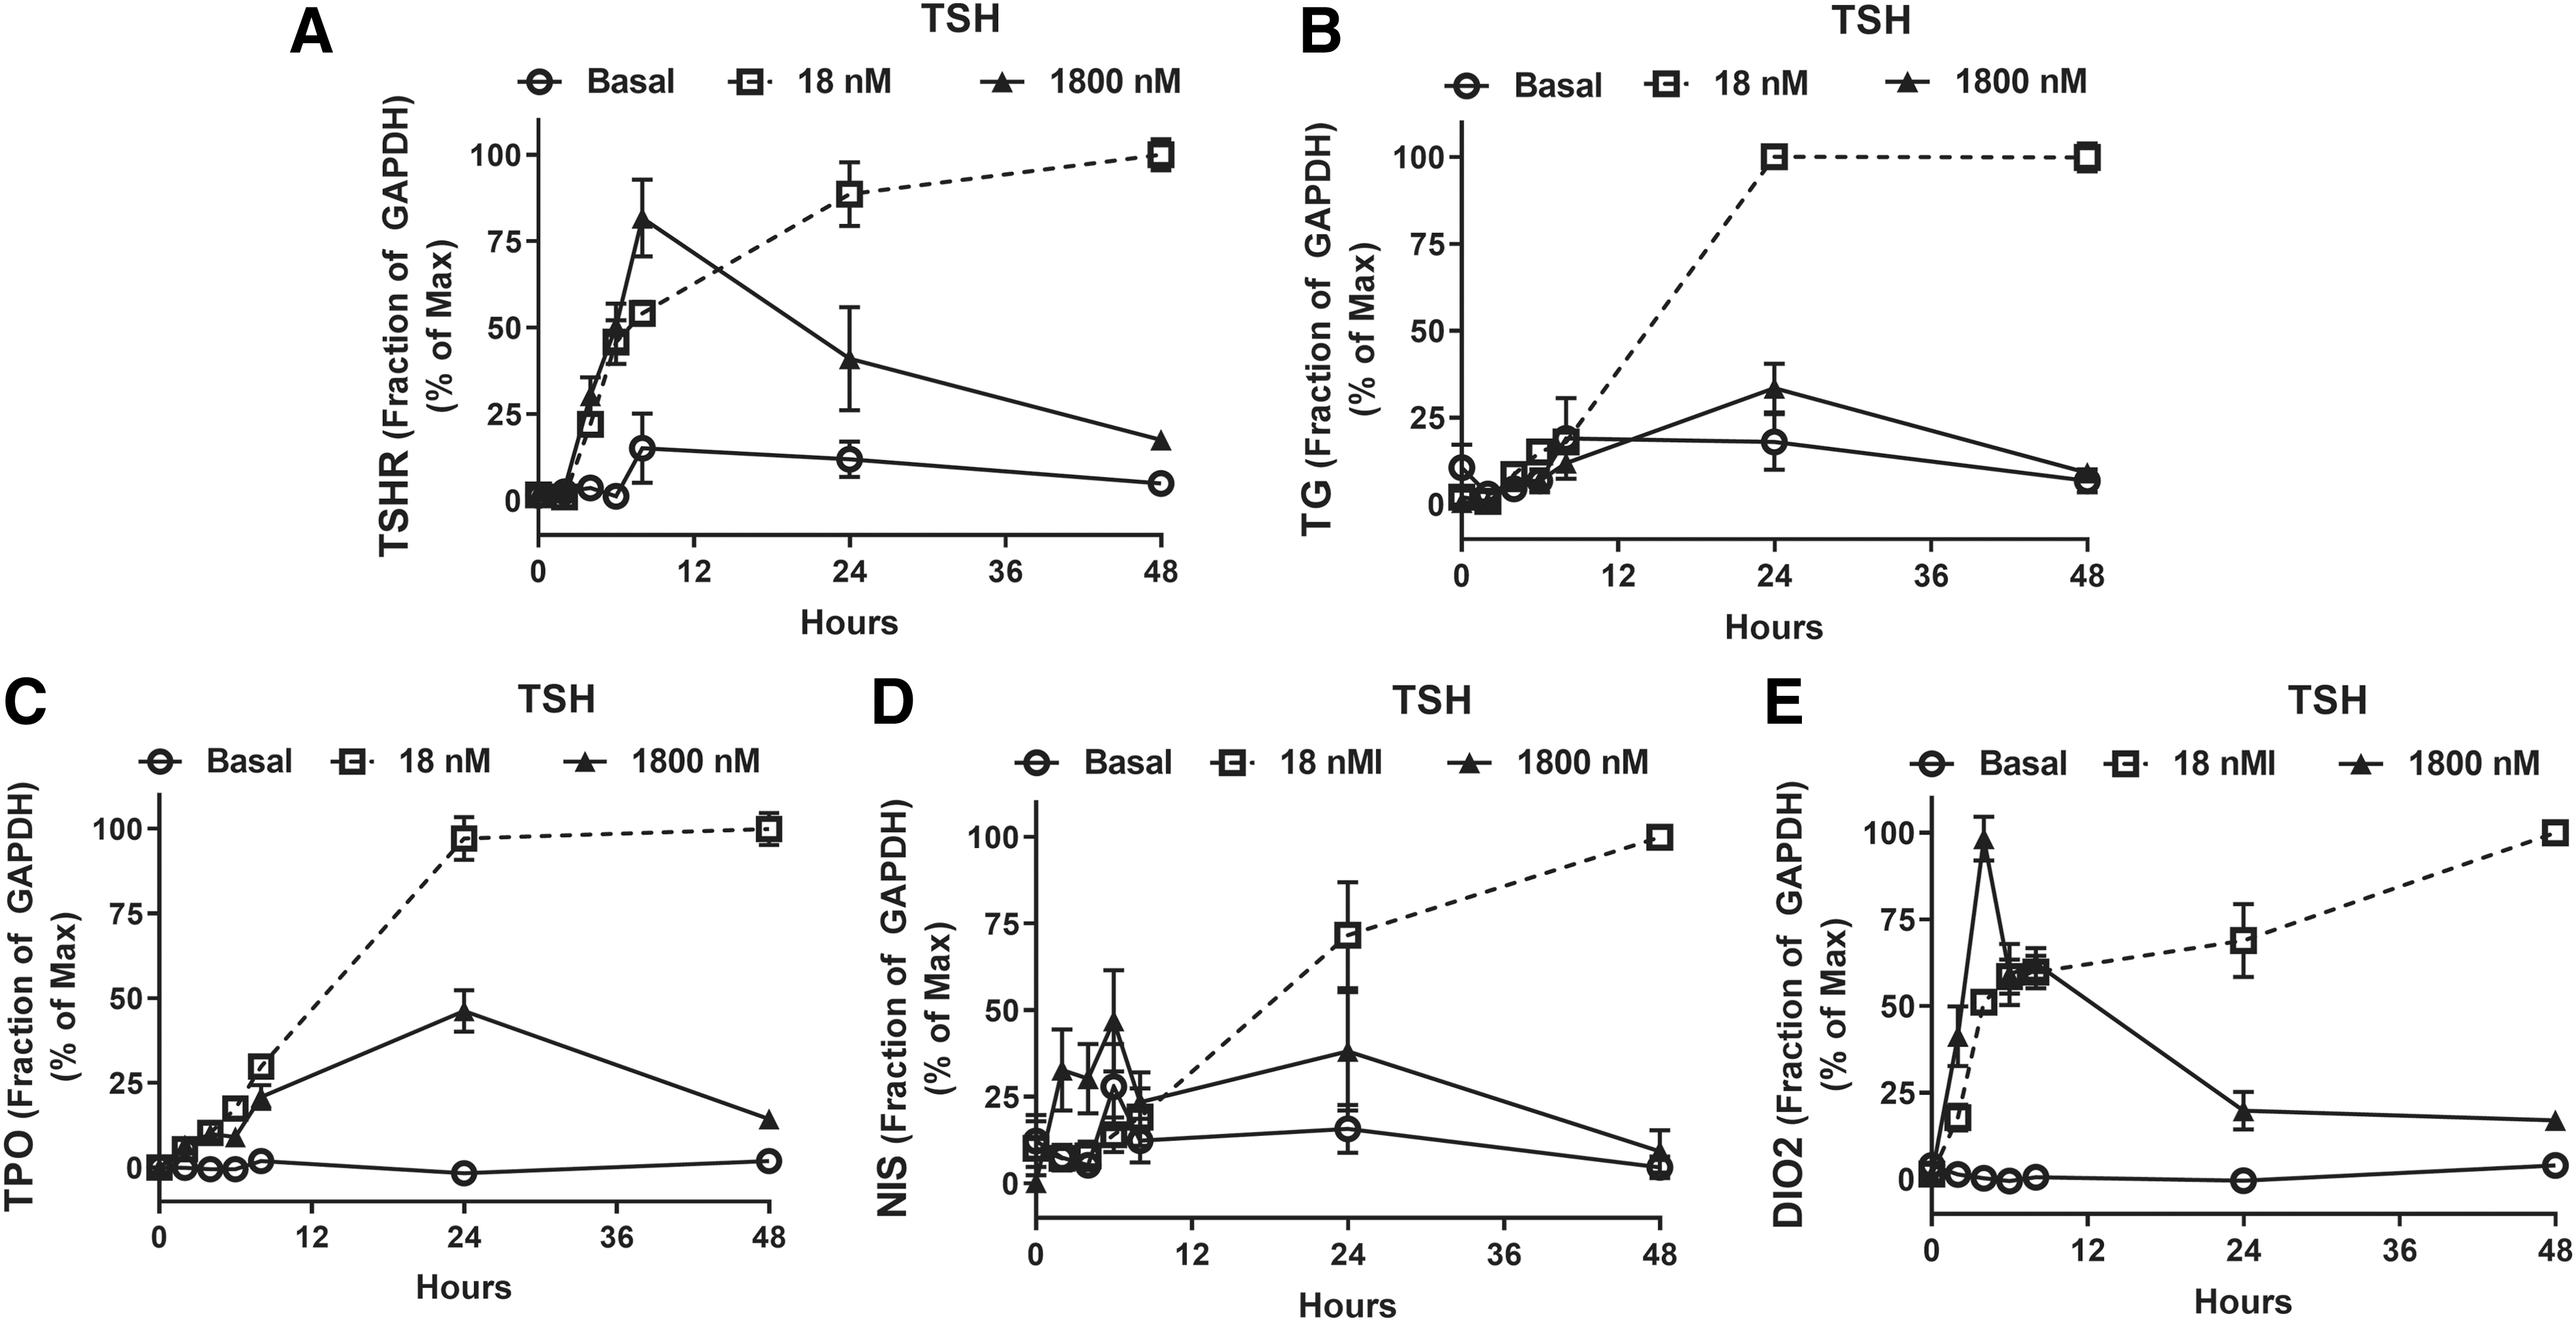
Time course of TSH-mediated regulation of thyroid-specific gene expression. Human thyrocytes were incubated without (Basal) or with 18 nM (1 mU/mL) or 1800 nM (100 mU/mL) TSH. Total RNA was isolated at the indicated times and cDNA was synthesized. mRNA levels for (
TSH stimulation at lower doses (up to 10−7 M or 3 mU/mL) exhibited dose-dependent upregulation of the TSHR, TG, TPO, NIS, and DIO2 genes (Fig. 2A), whereas gene expression was decreased at higher doses of TSH (>10−7 M). This type of biphasic bell-shaped dose–response curve is known as an inverted U-shaped dose–response curve (IUDRC). In a previous study, we had observed a TSH-mediated biphasic effect for NIS gene expression (27), and here, we confirm these findings in three additional donors (Fig. 2A). Similar IUDRCs were found with stimulation by recombinant human TSH (rhTSH) (Supplementary Fig. S1).
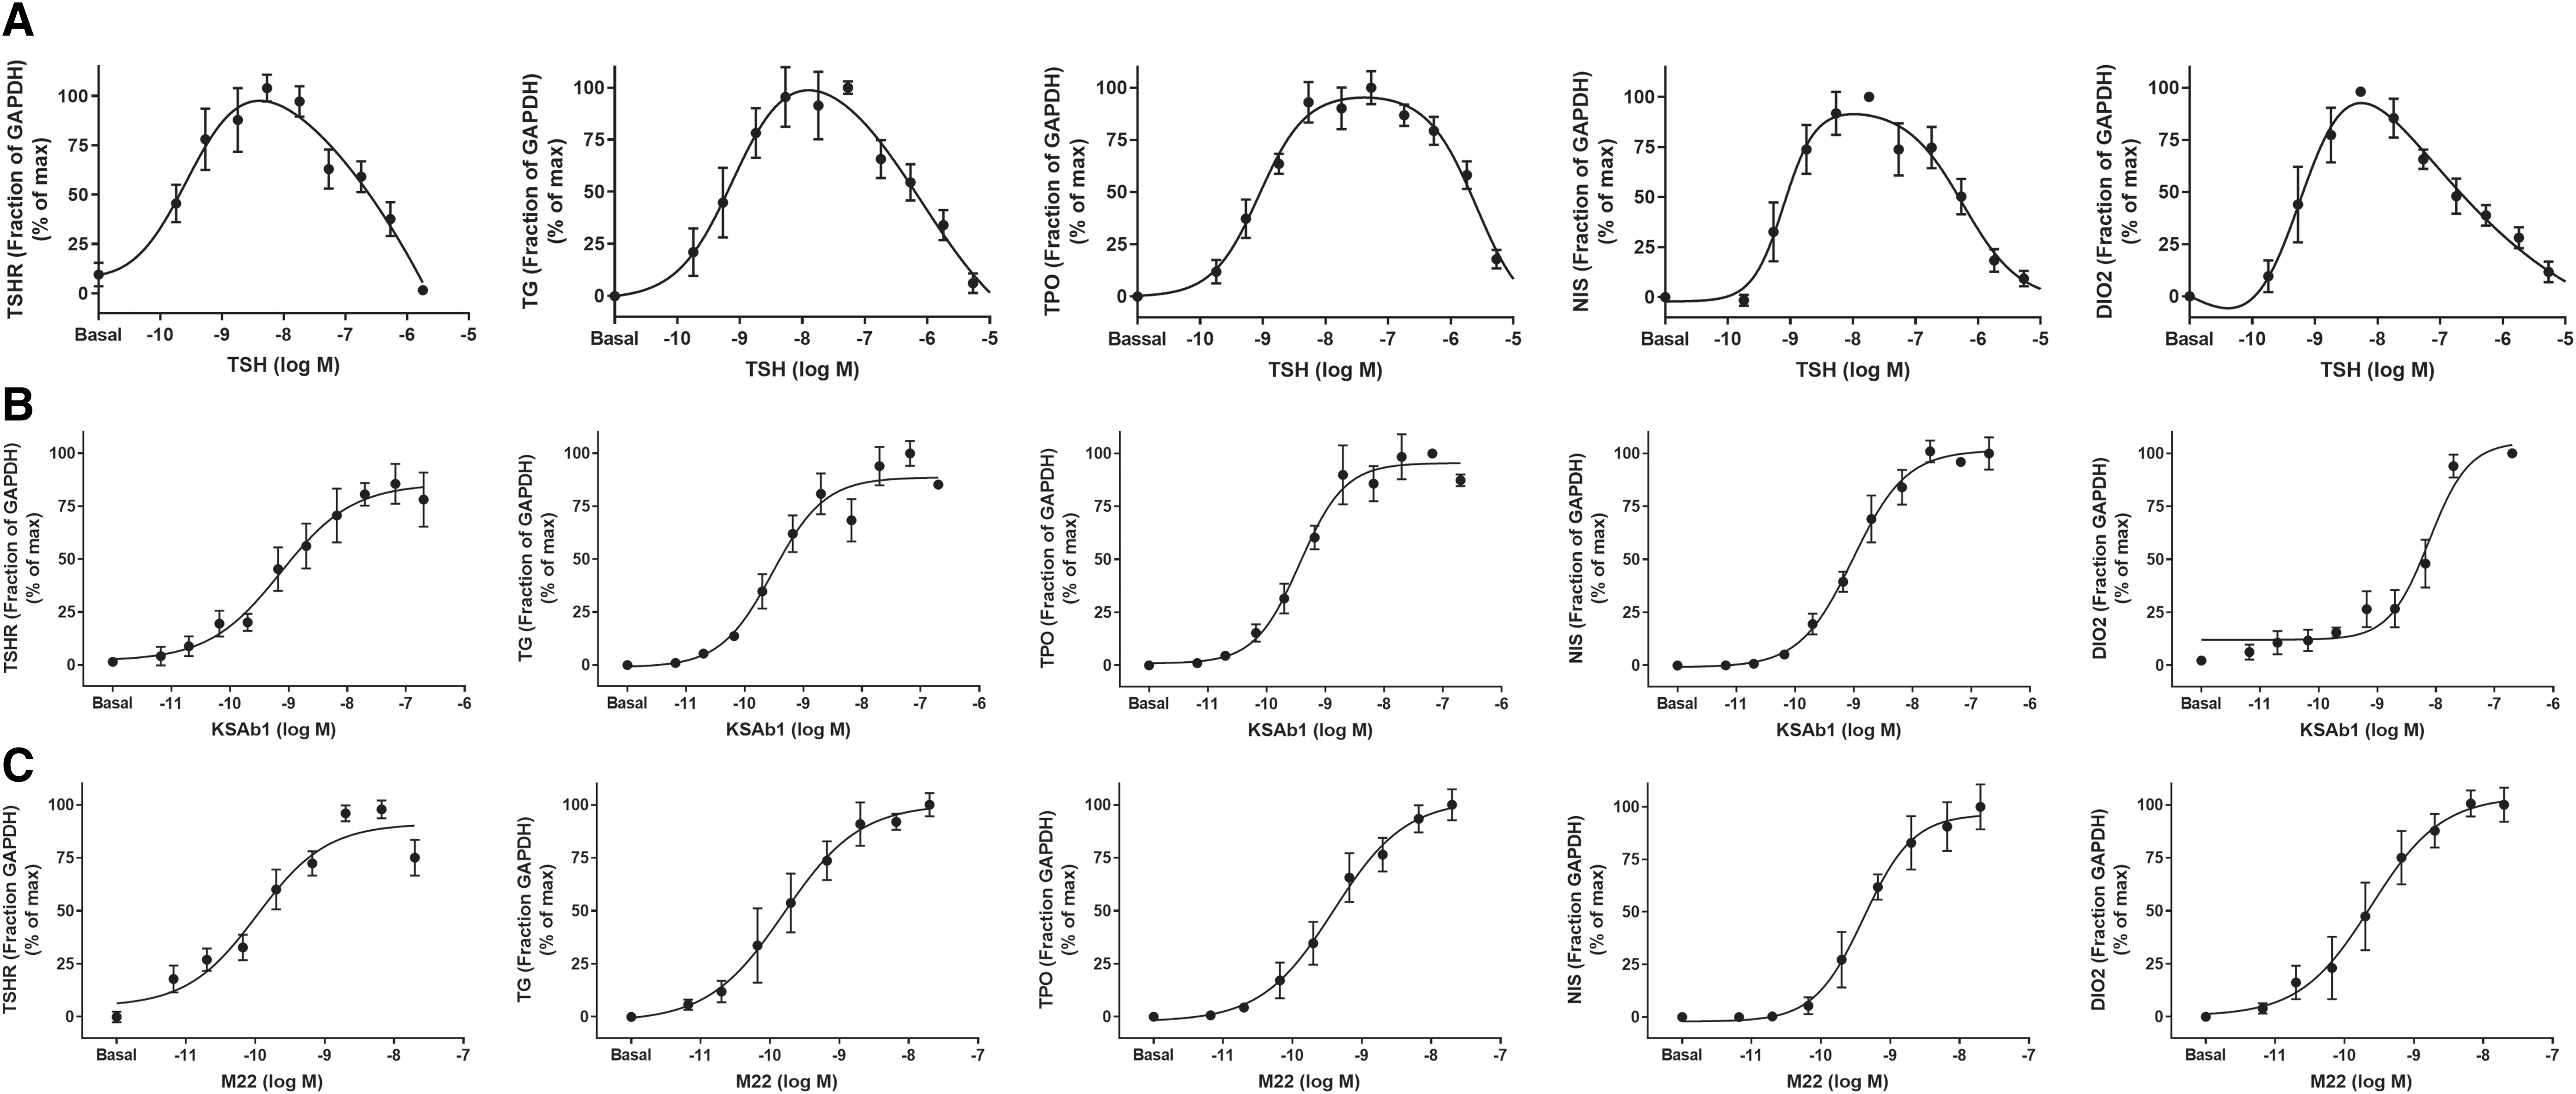
TSH exhibits biphasic regulation of thyroid-specific gene expression, whereas TSAbs do not. Human thyrocytes were incubated without (Basal) or with TSH or TSAbs, KSAb1, and M22 at the indicated doses for 48 hours. mRNA levels of TSHR, TG, TPO, NIS, and DIO2 were measured after stimulation with (
We then tested the effects of two TSAbs, KSAb1 and M22, on gene regulation in primary human thyrocytes. EC50 is higher for the antibodies than for TSH (pM vs. nM) and, therefore, the response for the antibodies can be seen at lower concentration. We measured mRNA levels after 48 hours of stimulation with increasing doses of KSAb1 or M22. In contrast to TSH, both KSAb1 (Fig. 2B) and M22 (Fig. 2C) showed monotonic sigmoidal dose–response curves with plateaus at high doses of antibody (beginning at 10−8 M or 2 μg/mL) for all genes measured.
To show that the IUDRC we observed at the gene level was translated to protein expression, we measured the effects of increasing TSH doses on TG secretion. Figure 3 shows dose-dependent stimulation of TG secretion mediated by TSH after five days. As observed for TG mRNA, secreted TG protein increased at lower doses and decreased at higher doses of TSH. Indeed, the TSH-induced IUDRC for secreted TG is like that for TG mRNA.
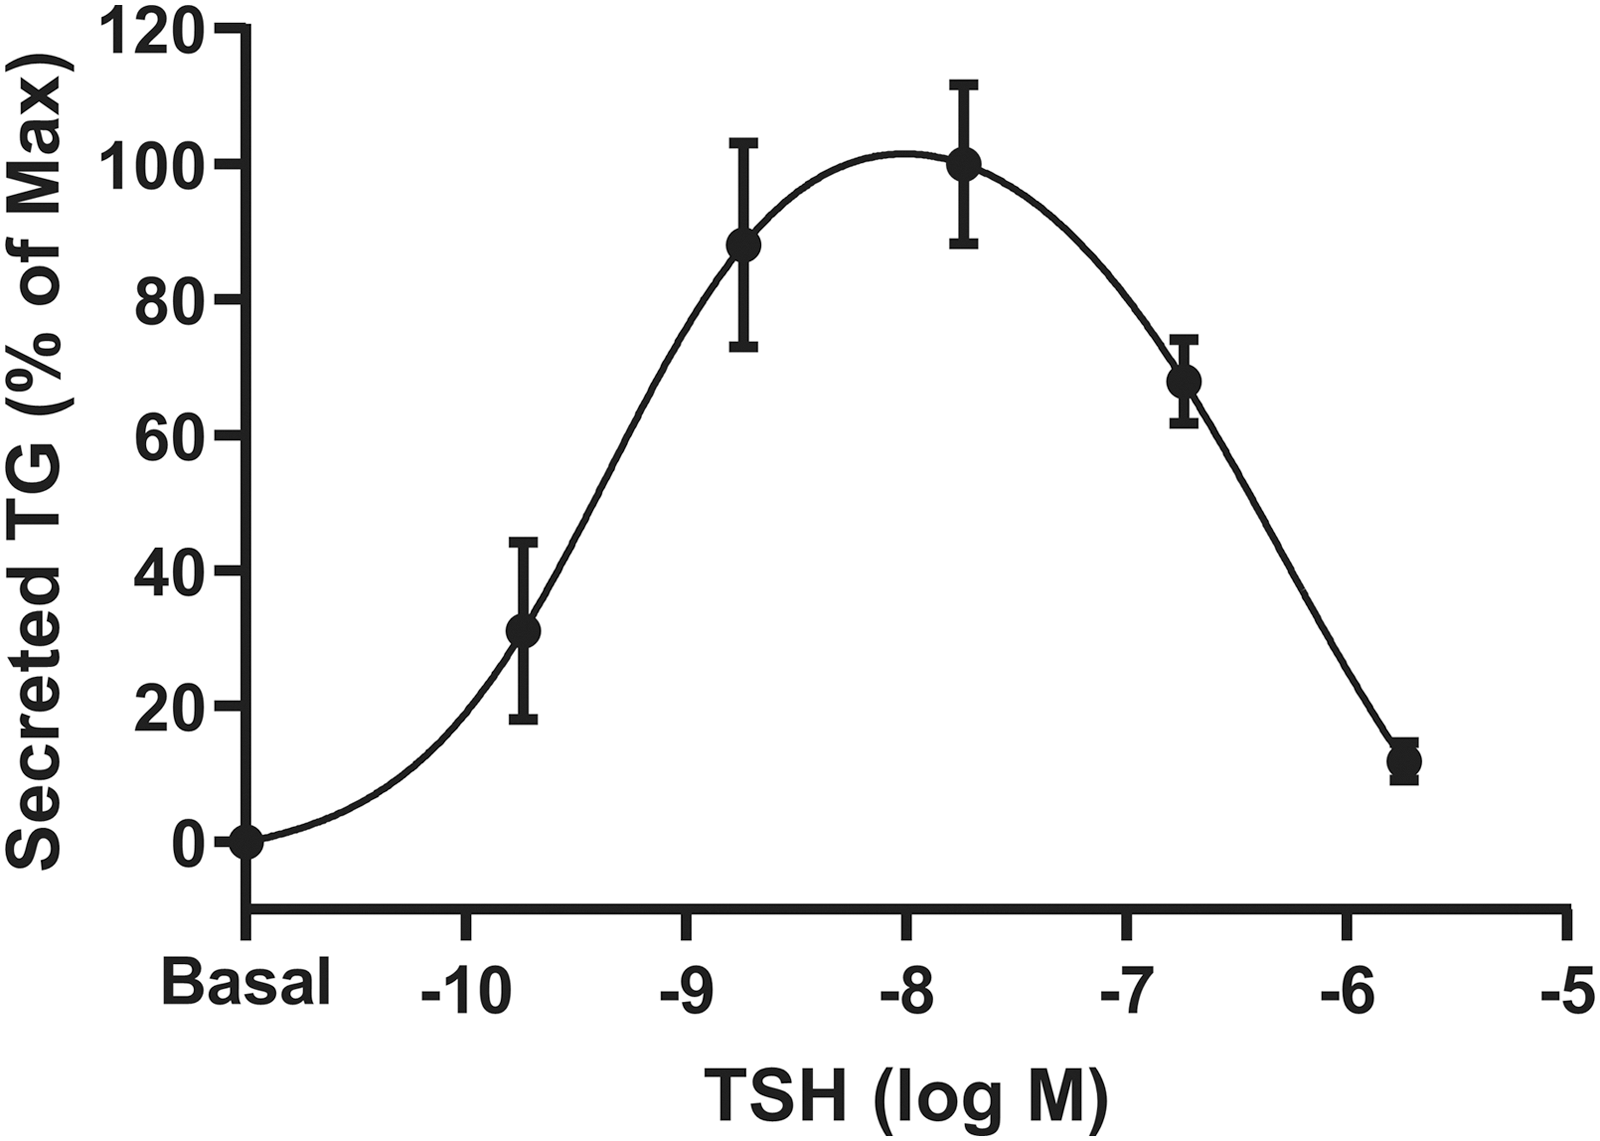
TSH exhibits biphasic regulation of TG secretion. Human thyrocytes were incubated without (Basal) or with the indicated doses of TSH for five days. The conditioned media were collected, and secreted TG was measured using a TG ELISA. Data are expressed as the mean ± SEM of three different donor cell strains. ELISA, enzyme-linked immunosorbent assay.
As it is conceivable that the decrease of gene expression and TG secretion at high doses of TSH might be mediated by downregulation of TSHR expression, we analyzed TSHR cell surface expression by FACS. Low (18 nM or 1 mU/mL) and high (1800 nM or 100 mU/mL) doses of TSH showed similar patterns of TSHR cell surface expression up to 48 hours; a decrease of TSHR cell surface expression by a high dose of TSH, which could have explained the IUDRC, was not observed (Supplementary Fig. S2).
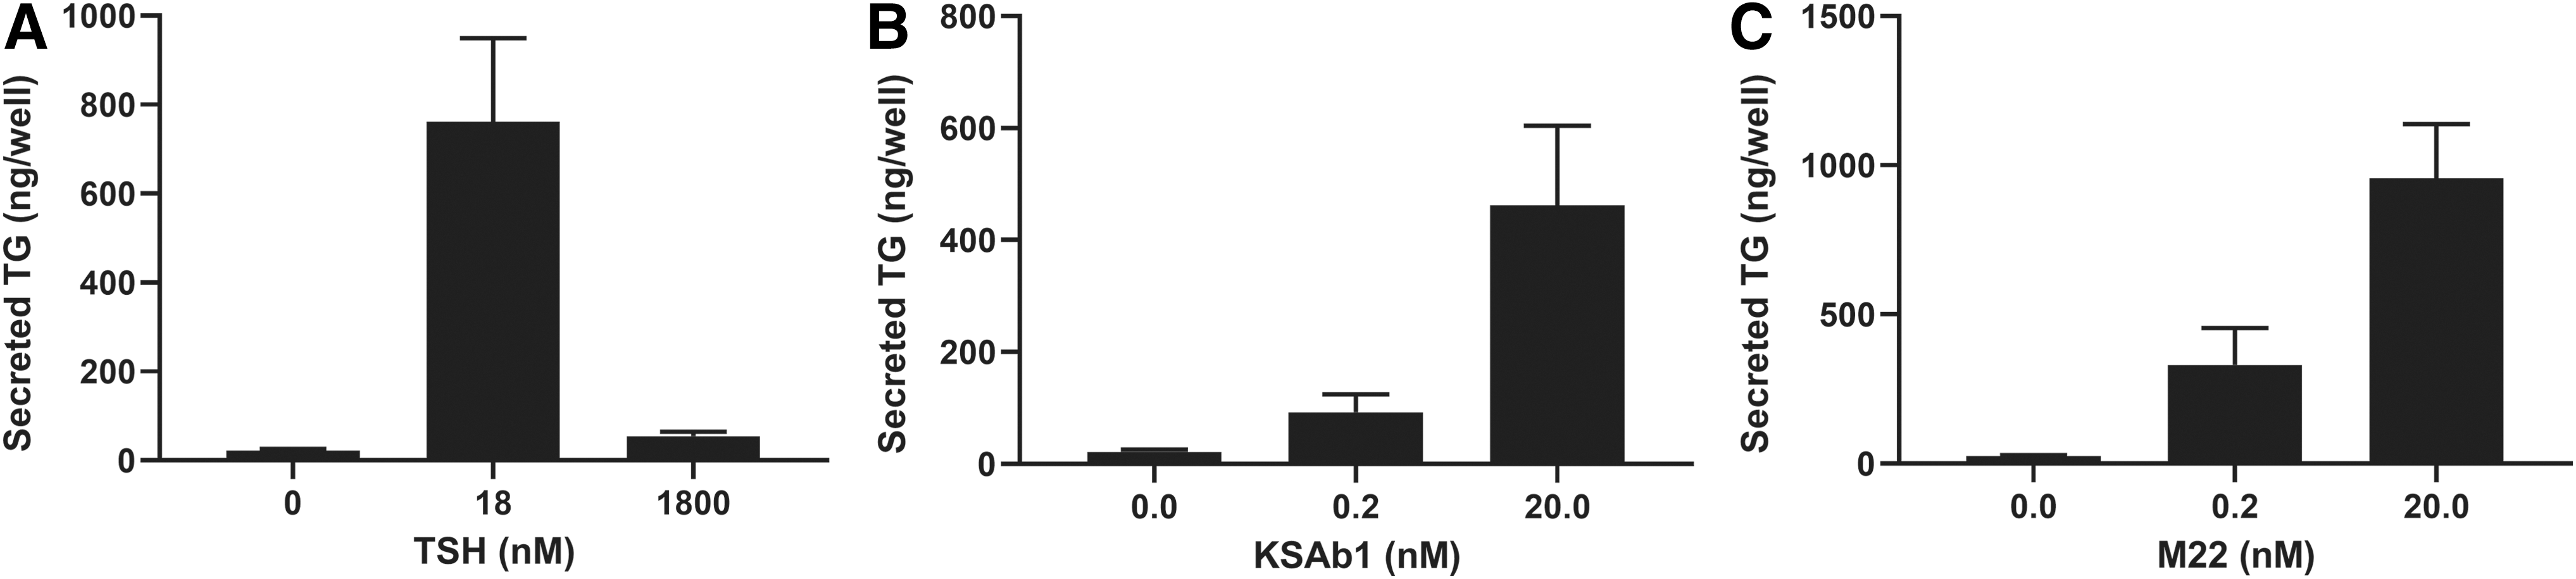
Next, we opted for a direct comparison of the effects of TSAbs and TSH on TG secretion. We determined the effects of TSH, KSAb1, and M22 on TG secretion over the course of seven days in a preliminary experiment (Supplementary Fig. S3). Low and high doses of TSH or TSAbs had little effect after one day of stimulation, but at day 3 and thereafter, TG secretion increased. In contrast to the biphasic regulation of secreted TG by TSH (Supplementary Fig. S3A), high doses of KSAb1 and M22 stimulated TG secretion more robustly than low doses (Supplementary Fig. S3B, C). We expanded on these results in a separate series of dose–response experiments, measuring TG secretion at five days after stimulation of thyrocytes with TSH or TSAbs. The secretion of TG induced by KSAb1 (Fig. 4B) and M22 (Fig. 4C) was dose-dependently increased in a monotonic response, in contrast to the biphasic regulation observed with TSH (Fig. 4A).
TSH
Discussion
In this study, we compared TSHR signaling regulated by TSH and TSAbs in primary cultures of human thyrocytes. Our major observation is a difference in the regulation of thyroid-specific gene expression by TSH and TSAbs. TSH exhibited dose-dependent upregulation of gene expression for TSHR, TG, TPO, NIS, and DIO2 at low doses but decreased gene expression at high doses, leading to a biphasic dose–response curve; that is, TSH stimulation exhibited an IUDRC. It is noted that thyrocytes in in vitro cell culture systems, including human thyrocytes in primary culture, are much less sensitive to TSH than in humans, and the potency of TSH in these systems is shifted to higher doses (25). In contrast to TSH, two TSAbs, M22 and KSAb1, showed typical monotonic dose–response curves with plateaus at high doses. These data demonstrate a novel and potentially important difference between TSH, the physiologic regulator of TSHR activation, and TSAbs, which are pathophysiologic stimulators. Activation by TSH is self-inhibiting and is thereby a mechanism that may prevent overstimulation of thyroid hormone production, whereas activation by TSAbs is not.
Previously, we reported the novel finding of biphasic regulation of NIS gene and protein expression induced by TSH (27). Despite observing an IUDRC for NIS in our previous study, we could not detect a biphasic dose response for TG, TPO, and DIO2 mRNA regulation. There could be several reasons for the discrepancy between these two studies. Perhaps the most likely is that TSH from bovine pituitary was purchased from two different sources and we found that the preparation used in this study exhibited a higher potency than that in the previous study and, therefore, was likely more highly purified. Other reasons for the lack of finding IUDRCs in previous studies may relate to the cell type studied, the passage number of cells, their density, or the media used for incubation. Importantly, we found an IUDRC for stimulation of thyroid gene expression stimulated by rhTSH.
Hormesis, a biphasic response to increasing doses of a substance or condition, has become a fundamental concept in biology, toxicology, medicine, public health, and all areas related to living systems. IUDRC is a typical example of hormesis and has been recognized as having implications for drug development (28,29). A large number of hormetic dose–response relationships in receptor and cell signaling have been reported (30). This suggests that an individual hormetic response may be tied to specific cellular or physiological pathways or processes.
The physiological relevance and the underlying mechanisms of the hormetic biphasic dose response induced by TSH, and the observed difference between TSH and TSAbs in this study, are unclear. Nevertheless, this phenomenon might be caused by multiple factors resulting from compensatory biological processes. It was conceivable that the decrease of thyroid-specific gene expression at higher TSH doses might have been mediated by downregulation of cell surface TSHR expression. Hence, we assessed cell surface TSHR expression using fluorescence-activated cell analysis after TSH stimulation at different time points. We found that TSHR expression was not decreased by TSH at low or high doses for 48 hours (Supplementary Fig. S1). It is possible that regulation of thyroid-specific transcription factors might be involved in the IUDRC of gene expression. NKX2-1 (TTF1) (31,32), FOXE1 (TTF2) (33), and PAX8 (34) are considered to be critical for the regulation of TG, TPO, TSHR, NIS, and DIO2 (5,35) through binding to their promoters and activation of gene transcription (21,36). In preliminary experiments, however, we found that knocking down NKX2-1, FOXE1, or PAX8 in human thyrocytes using siRNA did not eliminate the decrease in TG, TPO, TSHR, NIS, and DIO2 mRNA levels at high doses of TSH even though the increases in mRNA levels were significantly inhibited (data not shown).
Noteworthy, our observation that KSAb1 and M22 dose-dependently and monotonically increase thyroid-specific gene expression is consistent with the concept that TSAbs continuously induce thyroid hormone secretion, leading to Graves' hyperthyroidism (9). In addition, our data show that KSAb1 and M22 persistently increase TG secretion at maximum doses in primary human thyrocytes (Fig. 4B, C). It has been shown that TSAbs bind to the ectodomain of TSHR, as does TSH, but activate TSHR signaling differently than TSH, and also exhibit different signaling biases (37,38). Although KSAb1 and M22 may not represent all TSAbs found in GD patients, our data are consistent with the concept that persistent maximal stimulation of TSHR by even high levels of TSAbs may be a component of persistent thyroidal hyperstimulation in GD patients.
In summary, we show differences in TSH- and TSAb-induced signaling in primary cultures of human thyrocytes. TSH mediates a biphasic IUDRC, but KSAb1 and M22 induce a sigmoidal monotonic dose–response curve with plateaus at high doses for expression of thyroid-specific genes and TG secretion. Our observation suggests that the expression of thyroid-specific genes is more tightly regulated by TSH than by TSAbs, which persistently upregulates those genes under pathological conditions. These findings may explain, in part, persistent thyroidal hyperstimulation in patients with GD.
Footnotes
Acknowledgments
We thank Dr. Christine C. Krieger for her excellent support for measurement of TSHR expression by FACS. We thank Bernice Marcus-Samuels for her outstanding technical assistance. We are grateful for the contributions of Brianna Daley and Andrew Tobey of the Metabolic Disease Branch, National Institutes of Diabetes and Digestive and Kidney Diseases, National Institutes of Health, Bethesda, Maryland, who provided us with thyroid tissue.
Author Disclosure Statement
No competing financial interests exist.
Funding Information
This study was supported by the Intramural Research Program of the National Institutes of Health National Institute of Diabetes and Digestive and Kidney Diseases (Grant No. Z01 DK011006).
Supplementary Material
Supplementary Figure S1
Supplementary Figure S2
Supplementary Figure S3