
Abstract
Background:
Iodine is important in both thyroid function and human metabolism. Studies have explored the effect of iodine on metabolic disorders through thyroid function. This study aimed to investigate the relationship between iodine status and metabolic disorders, such as metabolic syndrome (MetS), hypertension, impaired glucose metabolism, central obesity, and dyslipidemia.
Methods:
A total of 51,795 subjects aged ≥18 years from the TIDE (Thyroid Disorders, Iodine Status and Diabetes, a national epidemiological cross-sectional study) program were included. The prevalence of metabolic disorders and its related diseases was calculated based on the level of urinary iodine concentrations (UICs) using the chi-square method. To further explore whether the prevalence was associated with UIC, quadratic and UIC-stratified logistic regression models were used.
Results:
The prevalence of metabolic disorders as a function of UIC was found to be U-shaped with a lower prevalence of 76.0% at an UIC of 300–499 μg/L. Participants with an UIC of 300–499 μg/L showed an association with metabolic disorders (odds ratio [OR] = 0.857, 95% confidence interval [CI 0.796–0.922]) and hypertension (OR = 0.873 [CI 0.814–0.936]). An UIC of 300–799 μg/L was found to be associated with the occurrence of MetS and impaired glucose tolerance. An UIC of 500–799 μg/L was associated with the occurrence of prediabetes (OR = 0.883 [CI 0.797–0.978]). An UIC of ≥300 μg/L was associated with the occurrence of hypertriglyceridemia, hypercholesterolemia, and high levels of low-density lipoprotein cholesterol. Furthermore, an UIC of <100 μg/L showed an association with hypertension (OR = 1.097 [CI 1.035–1.162]) and hypercholesterolemia (OR = 1.178 [CI 1.117–1.242]).
Conclusions:
The association between UICs in adults and metabolic disorders and its related diseases is U-shaped. The association between UIC and metabolic disorders disappears in cases of iodine deficiency (<100 μg/L) or excess (≥500 μg/L).
Introduction
Metabolic disorders are among the most common conditions in humans. With developing social economies and changing lifestyles, the prevalence of certain diseases, such as metabolic syndrome (MetS), diabetes, hypertension, central obesity, and dyslipidemia, has rapidly increased globally (1 –3). In national epidemiological surveys of Chinese adults, the prevalence of MetS was estimated to be 33.9% in 2010 (2), that of prediabetes and diabetes was 35.7% and 10.9% in 2013 (4), that of hypertension was 37.2% in 2017 (5), and that of dyslipidemia was 34.0% in 2010 (6). There is increasing attention focused on metabolic disorders because it may lead to a higher all-cause mortality (7). The prevalence of metabolic disorders varies with sex, race/ethnicity, and heredity, although lifestyle is important in the disease process of metabolism-related diseases.
With the introduction of the universal salt iodization policy in several countries, such as India and China, there is concern that any changes in iodine intake may have an effect on human metabolism. Research has shown that both iodine deficiency and iodine excess are associated with adult blood glucose, blood pressure, and blood lipids. Low urinary iodine is associated with dyslipidemia and increased risk of gestational hypertension (8,9). The concentration of urine iodine was significantly lower in subjects with type 2 diabetes mellitus (T2DM) than in healthy controls (10). Excessive iodine intake is associated with elevated levels of blood sugar and blood pressure, may have an influence on blood lipids, and may increase the risk of hypertension and diabetes (11).
Iodine plays an indispensable role in the synthesis of thyroid hormones, and it is therefore an essential trace element. Both iodine deficiency and iodine excess may lead to dysfunction of the thyroid and overall well-being. Several studies have shown that iodide can be directly used as an electron donor to quench free radicals such as hydroxide. Alternatively, it may act as a free radical that facilitates the iodination of tyrosine, histidine, and some polyunsaturated fatty acid double bonds in cell membranes in various tissues other than the thyroid, reducing their reaction with oxygen radicals (12).
Recently, a number of small population-based studies were conducted exploring the relationship between iodine status and metabolic disorders, such as diabetes and dyslipidemia. One of the studies revealed that the urinary iodine concentration (UIC) levels in T2DM patients were significantly lower than that in healthy controls, and urinary iodine has been shown to be negatively correlated with glucose and insulin (10). Lee et al. (8) reported that low UICs were associated with an increased risk of dyslipidemia. The degree of dyslipidemia in women with moderate or severe iodine deficiency was shown to improve after iodine supplementation (13). Iodine status was also associated with hypertension in pregnant women (9). Notably, a French cohort study of women showed that high iodine intake was a risk factor in development of T2DM (14).
At present, the relationship between iodine status and metabolic disorders has not been systematically reported.
Thyroid Disorders, Iodine Status and Diabetes, a national epidemiological cross-sectional study (TIDE), was conducted from 2015 to 2017 covering all 31 provinces of mainland China. In the present study, we aimed to investigate the association between iodine status and metabolic disorders using the TIDE data.
Methods
Subjects
TIDE is a multistage, stratified sampling method used to select one representative city per province according to the population size and economic level from all 31 provinces within China. Two residential districts were randomly selected in a municipal district according to inclusion criteria of age and sex; qualified respondents were randomly selected from the residential districts. The sampling method in rural areas was the same as in cities. The ratio of age, sex, urban, or rural population in each region was calculated based on data from the 2010 China census. The inclusion criteria were as follows: age ≥18 years; having resided locally for at least 5 years; no iodine-containing drugs or contrast agents within 3 months of participation; and nonpregnant women. A total of 80,937 people participated in the project. Each participant provided written informed consent before data collection. The ethics committee approved the study protocol. To investigate the relationship between iodine status and the prevalence of metabolic disorders, the following exclusion criteria were applied: missing demographic or metabolism information; presence of thyroid dysfunction, positive thyroid peroxidase antibodies (TPOAb) or thyroglobulin antibodies (TgAb); and the presence or history of severe chronic diseases, such as cancer, cardiovascular, or cerebrovascular diseases. Finally, 51,795 adults were included for analysis. The flowchart of patient inclusion is shown in Figure 1.
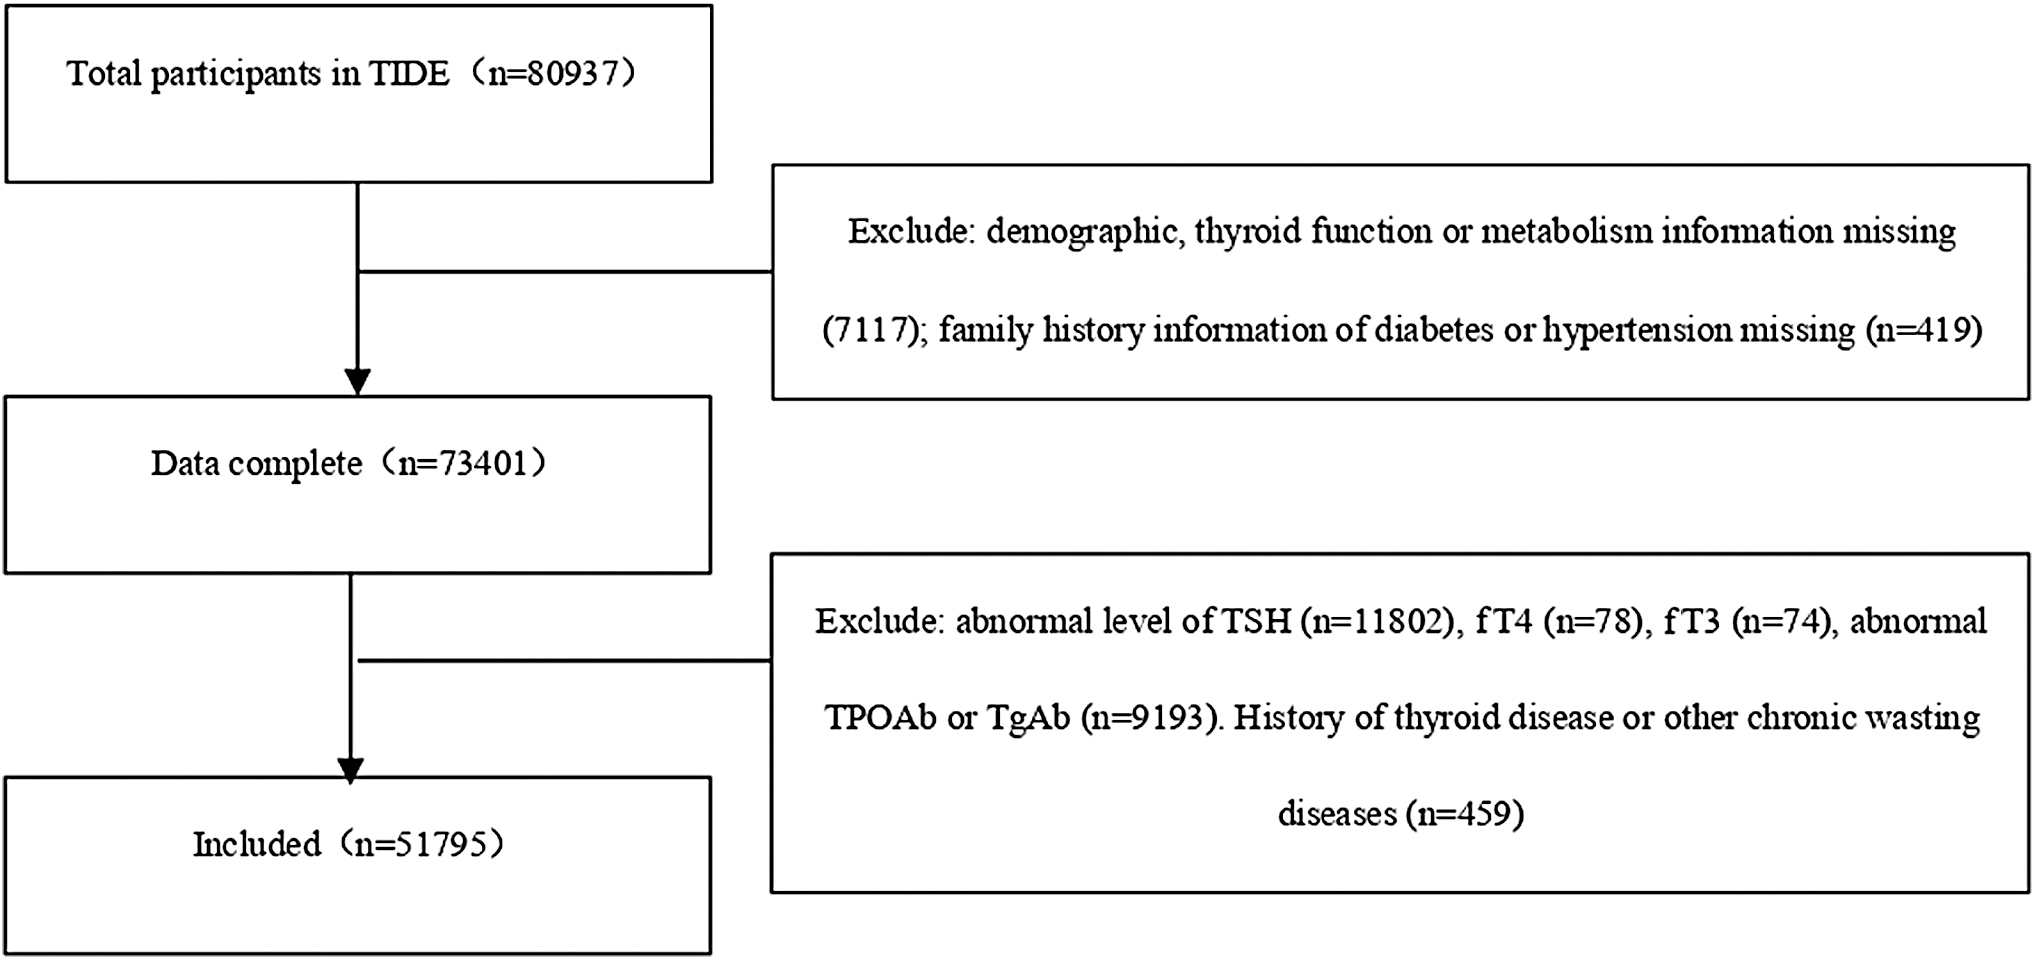
Screening flowchart. fT4, free thyroxine; fT3, free triiodothyronine; TIDE, Thyroid Disorders, Iodine Status and Diabetes, a national epidemiological cross-sectional study; TgAb, thyroglobulin antibody; TPOAb, thyroid peroxidase antibody; TSH, thyrotropin.
Questionnaire information included demographic characteristics such as age, sex, education, province, and location (urban or rural). Other collected variables included profession, income, and ethnicity. Health-related information included smoking, iodized-salt intake, family history of diabetes, thyroid disease, cardiovascular disease, and cancer.
Height and weight were measured, and body mass index (BMI) (kg/m2) was calculated. Waist circumference was also measured. Blood pressure was measured with a corrected automated electronic device. Duplicate readings were averaged for the record.
Laboratory tests
Venous blood samples were collected from each subject after fasting for eight hours to measure plasma glucose (PG), lipid profile, glycosylated hemoglobin (HbA1c), and thyroid function. The oral glucose tolerance test (OGTT) was performed on all subjects except those diagnosed with diabetes. The collected serum and urine samples were stored at −20°C. After investigation and specimen collection, all samples were transported via a cold chain system to the central laboratory for the unified testing of thyroid parameters and UIC.
We used the hexokinase enzymatic method to measure PG and OGTT-2h PG (Au400 automatic analyzer; Olympus company, Japan; reagent purchased from Daiichi Pharmaceutical Co. Ltd). Serum triglyceride (TG), total cholesterol (TC), low-density lipoprotein cholesterol (LDL-C), and high-density lipoprotein cholesterol (HDL-C) levels were assessed using reagents from Mindray Company (BS-180). Bio-Rad reagents were used for HbA1c measurement. Thyrotropin (TSH), TPOAb, and TgAb levels were measured via electrochemiluminescence immunoassays with a Cobas 601 analyzer (Roche Diagnostic, Switzerland). Free thyroxine (fT4) and free triiodothyronine (fT3) were measured when the TSH level was out of the reference (0.27–4.20 mIU/L). The UIC was measured by inductively coupled plasma mass spectrometry (Agilent 7700x; Agilent Technologies).
Quality control
For data validity, well-defined, comprehensive quality control was implemented. Only investigating staff who had passed their performance assessment after training could undertake data collection. Members of the steering committee supervised the questionnaire, identified errors, and corrected these timely. Physical examination was completed by attending physicians, and the instruments were checked and calibrated in time. Data were entered by two persons and verified.
Clinical diagnosis
The normal reference ranges for thyroid function, including those of TSH, fT4, fT3, TPOAb, and TgAb, were 0.27–4.2 mIU/L, 12.0–22.0 pmol/L, 3.1–6.8 pmol/L, <34.0 IU/mL, and <115.0 IU/mL, respectively, as reported by the test kit manufacturers. The diagnostic criteria of metabolic disorders are detailed in Supplementary Table S1.
Statistical analyses
All statistical analyses were performed using SPSS, version 23.0 (IBM). We performed statistical analysis of BMI, age, systolic blood pressure (SBP), diastolic blood pressure (DBP), waist circumference, fasting plasma glucose, OGTT-2hPG, HbA1c, TG, TC, LDL-C, HDL-C, TSH, TPOAb, TgAb, and UIC by stratifying into the quartile method and compared the differences in the medians using the Mann–Whitney U test. The chi-square test was used to compare the prevalence of metabolic disorders and its related diseases. The prevalence curves were analyzed using the quadratic test and adjusted for TSH. To further consider confounding factors, multivariable logistic regression models adjusted for age and sex in Model 1 and age, sex, education, provinces, location, profession, income, ethnicity, iodized-salt intake, family history, smoking status, BMI, TSH, TPOAb, and TgAb in Model 2, which were used to analyze the odds ratio (OR) and 95% confidence intervals [CIs] and evaluate the risk factors of metabolic disorders and its related diseases based on the UICs. p-Values <0.05 indicated statistical significance.
Results
Population characteristics
The median UIC of the whole population was 182.30 (120.86–266.60) μg/L. Table 1 summarizes the general characteristics of metabolic disorders and healthy control subjects included in this study. The questionnaire revealed that subjects with metabolic disorders were less educated, more likely to live in rural areas, more likely to have a lower income, less likely to report iodized-salt intake, more likely to smoke, and more likely to have a family history of diabetes. The Han ethnicity had a higher prevalence of metabolic disorders (all p < 0.05). Compared with healthy controls, the median BMI, age, SBP, DBP, waist circumference, FPG, OGTT-2hPG, HbA1c, TG, TC, LDL-C, TPOAb, and TgAb values were all significantly greater in participants with metabolic disorders, whereas the HDL-C, TSH, and UIC values were lower (all p < 0.05). There was no significant difference in the provinces between the two groups (p > 0.05), which means no difference existed between north and south China. There is a statistically difference in TSH levels between the healthy controls and subjects with metabolic disorders (2.12 mIU/L vs. 2.09 mIU/L, p < 0.05). After grouping the population according to UIC levels, the TSH levels increased within the normal range (2.04–2.34 mIU/L) as UIC levels increased (Table 2).
General Characteristics
Divided by the line of Qinling Mountains-Yellow River.
BMI, body mass index; DBP, diastolic blood pressure; FPG, fasting plasma glucose; HbA1c, glycosylated hemoglobin; HDL-C, high-density lipoprotein cholesterol; LDL-C, low-density lipoprotein cholesterol; OGTT, oral glucose tolerance test; PG, plasma glucose; SBP, systolic blood pressure; TC, total cholesterol; TG, triglyceride; TgAb, thyroglobulin antibody; TPOAb, thyroid peroxidase antibody; TSH, thyrotropin; UIC, urinary iodine concentration.
Prevalence of Metabolic Disorders and Related Diseases According to the Urinary Iodine Concentration
p for trend adjusted for TSH.
Adjusted p < 0.05 indicates statistical significance, compared with UIC of 100–299 μg/L.
LDL-C, low-density lipoprotein cholesterol; HDL-C, high-density lipoprotein cholesterol; IFG, impaired fasting glucose; IGT, impaired glucose tolerance; MetS, metabolic syndrome; TSH, thyrotropin; UIC, urinary iodine concentration.
Metabolic disorders
The total population was assessed based on the different UICs and sex. The prevalence of metabolic disorders and its related diseases is detailed in Table 2. In the overall population, the prevalence of metabolic disorders was 81.2%, wherein that in males (85.0%) was higher than that in females (76.7%). Figure 2A illustrates the prevalence of metabolic disorders based on the different UICs: 83.1%, 82.1%, 76.0%, 76.6%, and 78.4% in those with UICs of <100, 100–299, 300–499, 500–799, and ≥800 μg/L, respectively. The association of prevalence with UIC exhibited a U-shaped curve, with a nadir at 300–499 μg/L (p < 0.05). As the UICs increased to ≥500 μg/L, the prevalence of metabolic disorders significantly increased. Both men and women exhibited the same trend, and the prevalence was significantly higher at an UIC of <100 μg/L than at an UIC of 100–299 μg/L. After adjusting for confounding factors in Model 2 (Table 3), the OR [CI] of metabolic disorders at an UIC of 300–499 μg/L was 0.857 [0.796–0.922] (p < 0.05), which suggests that it might be an independent protective factor for metabolic disorders. There was no significant association between metabolic disorders and UICs of ≥500 and <100 μg/L (p > 0.05).
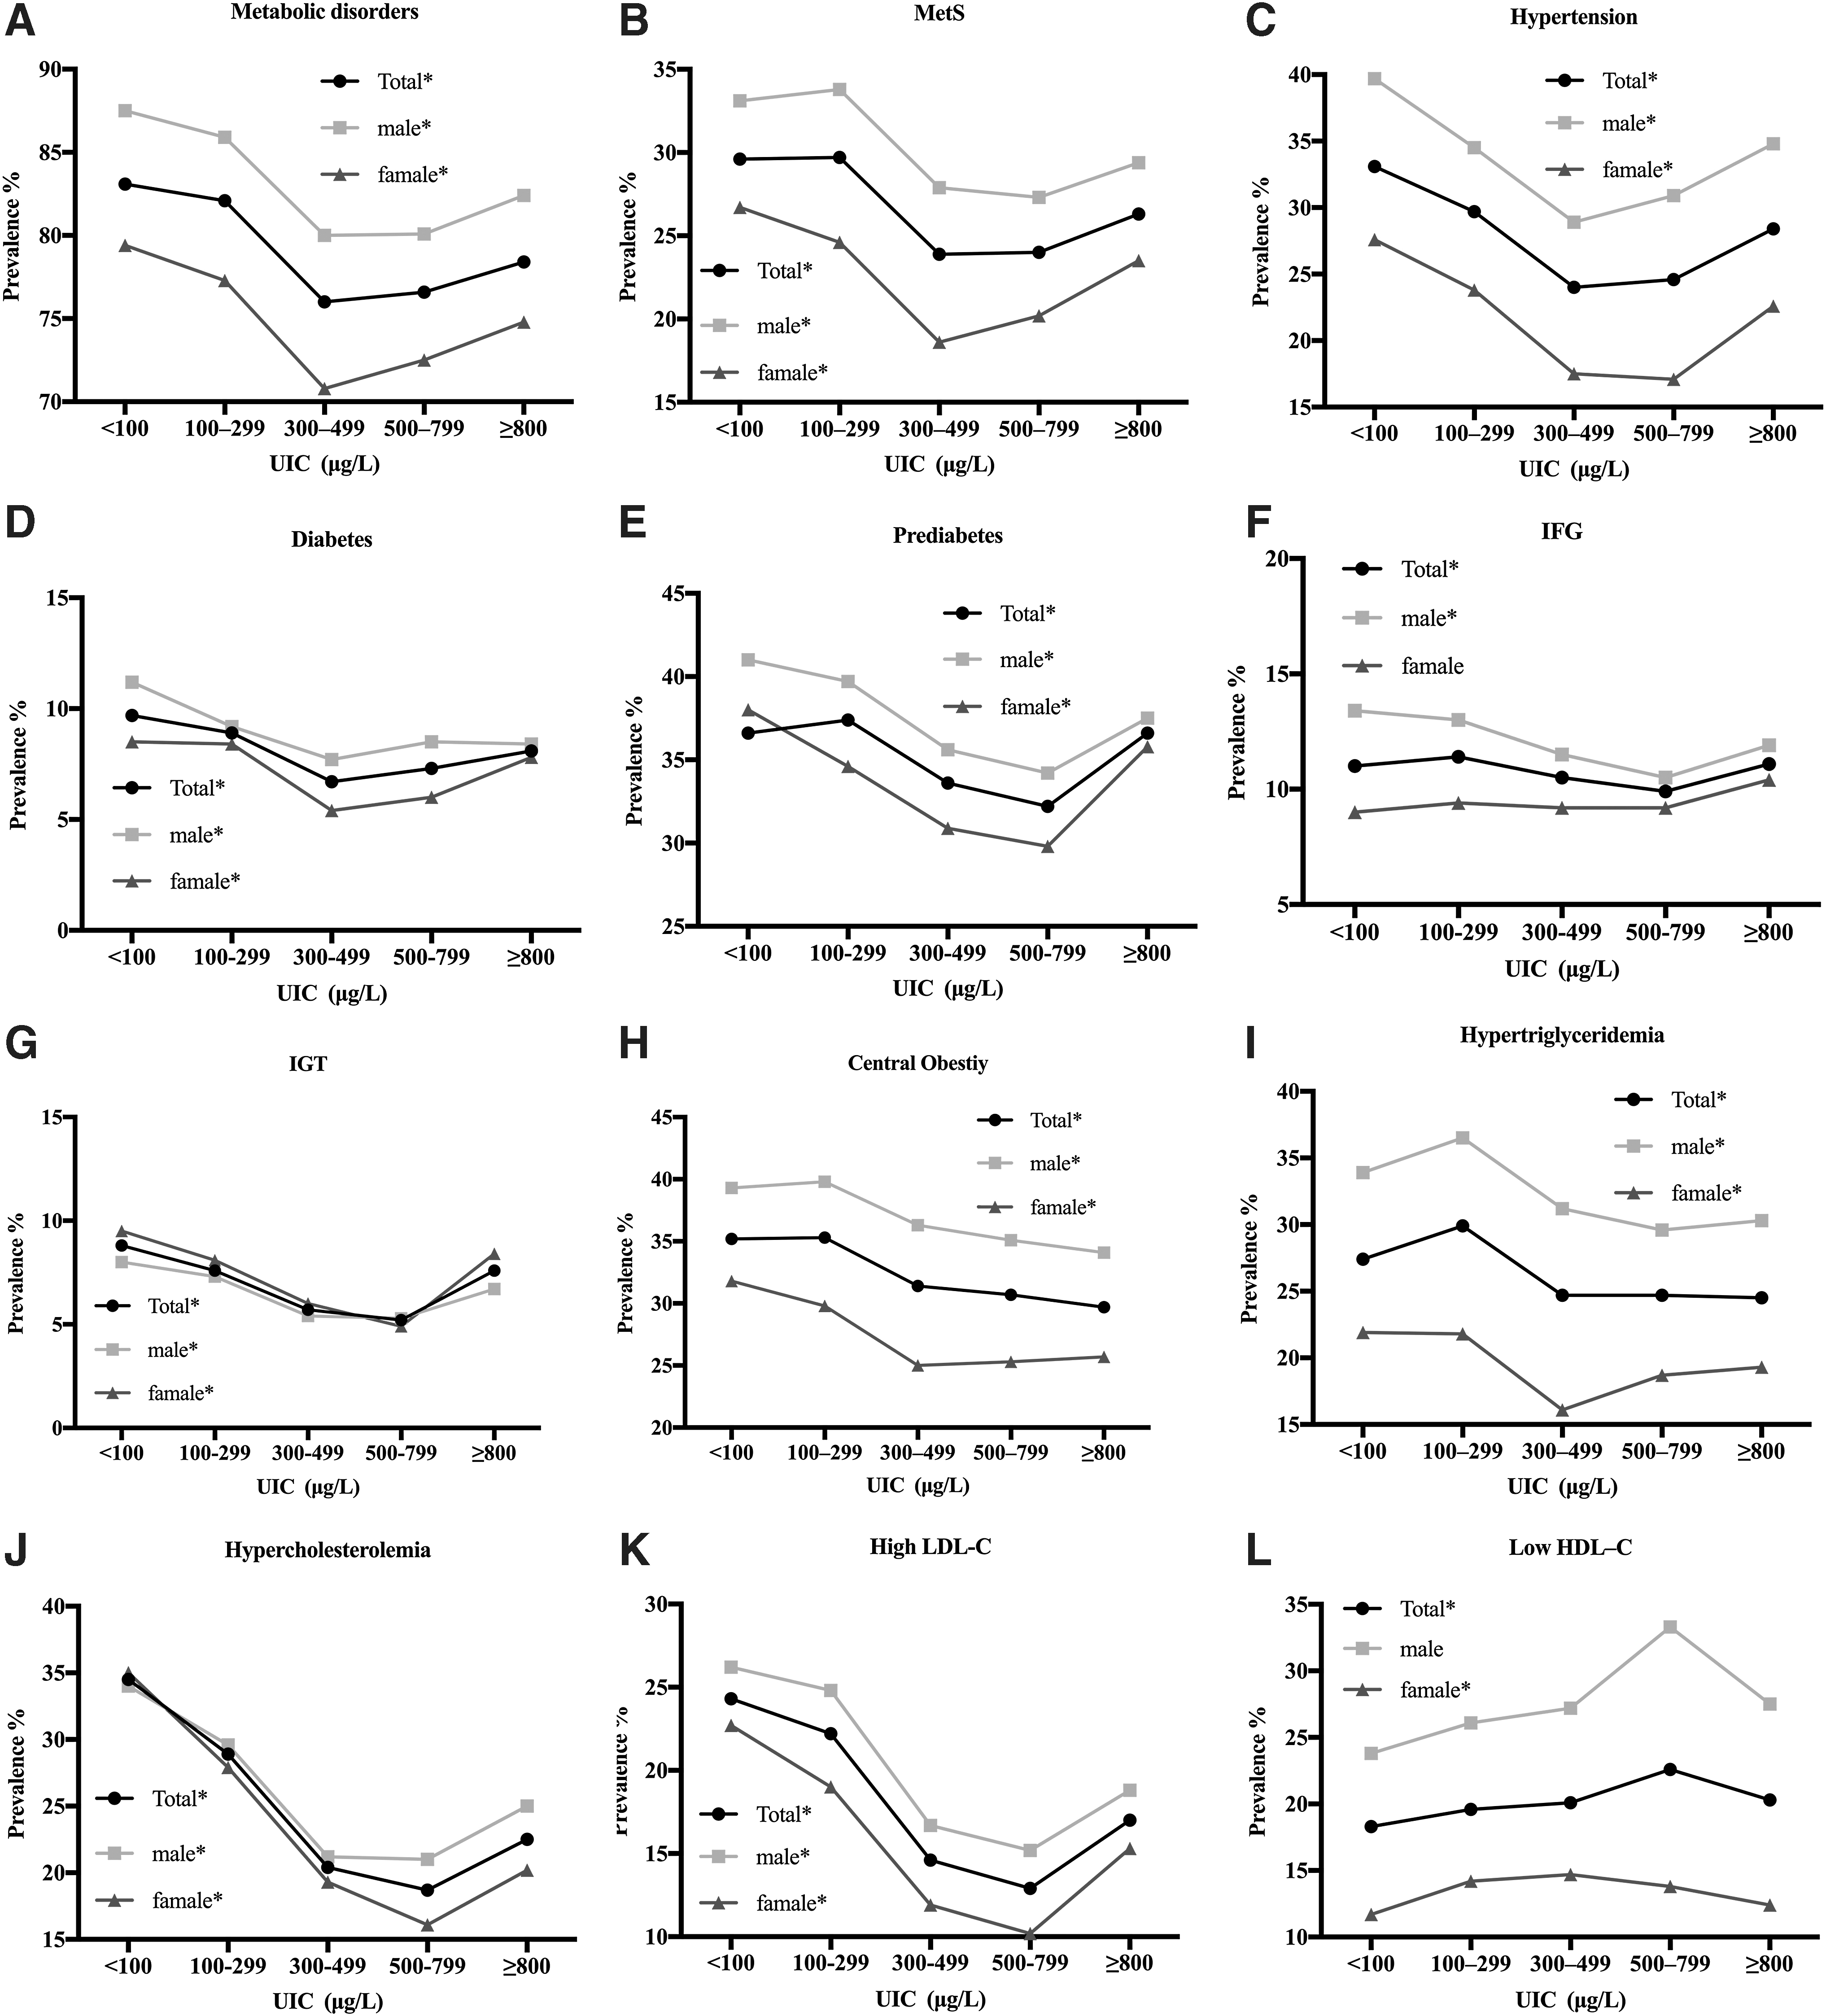
Association of the prevalence of metabolic disorders and related diseases with the UIC. (
Adjusted Prevalence Odds Ratios and 95% Confidence Intervals for the Association Between Urinary Iodine Concentration and Metabolic Disorders and Related Diseases
Model 1: Adjusted for age and sex; Model 2: Adjusted for age, sex, education, provinces, location, profession, income, ethnicity, iodized-salt intake, family history, smoking status, BMI, TSH, TPOAb, and TgAb.
p < 0.05.
CI, 95% confidence interval; HDL-C, high-density lipoprotein cholesterol; IFG, impaired fasting glucose; IGT, impaired glucose tolerance; LDL-C, low-density lipoprotein cholesterol; MetS, metabolic syndrome; OR, odds ratio; UIC, urinary iodine concentration.
Metabolic syndrome
The overall prevalence of MetS was 28.6% in the overall population, including 32.5% in males and 24.1% in females. The association between MetS prevalence and UIC exhibited a U-shaped curve (Fig. 2B, p < 0.05), with a nadir at 300–499 μg/L among the overall population and women. Among men, there was a lower prevalence at an UIC of 500–799 μg/L. The ORs [CIs] of MetS at UICs of 300–499 and 500–799 μg/L were 0.849 [0.787–0.915] and 0.856 [0.751–0.976], respectively, after adjusting for the confounding factors (p < 0.05).
Hypertension
The association between hypertension and UIC also showed a U-shaped curve, with a nadir at 300–499 μg/L (Fig. 2C). The prevalence values were 33.1%, 29.7%, 24.0%, 24.6%, and 28.4% for UICs of <100, 100–299, 300–499, 500–799, and ≥800 μg/L, respectively. Both men and women showed a similar trend; in particular, male subjects showed a significantly increased prevalence at an UIC of ≥800 μg/L (p < 0.05). As shown in Table 3, after adjusting for confounding factors, we found that the OR for UIC of 300–499 μg/L was 0.873 [CI 0.814–0.936] (p < 0.05), whereas that for UIC of <100 μg/L was 1.097 [CI 1.035–1.162] (p < 0.05), which indicated that UIC of 300–499 μg/L was a protective factor against hypertension and UIC of <100 μg/L was a risk factor.
Impaired glucose metabolism
The association between UIC and the prevalence of diabetes, prediabetes, and impaired glucose tolerance (IGT) also exhibited a U-shaped curve (Fig. 2D–G, all p for trend <0.05). The nadir of the curve was noted at 500–799 μg/L for prediabetes and IGT, but at 300–499 μg/L for diabetes, relative to an UIC of 100–299 μg/L, irrespective of sex (all p < 0.05). When the UIC was <100 μg/L, the prevalence of diabetes in the overall population and in men, along with the prevalence of prediabetes in women and IGT in the overall population and in women, were all significantly increased, relative to when the UIC was 100–299 μg/L (all p < 0.05). When the UIC increased to ≥800 μg/L, no association was observed between hyperglycemia and UIC (all p > 0.05). After adjusting for confounding factors, we observed that an UIC of 500–799 μg/L was an independent protective factor against prediabetes (OR = 0.883 [CI = 0.797–0.978], p < 0.05), whereas the corresponding range for IGT was 300–799 μg/L (300–499 μg/L: OR = 0.838 [CI = 0.748–0.939]; 500–799 μg/L: OR = 0.753 [CI = 0.612–0.928], both p < 0.05). No significant association was observed between UIC and the prevalence of diabetes and impaired fasting glucose (IFG), after adjusting for confounding factors in Model 2 (p > 0.05; Table 3).
Central obesity
The prevalence of central obesity among the overall population and in men significantly decreased when the UIC was ≥300 μg/L (p < 0.05; Fig. 2H), although no significant difference was noted when the UIC was <100 μg/L (p > 0.05), relative to a value of 100–299 μg/L. Among women, the prevalence was significantly decreased at UICs of 300–499 and 500–799 μg/L (25.0% and 25.3%, both p < 0.05) and increased at UIC of <100 μg/L (31.8%, p < 0.05), relative to an UIC of 100–299 μg/L. The OR for central obesity with an UIC of ≥800 μg/L was 0.797 [CI 0.675–0.942] (p < 0.05; Table 3) in Model 2.
Dyslipidemia
As shown in Figure 2I–K, hypertriglyceridemia, hypercholesterolemia, and high LDL-C levels all showed a U-shaped curve with a change in UICs (all p for trend <0.05), with a nadir at an UIC of 300–799 μg/L (except among female hypertriglyceridemia subjects where no difference was noted at UIC of 500–799 μg/L; p > 0.05), relative to an UIC of 100–299 μg/L. Compared with the UIC of 100–299 μg/L, the prevalence of hypercholesterolemia and high LDL-C (excluding the LDL-C levels in males, p > 0.05) was significantly increased at the UIC of <100 μg/L (p < 0.05). As shown in Table 3, the UIC of ≥300 μg/L was a protective factor against hypertriglyceridemia (300–499 μg/L: OR = 0.811 [CI = 0.759–0.866]; 500–799 μg/L: OR = 0.819 [CI = 0.730–0.919]; ≥800 μg/L: OR = 0.821 [CI = 0.714–0.944]), hypercholesterolemia (300–499 μg/L: OR = 0.727 [CI = 0.679–0.777]; 500–799 μg/L: OR = 0.646 [CI = 0.572–0.730]; ≥800 μg/L: OR = 0.747 [CI = 0.648–0.860]), and high LDL-C levels (300–499 μg/L: OR = 0.681 [CI = 0.631–0.734]; 500–799 μg/L: OR = 0.591 [CI = 0.514–0.680]; ≥800 μg/L: OR = 0.778 [CI: 0.666–0.909]) in Model 2 when compared with the UIC of 100–299 μg/L (all p < 0.05). The UIC of <100 μg/L was a risk factor against hypercholesterolemia (OR = 1.178 [CI = 1.117–1.242], p < 0.05).
In contrast, in Figure 2L, low HDL-C levels showed an inverted U-shaped association, with a zenith at an UIC of 300–799 μg/L (p for trend <0.05) in women and the general population. Compared with the 100–299 μg/L group, the prevalence of low HDL-C levels was significantly higher in the 500–799 μg/L group (except in men) and was lower in the UIC of <100 μg/L group irrespective of sex. The UIC between 300 and 799 μg/L was found to be a risk factor for low HDL-C levels (300–499 μg/L: OR = 1.081 [CI = 1.009–1.159]; 500–799 μg/L: OR = 1.236 [CI = 1.102–1.387], p < 0.05). Moreover, an UIC of <100 μg/L was found to be a protective factor for low HDL-C levels (OR = 0.891 [CI = 0.837–0.950], p < 0.05).
Discussion
In this cross-sectional study based on data from TIDE, we explored the prevalence of metabolic disorders in people with normal thyroid function and the relationship between iodine status and metabolic disorders. We demonstrate an association between UIC and metabolic disorders, as well as its components, which presented as a U-shaped curve. The curve varied by sex with common trends observed. We found a significant association between UIC of 300–499 μg/L and metabolic disorder and hypertension. An association was also observed between UIC of 300–799 μg/L and MetS and IGT. An UIC of ≥300 μg/L was found to be associated with hypertriglyceridemia, hypercholesterolemia, and high LDL-C levels. An UIC of 500–799 μg/L was associated with a lower prevalence of prediabetes and ≥800 μg/L was associated with lower prevalence of central obesity. An UIC of <100 μg/L was a risk factor for hypertension and hypercholesterolemia. After adjusting for confounders, no significant association was found between UIC and diabetes and IFG. An UIC of <100 μg/L was associated with low HDL-C levels, whereas an UIC of 200–799 μg/L was inversely associated with low HDL-C levels.
An association was found between UIC and metabolic-related diseases. In fact, several studies have focused on this association among adults. A cross-sectional study from India showed that urine iodine excretion had a negative correlation with age and SBP (15). This finding could result from a salt-restricted diet in patients who have been diagnosed with hypertension and thus consume less iodine. However, several studies have shown that a lowered salt intake does not affect iodine status in hypertensive patients (16,17). It is probably the iodine itself, not the salt intake, that affects the blood pressure. In our study, male subjects showed a significantly increased prevalence of hypertension when the UIC was ≥800 μg/L (p < 0.05), while after adjusted the confounding factors, no association was found between UIC ≥800 μg/L and hypertension (p > 0.05). The association between high salt consumption and the prevalence of hypertension should be considered. We also found that at a higher UIC (300–799 μg/L), the prevalence of metabolic disorders, MetS, hypertension, prediabetes, IGT, central obesity, hypertriglyceridemia, hypercholesterolemia, high LDL-C, and low HDL-C significantly decreased, relative to an UIC of 100–299 μg/L, consistent with that noted in previous studies. A study in Mexico reported that iodine deficiency is associated with hypertensive disease in pregnancy (9). In the present study, iodine deficiency (UIC <100 μg/L) was also found to be a risk factor for the prevalence of hypertension.
Al-Attas et al. found that the UIC was significantly lower in T2DM patients than in healthy controls, while urinary iodine was negatively associated with glucose, insulin, homeostasis model assessment for insulin resistance, and TG levels (10). Several animal trials also found an association between iodine and glucose metabolism and insulin. Larsson-Nyrén (18) found that adequate iodide levels could improve the function of insulin secretion in both the first and second phase in the glucose-stimulated insulin secretion of the isolated pancreatic islets. Iodine supplementation in goats reduced the blood glucose levels and improved the insulin sensitivity of tissues (19). Similarly, in the present study, we found that the UIC between 300 and 799 μg/L was an independent protective factor against hyperglycemia. However, a French cohort study of women found that iodine was a risk factor for T2DM (14). The differences in sex, age, menopause, different methods of measuring iodine status, and the exclusion of people with thyroid dysfunction should be considered.
Furthermore, the effect of thyroid hormones in MetS should also be considered. Roos et al. (20) found that even in cases with normal thyroid function, a positive association was detected between TSH and BMI. However, a study in Mexico showed that a negative correlation was observed between UIC and obese subject (r = −0.463, p = 0.001) (21). In this study, we found that the level of TSH increased with the increase of UIC within the normal range, whereas the prevalence of central obesity in men and the general population decreased. The relationship between urinary iodine and obesity needs further study.
A cross-sectional study completed in the United States in 2016 reported that low UIC was associated with dyslipidemia and was also a protective factor against low HDL-C. However, after adjustment of confounding factors, there was no association (8). In a study of iodine in drinking water and dyslipidemia in China, HDL-C in the excess iodine group negatively correlated with iodine in the water (22). The risk of abnormal HDL-C levels was significantly higher in the group that consumed water with high levels of iodine, which may be a risk factor for low HDL-C levels. Another study in China found that there may be a U-shaped relationship between iodine nutrition and the prevalence of low HDL-C (23). When the UIC was <200 μg/L, there was an inverse relationship between iodine nutrition and prevalence of HDL-C. When levels exceeding 300 μg/L were noted, there was a positive correction. In animal trials, the levels of TG, TC, and LDL-C increase at varying degrees in iodine deficiency groups, while in excess iodine groups, the levels of TG in male mice and the levels of TC in female mice were much lower than in the normal iodine group (24). Furthermore, the decline was more significant in the 10-fold iodine group than in the 50-fold iodine group. This study confirmed that a certain level of excess iodine has potentially beneficial effects on lipid metabolism. This is consistent with the U-shaped curve relationship between UIC of 300–799 μg/L and the incidence of hypertriglyceridemia, hypercholesterolemia, and high LDL-C levels, and hence, this UIC range was considered a risk factor for low HDL-C levels in our study. A study in China also reported that, compared with cases in iodine-adequate areas, the levels of HDL-C in cases in iodine-sufficient and iodine-excess areas were significantly lower (11).
Depending on the concentration, chemical type, and the oxidative state in the organs or tissues, iodine plays a dual role as an antioxidant or pro-oxidant. In cells, it can create a negative electric potential of −0.54 V to balance oxidation homeostasis at the physiological and molecular level (25). As a free radical, iodine limits the reactions of moieties such as iodinated tyrosine, histidine, and some polyunsaturated fatty acid double bonds on the cell membrane with oxygen free radicals (26). Iodide (I−) can directly act as an electron donor to quench free radicals such as hydroxide (OH−), hydrogen peroxide, and reactive oxygen species (ROS) (27). Due to these properties, iodine plays an important role as a protective factor against many diseases (12). Elevated oxidative stress is considered to be one of the most common and important features of MetS (28). Overnutrition leads to an elevation of blood glucose and fatty acids in serum, which then leads to metabolic stress in multiple organs and tissues, including islet cells. This series of events can consequently lead to a persistent state of oxidative stress (29). As a result, more ROS can be produced, thus leading to mitochondrial dysfunction and impairment of ATP production. All these processes can promote the occurrence and development of MetS. The antioxidant role of iodine on oxidative stress and insulin resistance could explain the protective effect of mildly increased UICs on metabolic disorder-related diseases in our study. Due to the dual role played by iodine (antioxidant or pro-oxidant), we believe that the beneficial effects of iodine are limited to certain concentrations. In cases of iodine deficiency and excess, the beneficial effect may disappear, or iodine may even become harmful. The incidence of gestational diabetes mellitus was significantly higher in women with iodine deficiency than in those with adequate iodine nutrition (30). Iodine deficiency also was associated with dyslipidemia (31). Excessive iodine intake may result in elevated blood glucose, blood pressure levels, and may also increase the risk of hypertension and diabetes (11). Participants with excess iodine exposure (UIC ≥400 μg/L) were at higher risk for all-cause mortality compared with those with adequate iodine nutrition (32). In an animal trial, excess iodine exposure for a long duration may lead to an increase in blood glucose and TG levels, a decrease in HDL levels, and severe destruction of the pancreatic structure, as observed on histology (33).
Our study has several strengths. First, this study includes data accumulated within the TIDE database, which covers all the provinces of mainland China. Consequently, the sample size was adequate. Second, we excluded the influence of thyroid hormones and observed the effect of iodine on human organs and tissues in those with normal thyroid function.
However, this study also has several limitations. First, the information relating to physical activity, alcohol consumption, and dietary iodine intake was not collected in the questionnaire, and the fT3, fT4, and insulin levels were not measured in all participants; hence, the effects of these factors could not be adjusted for. Second, due to the cross-sectional nature of this study, no causal inference between iodine and metabolic disorders could be drawn; therefore, we will explore this association further in future studies. Since our study excluded subjects with abnormal thyroid function and pregnant women, and only included adults, it cannot represent the distribution of metabolic disorders in the whole Chinese population.
In summary, iodine deficiency is associated with both thyroid and metabolic disorders. Appropriate iodine intake may be associated with a decrease of the prevalence of metabolic disorders and its related diseases, including MetS, hypertension, central obesity, hyperglycemia, IGT, prediabetes, hypertriglyceridemia, hypercholesterolemia, and high LDL-C levels. Iodine might play a protective role through its antioxidant mechanisms. However, increased iodine intake might be associated with the occurrence of low HDL-C, for which the specific mechanism is unclear.
Footnotes
Acknowledgments
We thank the participants of this study. For their continuous support, assistance, and cooperation, we thank Jiang He and Chung-Shiuan Chen (Tulane University); Wei Gong, Chenling Fan, Hong Wang, Hongmei Zhang, Shuangning Ding, Xiaochen Xie, and Tingting Liu (The First Hospital of China Medical University); Caiping Li and Jian Huangfu (The Affiliated Hospital of Inner Mongolia University); Nan Jin (Chinese PLA General Hospital); Wuquan Deng and Fang Deng (Third Military Medical University); Haicheng Zhou (The First Affiliated Hospital of Dalian Medical University); Qingling Lu (Cardiovascular and Cerebrovascular Disease Hospital of Ningxia Medical University); Yunfeng Shen (The Second Affiliated Hospital of Nanchang University); Guodong Liu (The First Affiliated Hospital of Harbin Medical University); Junxiu Hou and Zhiqiang Zhang (The Affiliated Hospital of Inner Mongolia Medical University); Hong Zhang (The Second Xiangya Hospital); Xiaodong Mao, Qifeng Wang, and Kun Wang (Nanjing University of Chinese Medicine); Yanping Wang (Fujian Medical University Union Hospital); Xiaojun Ma (The First Affiliated Hospital of Zhengzhou University); Liheng Meng (First Affiliated Hospital of Guangxi Medical University); Weihua Linle and Tuanyu Fang (Hainan General Hospital); Xingjun Liu and Yanru Zhao (The First Affiliated Hospital of Xi'an Jiaotong University); Lulu Chen, Jiaoyue Zhang, and Hanyu Wang (Huazhong University of Science and Technology); Jingfang Liu and Songbo Fu (The First Hospital of Lanzhou University); Qingguo Lv (West China Hospital); Chenglin Sun (The First Hospital of Jilin University); Qiuming Yao and Ronghua Song (Shanghai University of Medicine & Health Science Affiliated Zhoupu Hosipital); Tingting Chen (The First Hospital of An Hui Medical University); Ben Niu (The First People's Hospital of Yunnan Province); Mingtong Xu and Feng Li (Sun Yat-sen Memorial Hospital); Lizhen Lan (The First Hospital of Shanxi Medical University); Jun Yue and Jia Song (People's Hospital of Tibet Autonomous Region); Yanan Li and Wei Luo (Qinghai Provincial People's Hospital); Xiaoming Lou and Zhe Mo (Zhejiang Provincial Center for Disease Control and Prevention); Nianchun Peng and Lixin Shi (Affiliated Hospital of Guiyang Medical University); Mian Wang, Qiuxiao Zhu, and Lingling Yuan (Second hospital of Hebei Medical University); Haiqing Zhang (Shandong Provincial Hospital affiliated with Shandong University); Yong Fan (The First Affiliated Hospital of Xinjiang Medical University); Hongyan Wei (Tianjin Medical University General Hospital).
Author Disclosure Statement
No competing financial interests exist.
Funding Information
This work was supported by the Research Fund for Public Welfare from the National Health and Family Planning Commission of China (Grant No. 201402005). Scientific Bolstering Project of Sichuan Province (Grant No. 2014SZ0005).
Supplementary Material
Supplementary Table S1