
Abstract
Background:
Despite advances in targeted kinase inhibitor development for patients with medullary thyroid cancer (MTC), most patients develop resistance and would benefit from alternative approaches. Immune-based therapies are now considered for patients with progressive MTC. This study is the first comprehensive assessment of the immune milieu, immune-suppressive molecules, and potential tumor antigens in patients with MTC.
Methods:
Primary and/or regionally metastatic tumor tissues from 46 patients with MTC were screened for immune infiltrates by using standard immunohistochemistry (IHC) and further analyzed by multispectral imaging for T cell and myeloid markers. RNASeq expression profiling was performed in parallel. RNASeq, targeted sequencing, and IHC techniques identified cancer-associated mutations and MTC-enriched proteins.
Results:
Organized immune infiltration was observed in 49% and 90% of primary and metastatic tumors, respectively. CD8+ cells were the dominant T cell subtype in most samples, while CD163+ macrophages were most frequent among myeloid infiltrates. PD-1+ T cells were evident in 24% of patients. Myeloid subsets were largely major histocompatibility complex II (MHCII−), suggesting a dysfunctional phenotype. Expression profiling confirmed enrichment in T cell, macrophage, and inflammatory profiles in a subset of samples. PD-L1 was expressed at low levels in a small subset of patients, while the immune regulatory molecules CD155 and CD47 were broadly expressed. Calcitonin, GRP, HIST1H4E, NOMO3, and NPIPA2 were highly and specifically expressed in MTC. Mutations in tumor suppressors, PTEN and p53, and mismatch repair genes, MSH2 and MSH6, may be relevant to disease progression and antigenicity.
Conclusions:
This study suggests that MTC is a more immunologically active tumor that has been previously reported. Patients with advanced MTC should be screened for targetable antigens and immune checkpoints to determine their eligibility for current clinical trials. Additional studies are necessary to fully characterize the antigenic potential of MTC and may encourage the development of adoptive T cells therapies for this rare tumor.
Introduction
Medullary thyroid cancer (MTC) is a rare neuroendocrine tumor, derived from calcitonin-producing C-cells, that accounts for <5% of thyroid cancer cases (1,2). The 10-year survival rate decreases from 96% in patients with tumor confined to the thyroid to 75% and 40% with regional and distant metastasis, respectively (3,4). Cytotoxic chemotherapeutic drugs can induce transient benefits in MTC, but their role as durable and/or curative therapies is limited (5). Recent treatments for MTC include multi-kinase inhibitors that target the RET and MAPK pathways. Vandetanib and cabozantinib achieved a partial response in 45% and 28% of patients with MTC, respectively, leading to FDA approval (6,7). More potent RET inhibitors are in development; however, these therapies will not be useful in patients who lack RET mutations (∼45% of cases).
Immune-based therapies have been considered for patients with MTC, driven by early studies showing immune reactivity to tumor lysate (8,9). Dendritic cell-based vaccinations for MTC using tumor lysate, calcitonin, or carcinoembryonic antigen (CEA) have shown promise (10 –12). A recent phase I trial investigating a recombinant yeast-CEA vaccine in patients with metastatic CEA+ tumors included one patient with MTC who developed an impressive tumor-specific T cell response and stable disease (13). Based on this study, a phase II trial is now evaluating this approach in patients with recurrent MTC (NCT01856920). In addition to these well-characterized tumor-associated antigens (TAA), common mutations in RET, HRAS, and KRAS may be targeted by the immune response (14). The efficacy of the immune checkpoint blocker pembrolizumab (anti-PD-1; Merck) is under investigation in patients with progressive MTC (NCT03072160). This trial will begin to elucidate the inherent therapeutic potential of the endogenous T cell response in MTC.
Surprisingly little is known about the immune milieu and the role of immune checkpoints in MTC. To this end, we used multispectral imaging (MSI) and RNASeq to profile the immune milieu of primary tumors and regional lymph node metastases in a cohort of 46 patients with MTC. In parallel, we assessed the expression of key immunoregulatory molecules, potential neoantigens, and TAA. These studies will inform current and future therapeutic strategies for patients with advanced MTC.
Methods
Patients, sample collection, and disease parameters
MTC patients from the University of Colorado Hospital and throughout the United States were recruited for this study. All patients had previously undergone thyroidectomy and/or neck dissection between 2001 and 2016. Formalin-fixed paraffin-embedded (FFPE) surgical specimens were collected after Internal Review Board approval. Four-micrometer sections were stained for pathological analysis with hematoxylin and eosin (H&E). Multiple sections were used for immunohistochemistry (IHC) and isolation of total nucleic acids. Information on tumor size, invasion, and lymph node metastases was obtained from pathology reports. The American Joint Committee on Cancer (AJCC, Sixth Edition) TNM scoring was utilized for staging (15).
Tumor-associated leukocyte and lymphocytic thyroiditis scoring
Tumors were analyzed by H&E and anti-CD45 pan-leukocyte staining for the presence and degree of lymphocytic infiltration in peripheral thyroid tissue (lymphocytic thyroiditis [LT]) and in association with the tumor. Patients with organized aggregated leukocytes in the residual thyroid tissue were considered positive for LT. Tumor-associated leukocyte (TAL) infiltrate was assessed on a four-point qualitative scale: 0: no evidence of leukocytes; 1: scattered peritumoral (PT); 2: aggregated PT; 3: <10 intra-tumoral (IT) leukocyte aggregates (>10 cells) ± PT leukocytes; and 4: ≥10 IT leukocyte aggregates ± PT leukocytes.
Multispectral imaging
MSI was performed by the Vectra 3.0 Automated Quantitative Pathology Imaging System (Perkin Elmer). Four-micrometer sections were sequentially stained in panel 1 for cytokeratin (MA5-13203; Thermo Fisher Scientific), CD4 (4B12; Thermo Fisher Scientific), Tim-3 (D5D5R; Cell Signaling), PD-1 (NAT105; Abcam), CD8 (4B11; Thermo Fisher Scientific), and FoxP3 (D2W8E; Cell Signaling) and panel 2 for CD33 (SP266; SpringBio), CD163 (10D6; Abcam), CD11c (5D11; Sigma Cell Marque), HLA-DR/DQ/DP (CR3/43; Abcam), CD68 (KP1; Abcam), and cytokeratin on a Bond RX autostainer (Leica). Slides were dewaxed, and antigen retrieval was performed (ER2 or ER1) for 20 minutes at 93°C. After a 30-minute block (Antibody Diluent reagent; Perkin Elmer), tissues were incubated for 30 minutes with the primary antibody, 10 minutes with horseradish peroxidase (HRP)-conjugated secondary polymer (anti-mouse/anti-rabbit; Perkin Elmer), and 10 minutes with HRP-reactive OPAL fluorescent reagents (Perkin Elmer). Slides were washed between staining steps with Bond Wash (Leica) and stripped between each round (ER1/2). After the final staining, slides were heat-treated (ER1), stained with DAPI (Perkin Elmer), and coverslipped with Prolong Diamond mounting media (Thermo Fisher). Whole-slide scans were collected at 10 × and 5–30 regions, relative to the degree of immune infiltration, and they were selected for imaging at 20 × . Images were analyzed with inForm software (Perkin Elmer) to unmix fluorochromes, subtract autofluorescence, segment tissue tumor and stromal regions, segment cellular compartments, and phenotype the cells according to morphology and cell marker expression. Cell phenotypes were defined as follows: CD8+ T cell, CD8+CD4−; CD4+ T cell, CD8−CD4+FoxP3−; regulatory T cell, CD8−CD4+FoxP3+; “M1” macrophage, CD68+CD163−; “M2” macrophage, CD68+CD163+, dendritic or monocytic cell, CD11c+CD68+/−; tumor cell, CK+. Cells negative for all markers were classified as “other.” Leukocyte frequencies were displayed as percent of total non-tumor cells. Single cell data were converted to flow cytometry standard files, allowing co-expression analysis within each phenotype (Flowjo™; TreeStar).
Microdissection and total nucleic acid isolation for ThyroSeq™ analysis
Four-micron FFPE tissue was baked at 60°C for 1 hour, deparaffinized, and stained with hematoxylin. Tumor cells were visualized through a microscope and micro-dissected by using a mini-scalpel dipped in ethanol. Micro-dissected tumor cells were collected in ethanol, pelleted, washed in 70% ethanol, and air-dried. Cells were incubated overnight at 55°C in lysis buffer and proteinase K. Nucleic acid extraction was performed by using Agentcourt FormaPure kit as per manufacturer's protocol (Beckman Coulter). Samples were analyzed by Thyroseq v3 (16).
RNA sequencing and gene expression estimation
RNA in the total nucleic acid preparation was analyzed for integrity by using the Agilent Tape Station 4200. The Illumina TruSEQ RNA Exome kit and 40 ng of total RNA were used to construct libraries. Sequencing was done on the S4 flow cell of the Illumina NovaSEQ 6000 instrument. A median of 51.4 millions of paired-end 150 bp-long reads were obtained per sample. Illumina adapter sequences were removed with the help of Trimmomatic trimmer (17). Quality control was done with fastQC, and successful removal of adapter sequences was ensured (18). The “Tuxedo” pipeline was used for transcript expression analysis, as previously described (19). RNAseq reads were aligned to the hg38 reference genome with HISAT2, and gene-level expression was calculated by summing FPKM (fragments per kilobase million) values for gene transcripts.
Immune profiling using RNASeq expression data
Immune cell infiltration of the MTC was studied by using T cell and macrophage Immune Signatures (ImmSig) (20), as well as the interferon-gamma (IFN-γ) and expanded immune gene signature (IGS, Supplementary Fig. S5) (21). Enrichment scores were calculated by using the single sample gene set enrichment method (ssGSEA) with the help of the Bioconductor R package GSVA (22). This bioinformatics pipeline was validated in papillary thyroid cancer specimens with and without evidence of LT from The Cancer Genome Atlas (TCGA) (23).
Identification of genes enriched in MTC using RNASeq expression data
To identify genes that are highly and selectively expressed in MTC, we calculated an enrichment score for each gene g (ES
g
) defined as:
where g MTC is the median expression of gene g in MTC, and gx is an expression of gene g in x tissue from 35 normal tissues (NORM) from the Human Protein Atlas (thyroid and parathyroid tissues excluded) (24). The ES emphasizes genes that are highly expressed in MTC relative to the highest expressing normal tissue, but it also assigns higher score to genes that are not expressed at significant levels (>10 transcripts per million [TPM]) in most normal tissues. The TPM expression units were used in this analysis to match data in the Human Protein Atlas.
Identification of genetic variants from RNAseq data
The Broad Institute Genome Analysis Toolkit best practice recommendations for the variant discovery from RNAseq data were used to identify genetic variants in MTC samples. Raw RNASeq reads were mapped to the hg19 reference genome with the help of the STAR 2-pass alignment algorithm. Analysis ready RNAseq reads were obtained as described in the pipeline (
Immunohistochemical analysis
For TAL scoring, tissue sections were stained with anti-CD45 (KP1; Abcam) by using a manual IHC protocol after deparaffinization and antigen retrieval with citrate buffer (10 mM tri-sodium citrate, 0.05% Tween-20 [Sigma], pH 6). For protein expression studies, PD-L1 (28–8, 1:100; Abcam), CD155 (D3G7H, 1:100; Cell Signaling), CD47 (SP279, 1:50; SpringBio), major histocompatibility complex I (MHCI) (EMR8–5, 1:50; Abcam), CEACAM5/CEA (23/3/13, 1:100; Abcam), and CTAG1B (EPR13780, 1:2000; Abcam) stains were performed by using the Leica Bond RX autostainer (Bond Polymer Refine Detection kit and Leica IHC Protocol F). Slides were pretreated with ER1. After staining, slides were cleared and dehydrated on an automated Tissue-Tek Prisma platform and cover slipped (Tissue-Tek Film). Staining intensity was scored on a 1+ to 3+ scale, and the percentage of positive cells among total tumor cells was estimated. H scores [(1+ × percent positive) + (2+ × percent positive) + (3+ × percent positive)] were calculated. For rarely expressed proteins, PD-L1 and CTAG1B, the overall percentage of positive tumors cells is shown.
Statistical analyses
Statistically significant differences in RNA expression profiling between TCGA groups was estimated with Mann–Whitney U test. In MSI and IHC studies, the statistical significance of interval data was estimated by Mann–Whitney analysis. Correlations were assessed by using the Spearman test. The level of statistical significance was calculated by two-tailed analysis, and p-values ≤0.05 were considered significant. Statistical analyses were performed by using GraphPad Prism™ software.
Results
Leukocyte infiltration in primary and regionally metastatic MTC
Archived surgical specimens were collected from 46 patients with MTC. Forty-one primary tumors and 31 tumor-involved lymph nodes (TILN) were analyzed, and matched primary and TILN tissue was available for 24 cases (Table 1). Twenty-five of patients had persistently elevated serum calcitonin levels (>150 pg/mL). Fifteen of the primary tumors showed histological evidence of LT in the surrounding normal tissue. Thirty-eight of 41 primary MTC showed evidence of TAL (93%, TAL score 1–4), including 18 tumors with scattered PT, 14 with organized PT infiltrate (TAL 2), and 6 with IT aggregated TAL (TAL 3 and 4; Fig. 1A). Twenty-eight of 31 TILN analyzed showed organized aggregate TAL, 26 of which displayed IT aggregates. TAL score was maintained or increased in TILN in 22 out of 24 patients with matched primary and metastatic tissue and all patients with matched TILN and rTILN (n = 3; Fig. 1B). Aggregated TAL was more commonly seen in tumors with LT (11/14 vs. 7/18; Fig. 1C).
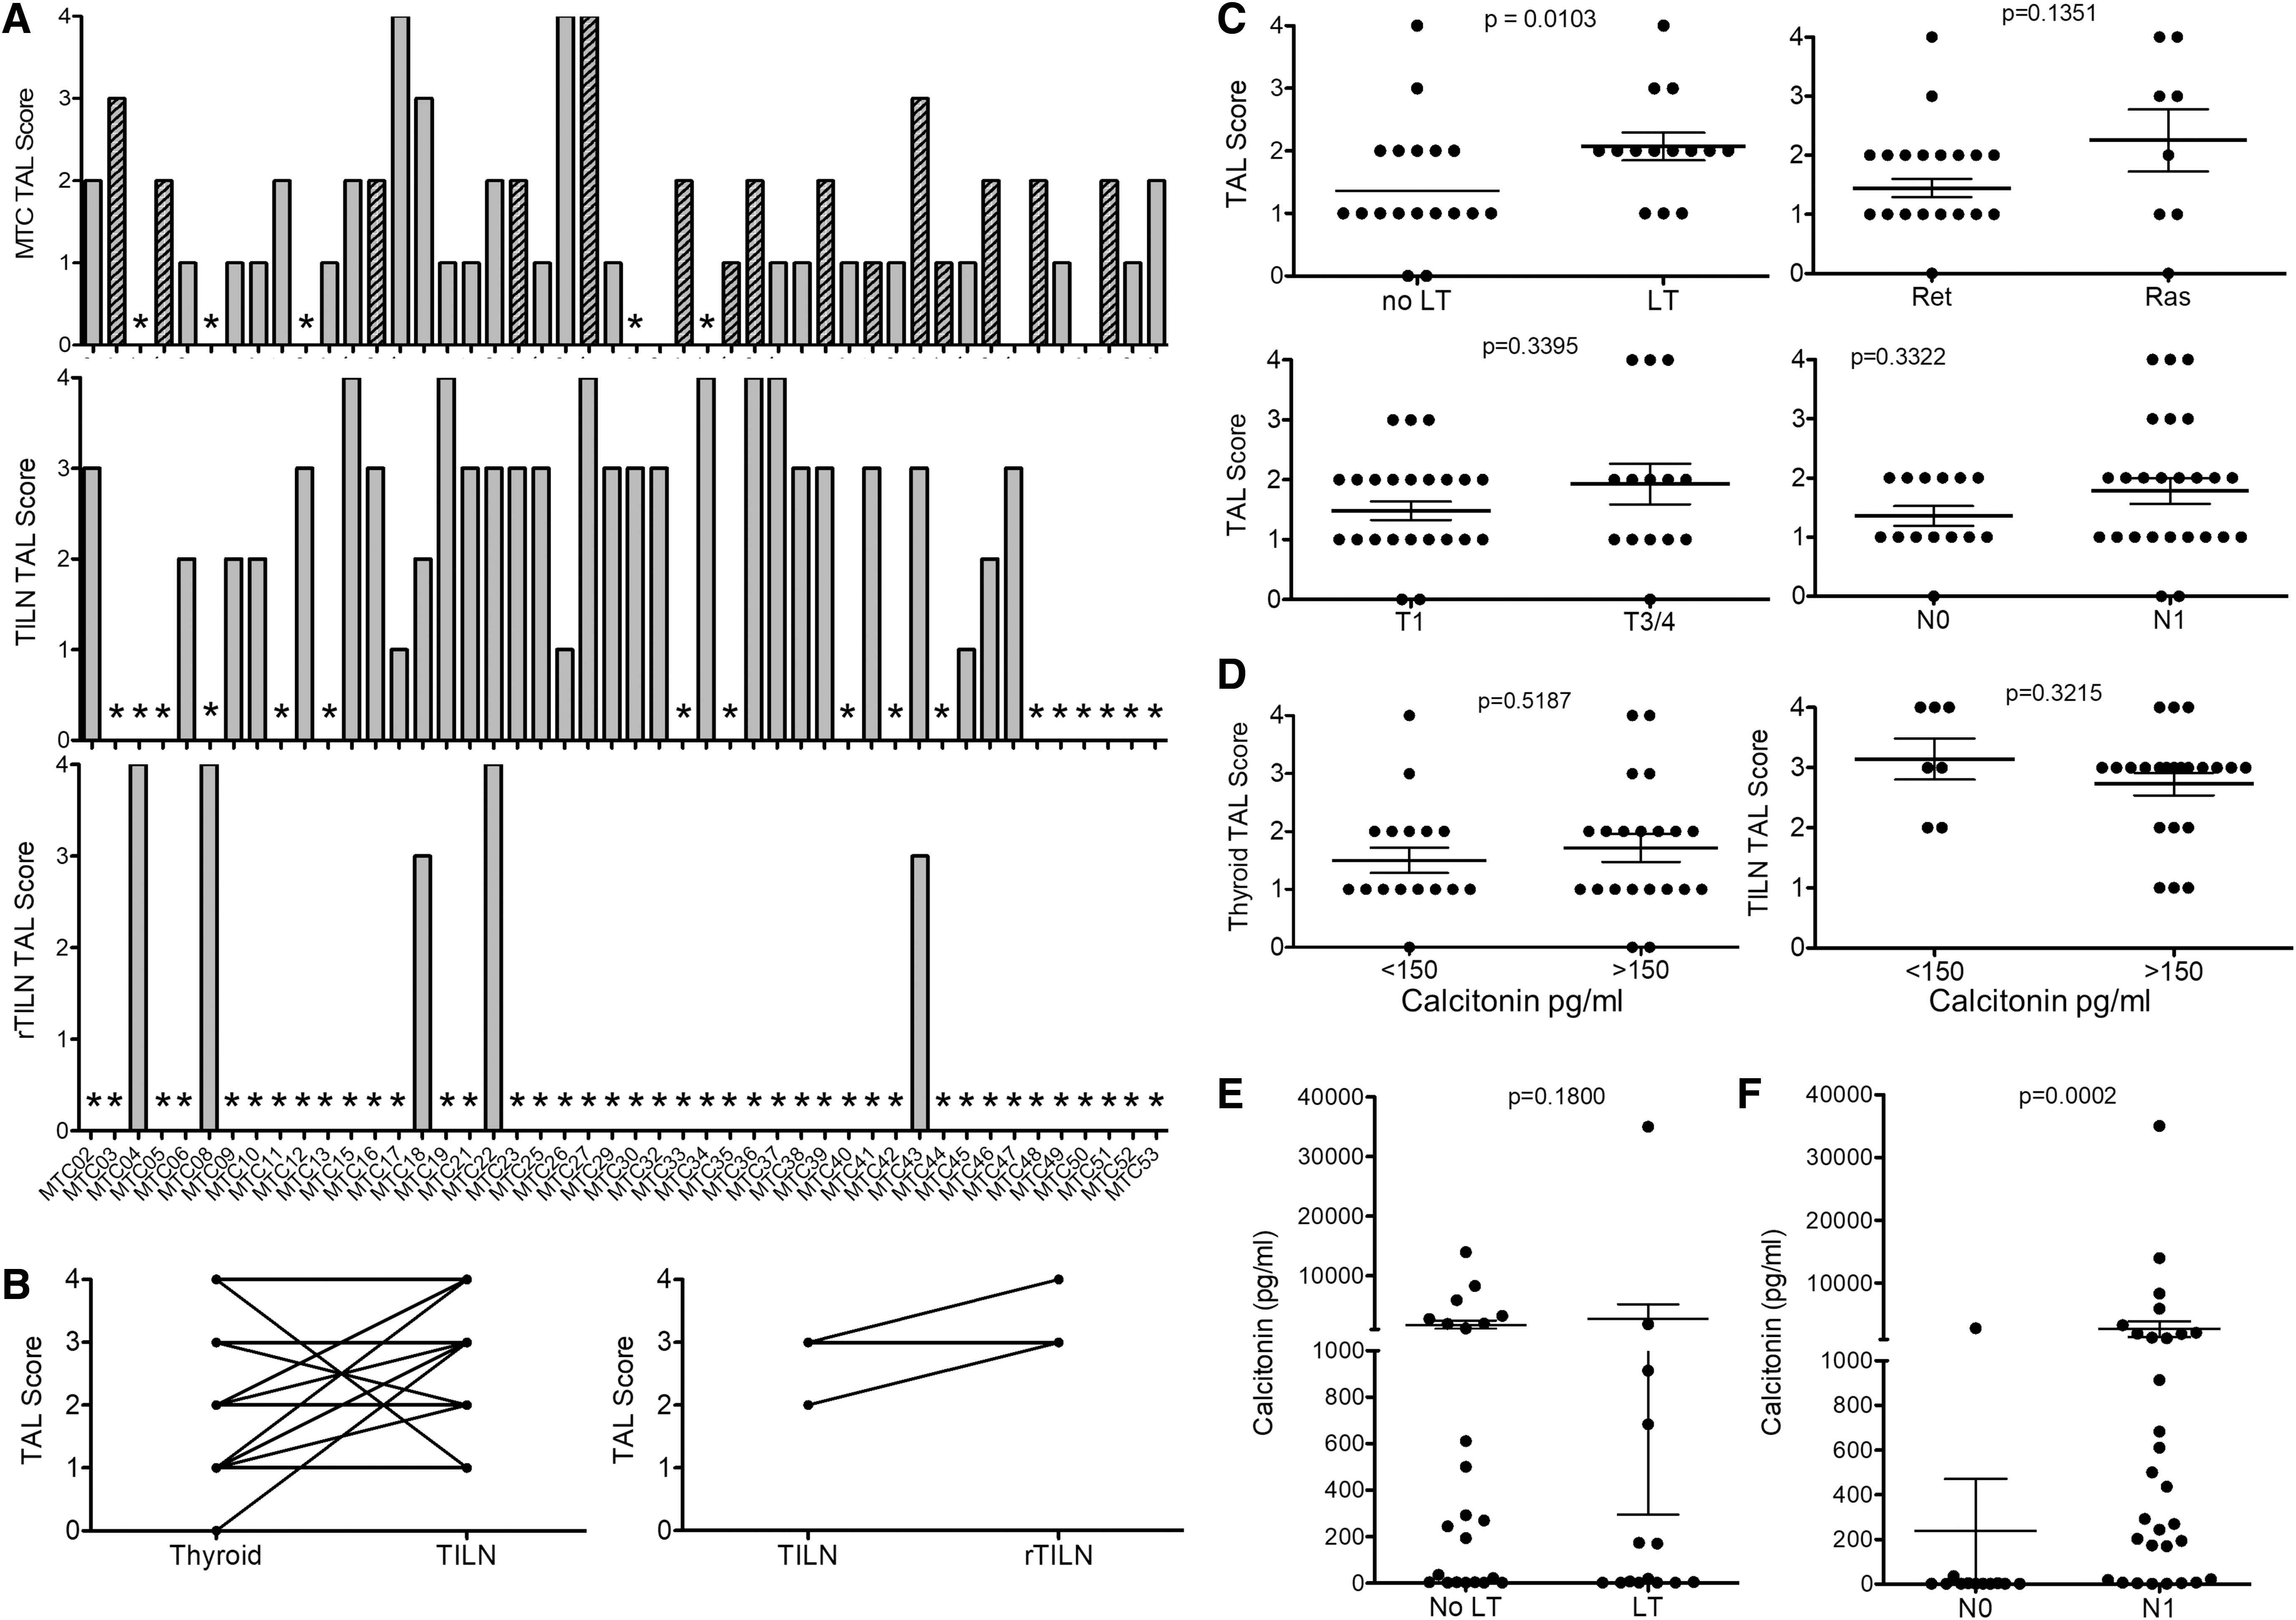
TALs in primary MTC and TILN. Formalin-fixed paraffin-embedded surgical specimens were analyzed by H&E and anti-CD45 IHC for evidence of tumor-associated leukocytes. TAL score is shown for primary MTC tumors, TILN, and rTILN (rTILN,
Clinical Summary of Medullary Thyroid Cancer Patients
rTILN, recurrent tumor-involved lymph nodes.
The degree of TAL infiltration in primary tumors did not correlate with mutation status (i.e., RET vs. RAS) or with disease stage at the time of thyroidectomy (Fig. 1C). Persistent disease (serum calcitonin >150 pg/mL) was not associated with TAL score in either primary tumors or TILN (Fig. 1D) or with histological evidence of LT (Fig. 1E). As expected, patients with regional lymph node metastases at primary surgery were more likely to have elevated calcitonin levels (Fig. 1F).
Immune profiling of MTC using MSI
Tumors with aggregated PT and/or IT TAL were further analyzed by MSI, with the goal of characterizing leukocyte subsets within visibly evident TAL (Supplementary Fig. S1 and Fig. 2). We investigated the presence of CD8+ T cells, CD4+ T cells, and CD4+FoxP3+ regulatory T cells (Tregs) and expression of the immune checkpoints PD-1 and Tim-3 (Fig. 2A). CD68, CD163, and CD11c were used to identify putative M1 macrophages, M2 macrophages, and dendritic cells, respectively (Figs 2B, C). MHCII staining was included to assess antigen-presenting potential. We also assessed the expression of CD33, a marker associated with early myeloid monocytic progenitors and myeloid-derived suppressor cells (MDSC) (26,27).
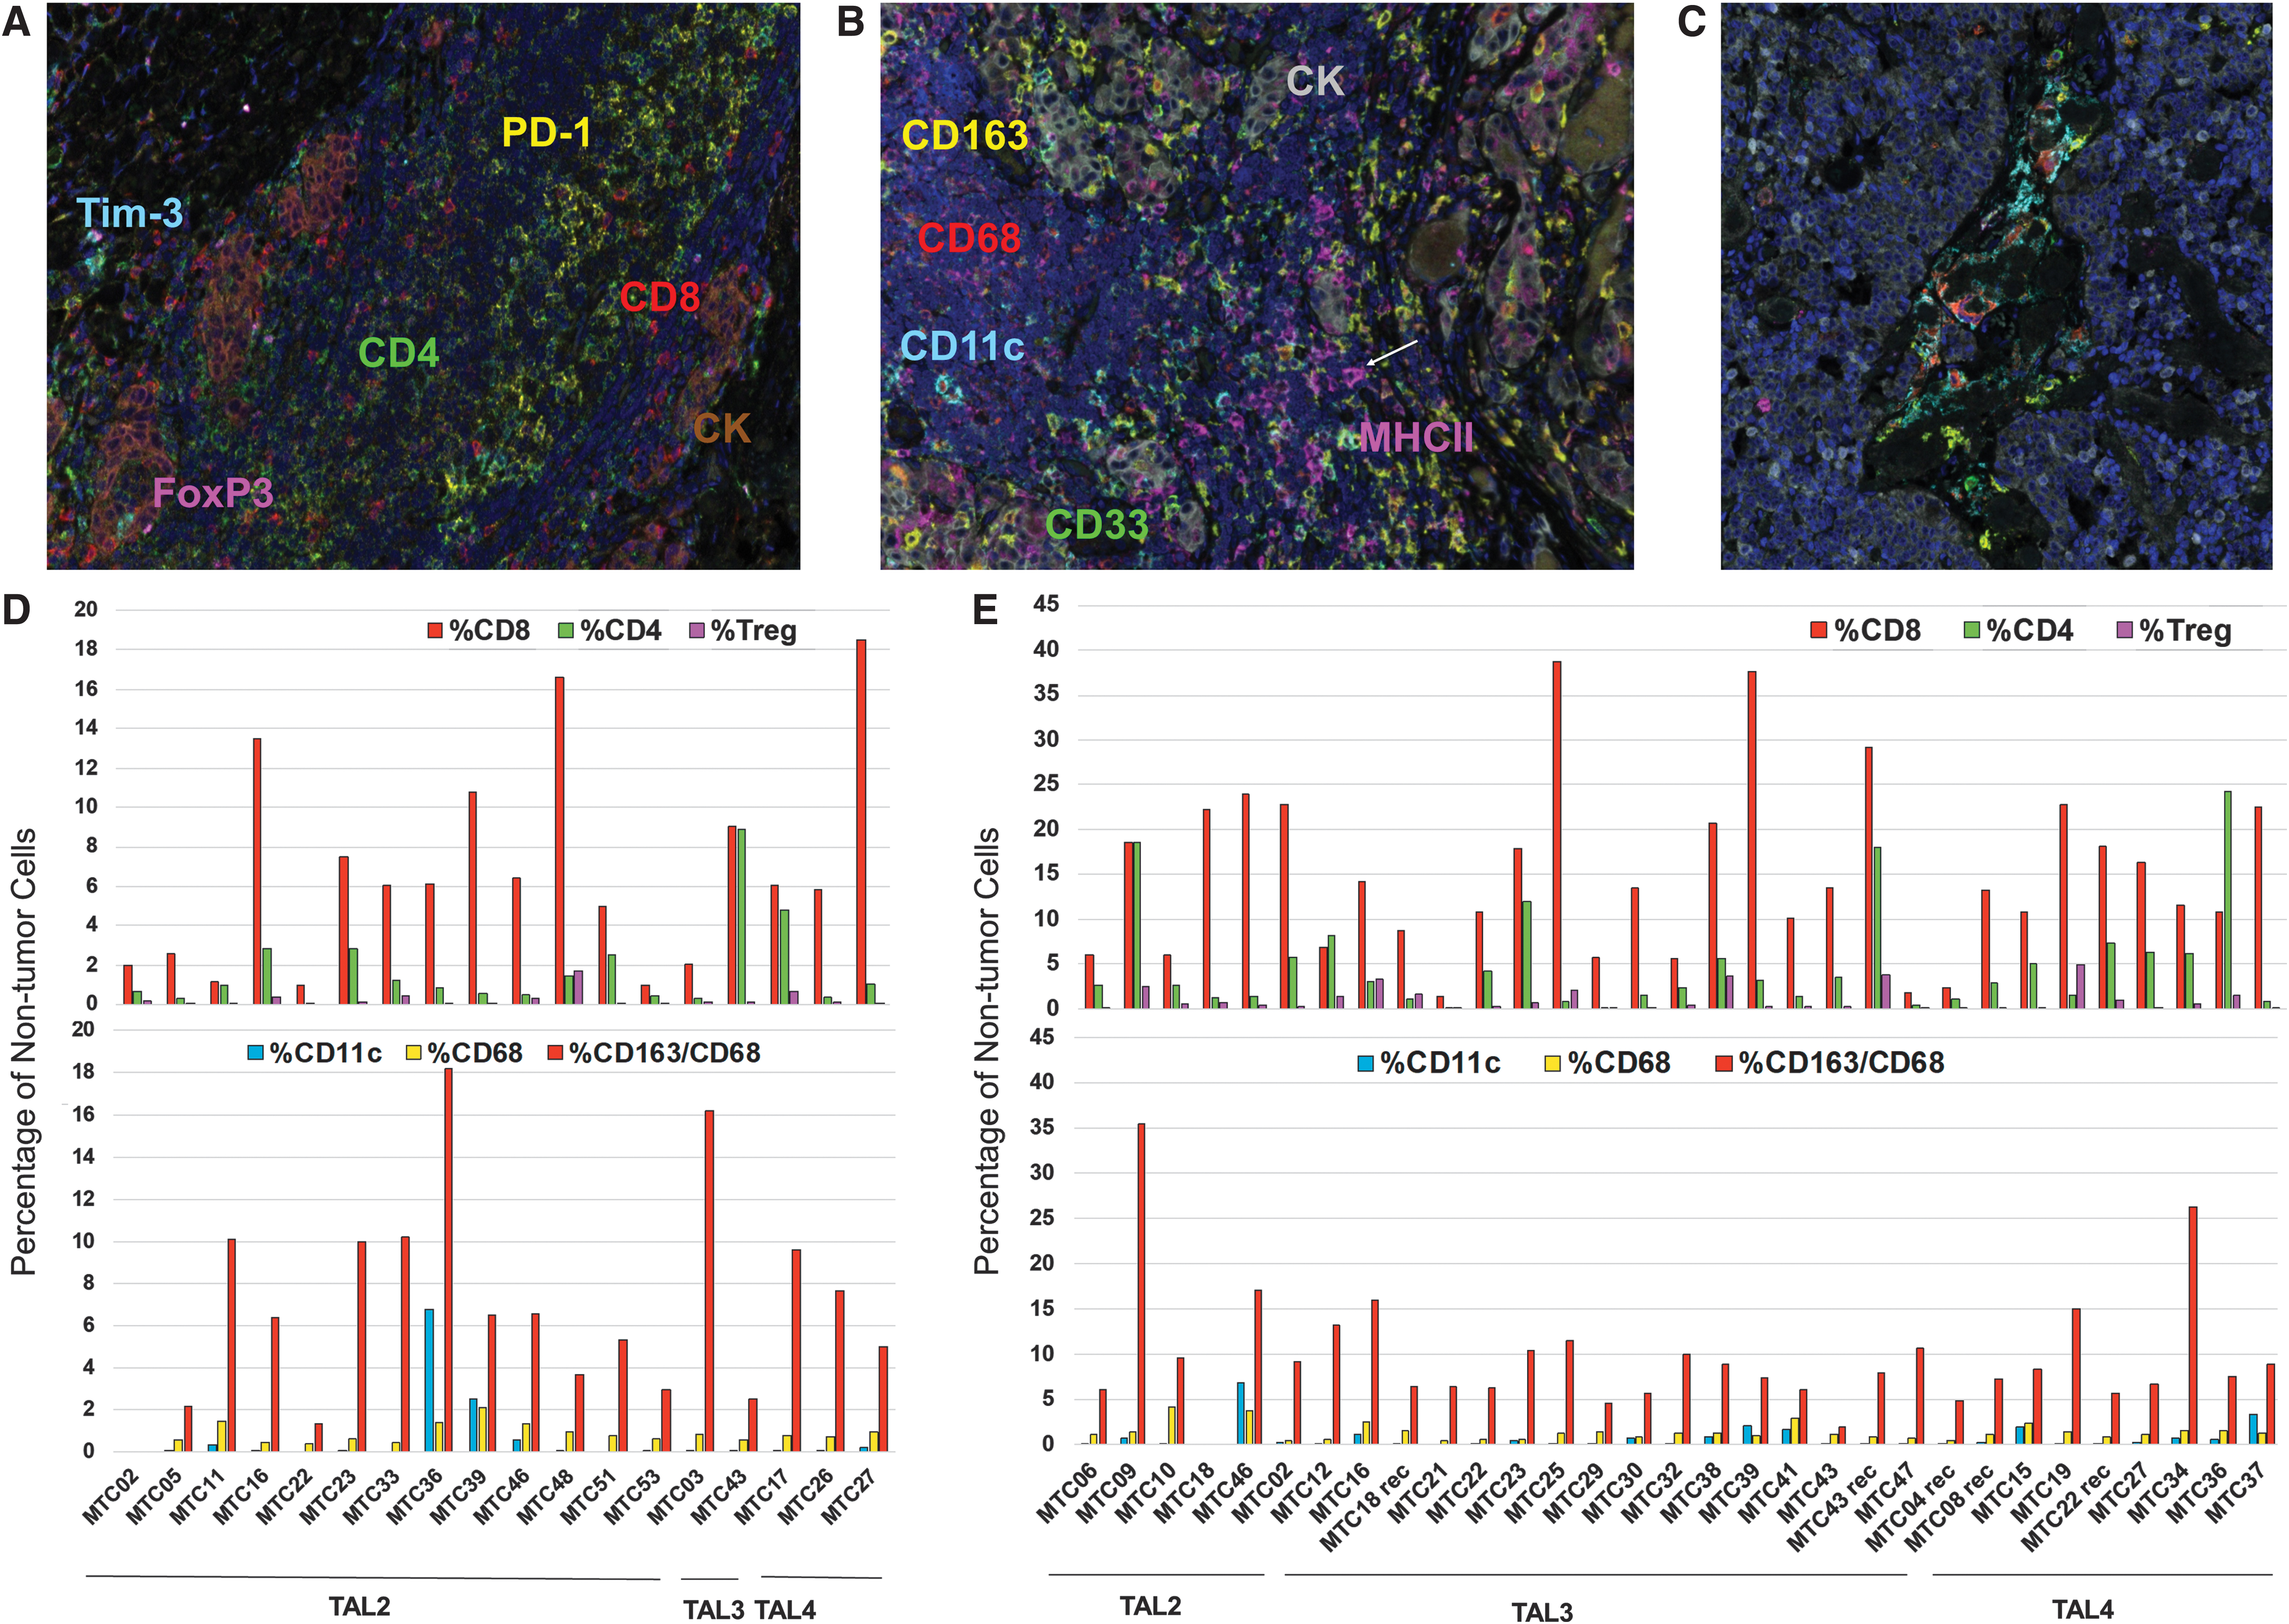
Multispectral imaging of TALs in MTC. Tumors with a TAL score of 2 or greater and sufficient tissue were further analyzed by multispectral IHC for markers of leukocyte subsets and function (n = 18 primary MTC, n = 31 TILN/rTILN). (
CD8+ T cells were the predominant T cell subset in the majority of tumors, comprising up to 18% and 38% of nontumor cells in primary MTC tumors (Fig. 2D) and TILN (Fig. 2E), respectively. CD4+ T cells were present at lower frequencies in most tumors, and Tregs constituted <5% of the nontumor infiltrate. T cells were evident in both stromal regions and within tumor parenchyma (Supplementary Fig. S2). B cells (CD20+) were evident in all samples tested, more common in stromal areas, and found at frequencies equal to or greater than total T cells in 9 out of 15 (60%) and 15 out of 30 (50%) of primary and metastatic tumors, respectively (data not shown).
The CD163+/CD68+ cells were prominent among the myeloid infiltrate in both stromal and tumor regions, while CD68+ and CD11c+ cells were sparse in most tumors. Both small, monocyte-like (Fig. 2B) and large dendritic cell-like (Fig. 2C) CD11c+ cells were evident in tumor samples. CD11c+ cells, when evident, were found in both tumor and stromal regions. In contrast, CD68+ cells were largely found infiltrating the tumor (Supplementary Fig. S2). No correlation was observed between the frequency of leukocyte subpopulations and TAL score, TNM stage, or serum calcitonin (data not shown).
Phenotypic analysis of leukocyte subsets in MTC using MSI
PD-1+CD8+ T cells were enriched (>50 cells) in 4 out of 18 primary tumors and 10 out of 31 TILN, while Tim-3 expression was sparse and co-expression of both checkpoint molecules was rare (Fig. 3A). The number of PD-1+CD8+ T cells did not correlate with tumor size or elevated calcitonin levels (Fig. 3B, C). PD-1 expression was also evident on CD4 T cells, often in tumors where CD8+PD-1+ T cells were enriched (i.e., primary MTC 33 and 43 and TILN 22rec, 36, and 43; Supplementary Fig. S3).

PD-1 expression by CD8+ T cells does not correlate with disease severity. Expression of PD-1 and Tim-3 was determined for CD8+ T cells in stromal regions after FCS file conversion by using Flowjo™ software (
As shown in Figure 4B, CD163+CD68+ were largely negative for MHCII expression, suggesting an immature and/or M2-like dysfunction phenotype (Fig. 4A). CD68+ and CD11c+ cells were also largely negative for MHCII expression (Fig. 4B). A similar expression pattern was observed in TILN (data not shown). MHCII expression was evident on nonmyeloid, nontumor cells, ranging from 5% to 30% of cells, in a subset of these samples (Supplementary Fig. S4). As shown in Figure 2B, these cells were small and likely of lymphocytic origin (i.e., B cells or T cells). High levels of MHCII are indicative of an active immune response; however, a higher frequency of MHCII+ cells did not correlate with reduced disease severity (data not shown).

MHCII and CD33 expression among myeloid cell infiltrate. Myeloid subsets in tumor regions were assessed for expression of MHCII and CD33 after FCS file conversion by using Flowjo software (
CD33 has been documented as a marker of MDSC (26,28). In primary (Fig. 4) and metastatic MTC (data not shown), CD33 was most commonly observed on CD163+CD68+ macrophages but was also evident on a subset of CD68+ macrophages and CD11c+ cells (Fig. 4C). Putative CD33+ MDSC that lacked CD68, CD163, or CD11c expression was present at a low frequency, accounting for <5% of the remaining nontumor cells in the majority of tumors (data not shown). This population was enriched to >10% and 25% in MTC27 thyroid and MTC46 TILN, respectively, but did not predict more severe disease (data not shown).
Immune profiling of MTC using RNASeq
To further investigate immune infiltrates in MTC samples, we generated RNA from a subset of primary MTC (n = 26) and metastatic (n = 4) tumors with varied TAL scores. Gene set enrichment analysis (Supplementary Fig. S5) estimated T cells and macrophage infiltrates (ImmSig) and evaluated the presence of the IFNγ-associated gene signature (IFNγ) and the expanded IGS, which includes genes enriched in an inflammatory T cell response (20,21). These gene signatures were first validated in differentiated follicular-derived thyroid tumors with or without underlying thyroiditis from the TCGA dataset (23). As expected, tumors from patients with thyroiditis scored higher for all gene sets (Supplementary Fig. S5).
T cell ImmSig, IFNγ, and IGSs were enriched in the majority of MTC tumors with aggregated intra-tumoral leukocytes (TAL3–4; Fig. 5A). IGS and T cell ImmSig scores displayed a strong correlation in these samples, in part due to overlap in 5 gene targets (Fig. 5B and Supplementary Fig. S5). The IGS score displayed a weak but statistically significant correlation with the TAL score (Fig. 5C). Of interest, tumors that had been scored as negative (TAL 0) displayed evidence of low- to mid-level expression for all signatures. Further, MTC36 showed only PT infiltration by histology (TAL2) but scored highest among the sample set for T cell, IFNγ, and IGSs. Immune signatures were not associated with mutation status (i.e., all RET vs. RET M918T vs. RAS; Supplementary Fig. S6).
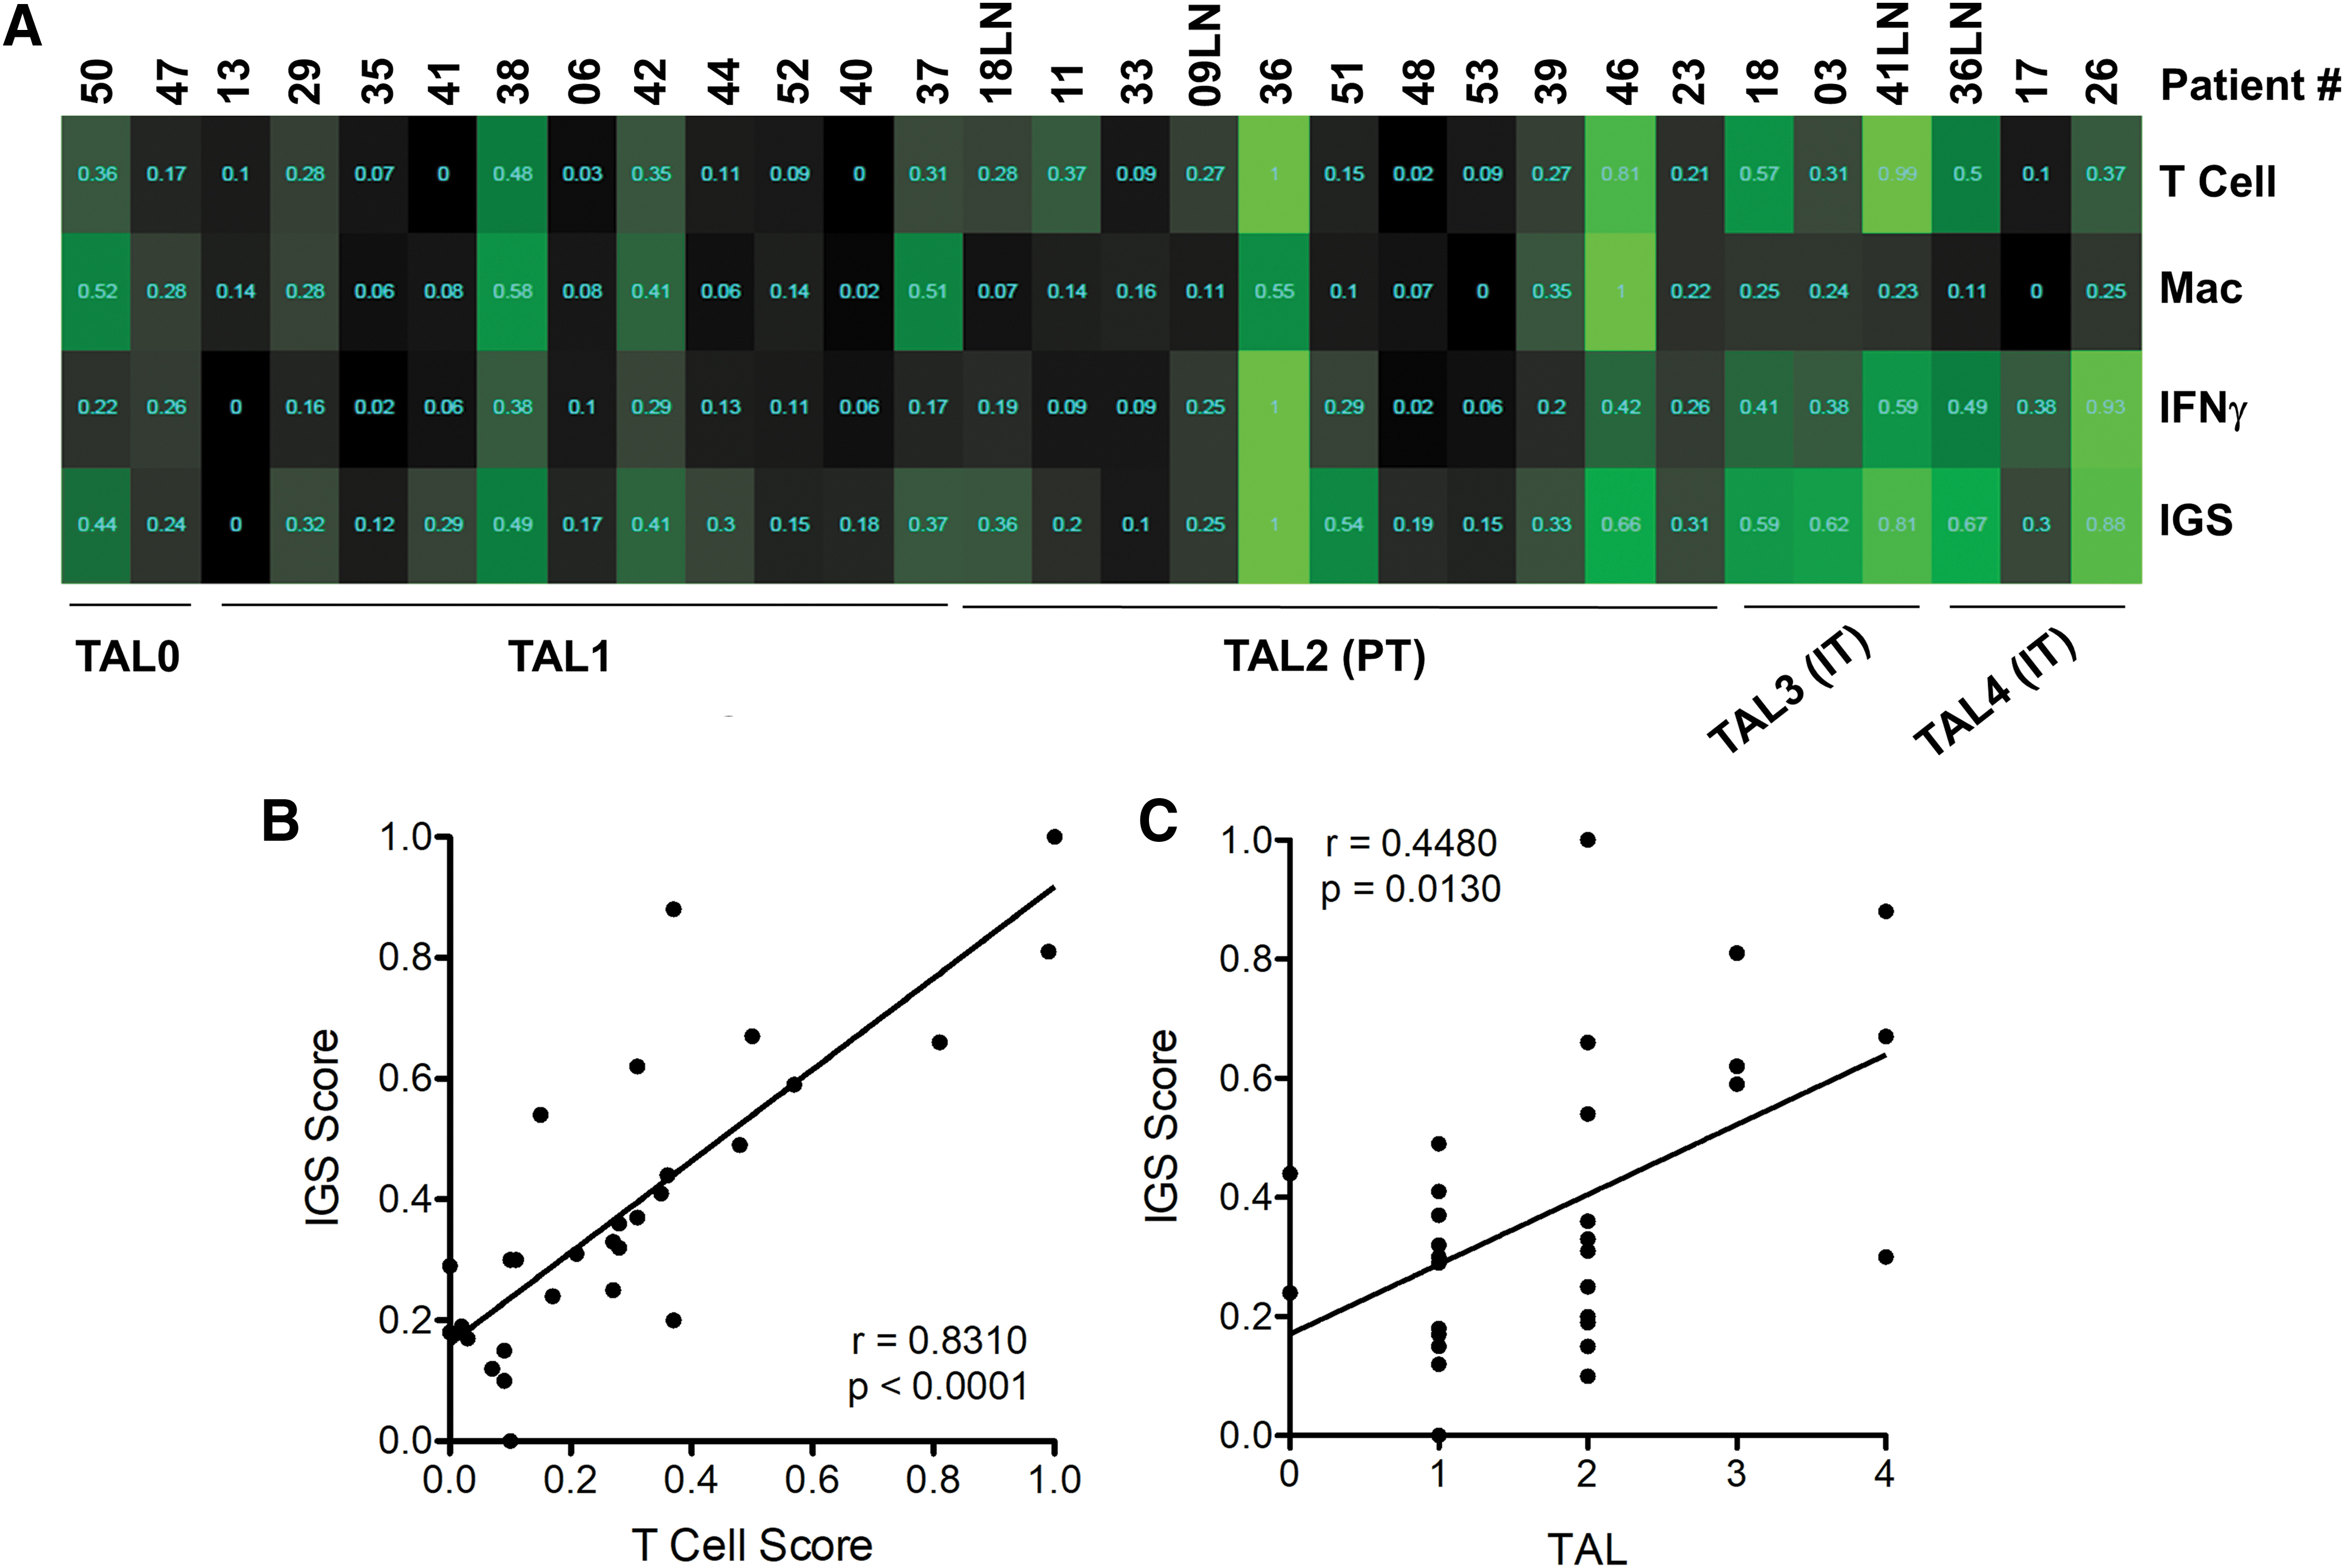
RNASeq signature analysis of immune infiltrate in MTC. Primary tumors and LN metastases were microdissected from surrounding tissue, and RNA was isolated for RNASeq analysis by using ImmSig signatures for T cells and macrophages (Mac) and interferon (IFN-γ) or expanded IGSs. A heatmap of ssGSEA IGS scores normalized to the scale between 0 and 1 and samples are shown from left to right in order of increasing TAL score (
Expression of immune relevant molecules and potential TAA in MTC
Tumors were analyzed by IHC (Fig. 6A) for expression of the immune suppressive molecules, PD-1 ligand-1 (PD-L1), CD155, and CD47 (signal regulatory protein [SIRP] α ligand). PD-L1 was expressed at a low frequency (1–5%) in 32% and 26% of primary and metastatic tumors, respectively. CD155 was highly expressed (H-score ≥100; >90% of tumor cells) by 56% of primary tumors and 97% of metastases. CD47 was also commonly expressed in 38% and 49% of primary and metastatic tumors, respectively. MHCI is expressed on all nucleated cells and mediates self and foreign or mutated antigen presentation to CD8+ T cells. Tumors commonly downregulate MHCI to evade CD8+ T cell recognition and cytotoxicity (29). To broadly investigate the antigenic potential in MTC, we stained tumors with a pan-MHCI antibody. MHCI expression remained high in the 89% of primary MTC and 62% of metastases.

Expression analysis of key markers immunogenicity in MTC. (
MHCI expression was comparable in most matched primary and metastatic tumors, although downregulation was evident in MTC22, 32, and 39 (Fig. 6C).
We next investigated the expression level of known tumor antigens in this relatively large cohort of MTC samples. As expected, 38 out of 39 primary and 29 out of 33 metastatic tumors expressed high levels of CEA. The expression of cancer-testis antigens (CTA) was assessed by IHC (CTAG1B/NY-ESO-1; Fig. 6A) and RNASeq (Fig. 6B). CT antigens were expressed by a subset of patients, most commonly in metastatic tumors from MTC18 and MTC41.
To identify additional potential TAA, gene expression in MTC was compared with that in normal human tissues. The top 10 genes selectively and highly expressed in MTC when compared with the normal tissues are shown in Figure 7A. Expression of these targets was elevated in the majority of patients (Fig. 7B). As expected, calcitonin (calcitonin-related polypeptide alpha and beta, CALCA and CALCB) was identified among the highest scoring genes. Gastrin-releasing protein (GRP), which has been previously identified as a potential tumor marker for MTC (30), also scored high in our analysis. Histone HIST1H4E displayed an impressive enrichment when compared with normal tissues. NOMO3 (nodal modulator 3) gene encodes a protein that is believed to be related to the collagenase gene family and was very specific to MTC over normal tissues. Nuclear pore complex interacting protein family member A2 (NPIPA2) also showed an expression pattern specific to MTC.
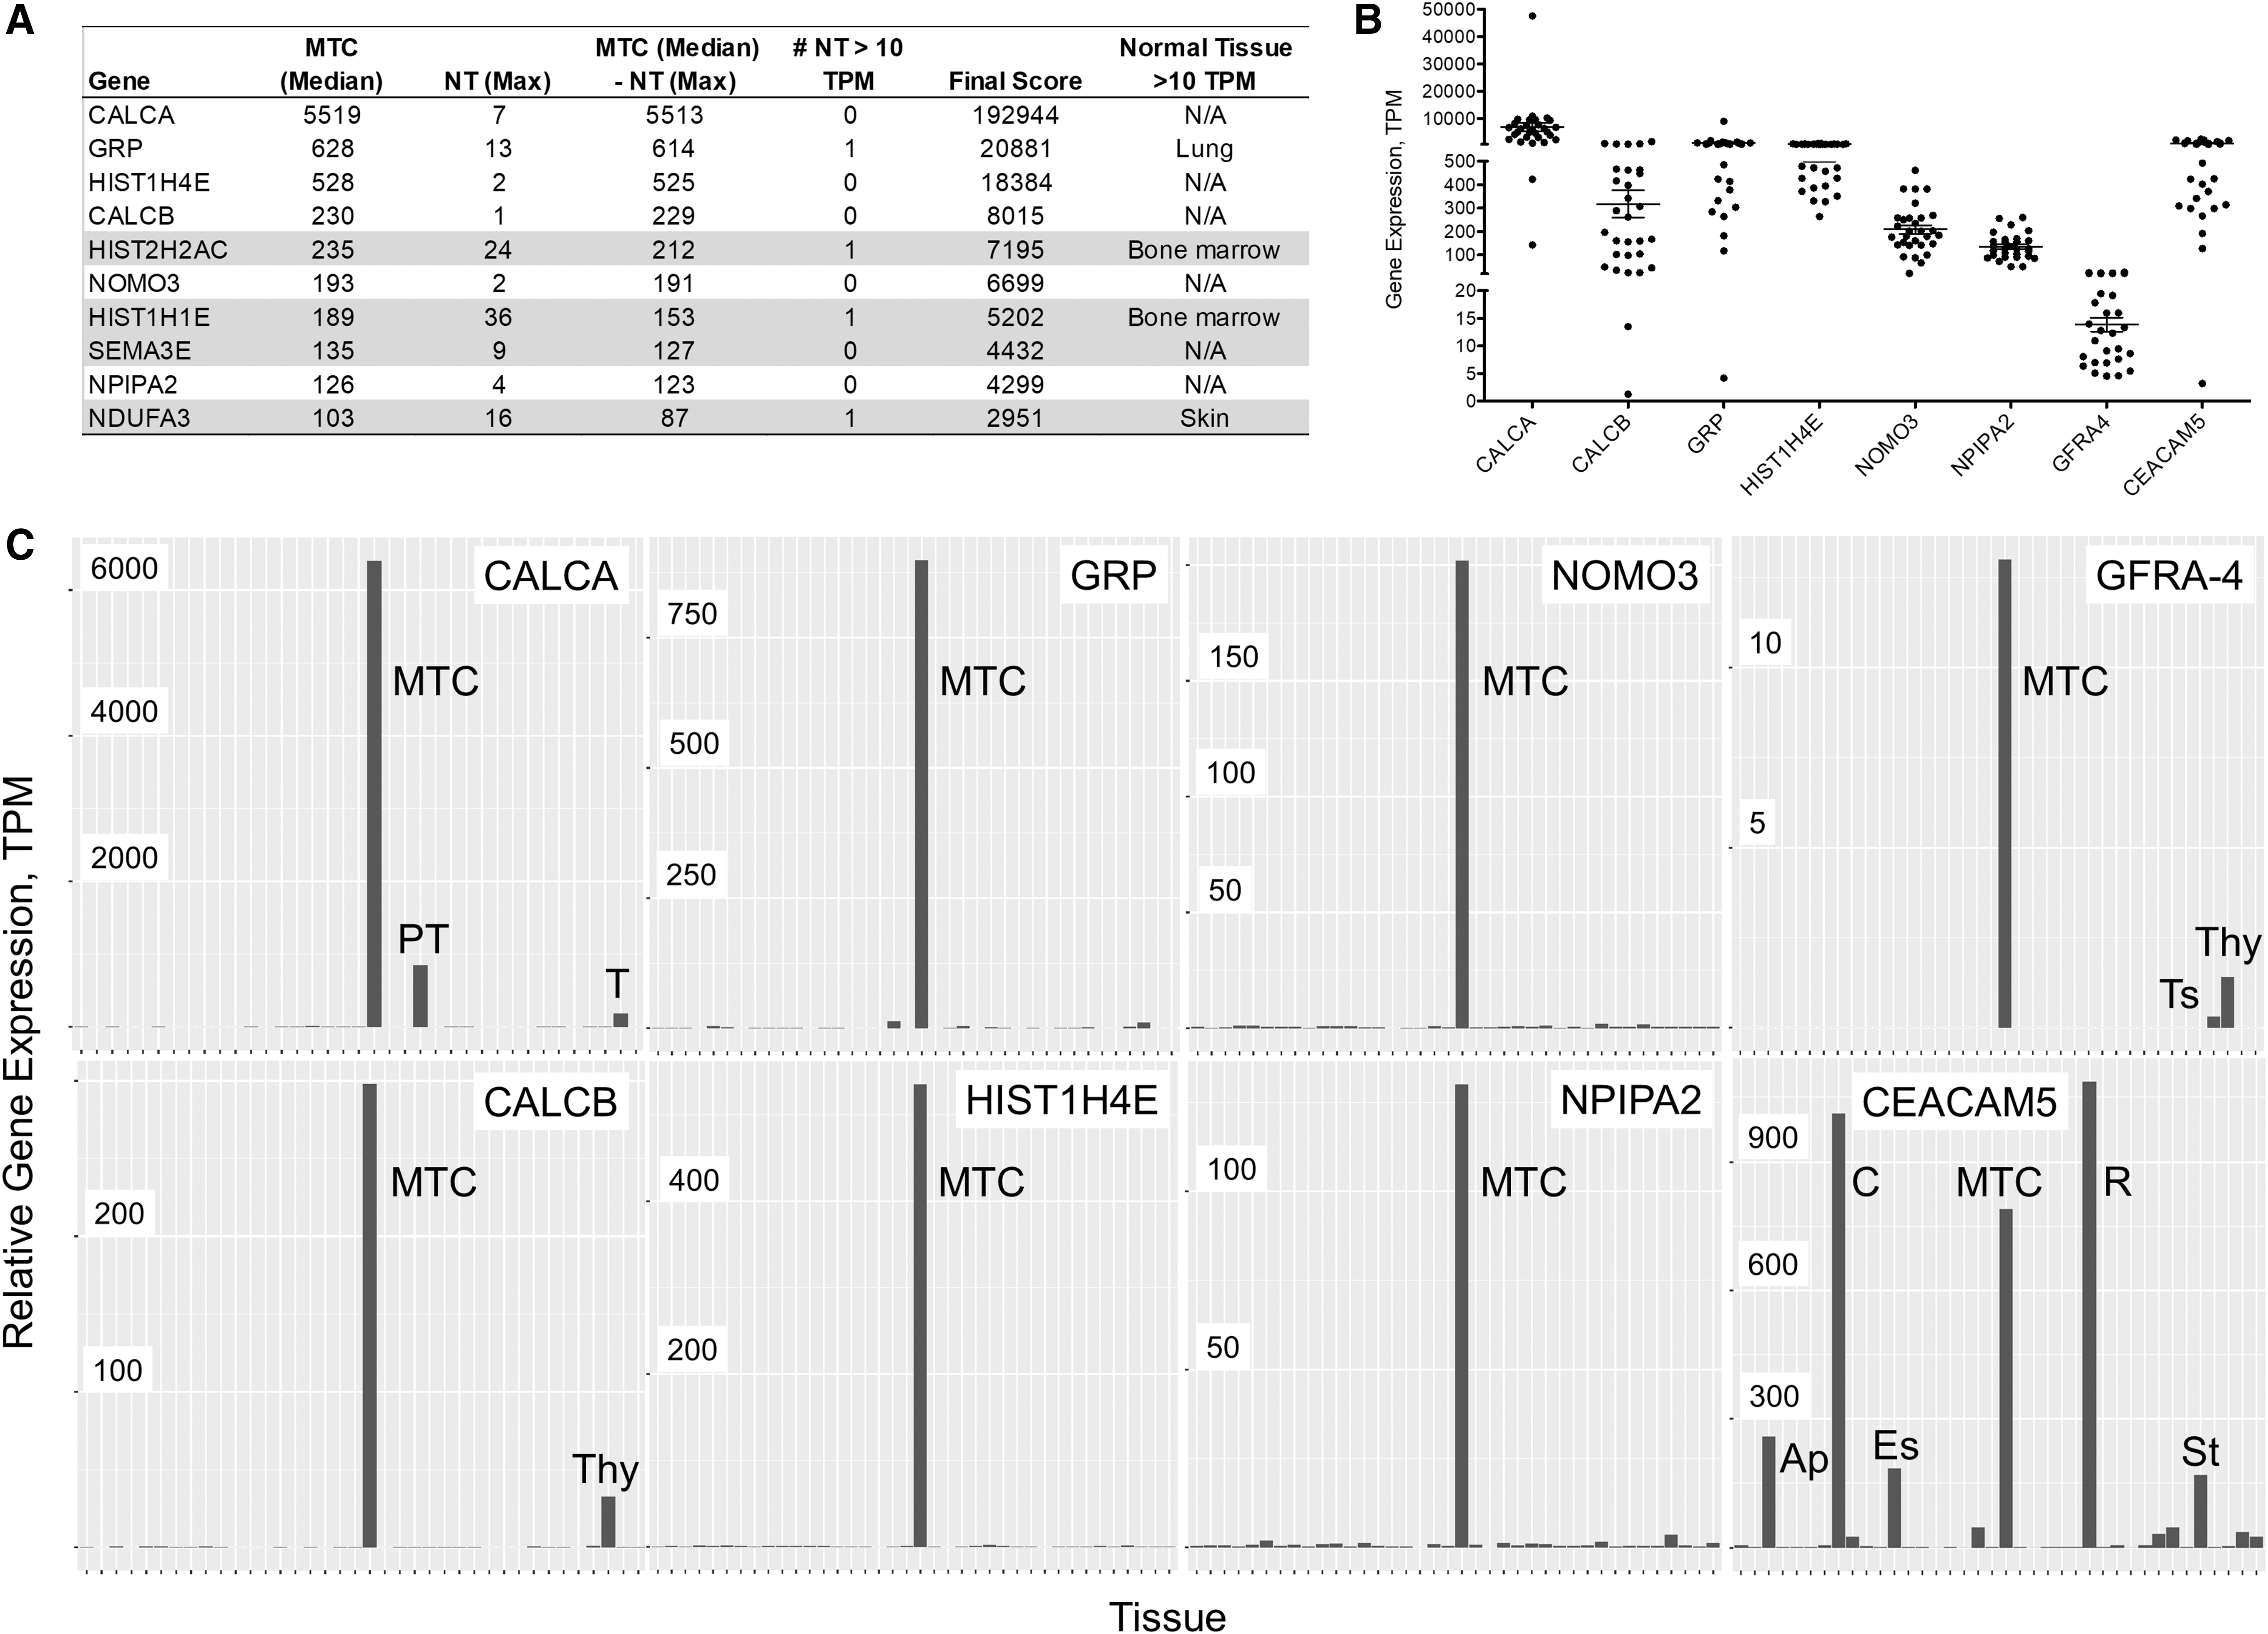
Highly expressed genes in MTC. The top 10 highly expressed genes are shown with the values used to generate the final score (
Histones HIST2H2AC and HIST1H1E were deemed less viable candidates due to high expression (>10 TPM in bone marrow). Semaphorin 3E (SEMA3E) and NADH:Ubiquinone Oxidoreductase Subunit A3 (NDUFA3) were excluded from further consideration due to moderate (5–10 TPM) expression levels in multiple normal tissues (data not shown). GFRA4, the coreceptor for RET signaling, was previously proposed as a target for Chimeric Antigen Receptor (CAR)-T therapy (31). While GFRA4 is highly selective to the thyroid, its expression is relatively low, with many samples below 10 TPM (Fig. 7B, C). Thus, the therapeutic potential of this target remains to be determined.
Mutation landscape of MTC
MTC tumors were screened for the presence of known cancer mutations by using a targeted sequencing approach (Thyroseq v3) and RNASeq (Table 2). Most MTC had previously reported mutations in RET (M918T, C609Y, C611S, C634R/W), HRAS (G13R, Q61K/R), and KRAS (G12R/V) (14,32). The tumor of patient 17 had an HRAS G12R mutation, which was previously reported in 1 out of 108 patients (33). The RET mutations were most common (n = 28) and mutually exclusive with RAS mutations (n = 9), consistent with previous observations (14,33). The BRAF R642K (MTC09) mutation had low allelic frequency (2%) and is of unknown significance. The MET R988C mutation (MTC33) was clonal (44% allelic frequency) and has been reported in colorectal, lung, HNSCC, and pheochromocytomas (34).
Mutation Summary and Clinical Parameters
Patient-matched primary thyroid and TILN or rTILN are highlighted in gray. Allelic frequency of each mutation is noted in parentheses.
Mutations in well-defined MTC oncogenes were reported by the patient.
MTC, medullary thyroid cancer; NT, not tested.
Mutations in TP53 were identified in MTC32 (M160I and P359S, 5–6% allelic frequency) and MTC41 (Y87C, 78% allelic frequency), both of which developed aggressive pT3 and pT4a primary tumors, lymph node metastases, and showed residual metastatic disease after therapy. Of interest, single-nucleotide variants in MSH6 (G1609C) and MSH2 (T568P) were identified in the primary tumor from MTC50, which had no classic oncogenic mutations in RET and RAS. The metastatic tumor from MTC41 also harbored a mutation in MSH6 (K473N). Frameshift mutations in MSH6 were identified in MTC09 (c3242_3243del:p.L1081fs) and MTC36 (c.249_250del:p.A83fs) that are predicted to result in truncated versions of MSH6.
Discussion
This study is the first detailed assessment of the immune milieu in MTC. Previous analysis of the immune infiltrate was limited by random sampling of five intra-tumoral and five peri-tumoral regions, which may not accurately approximate the heterogenous immune infiltrate in these tumors (35). A recent study investigating PD-L1 expression in MTC noted that immune infiltration was sparse, but no analysis was shown (36). Our data suggest that the presence of an immune infiltrate is much more common in patients with MTC than has been previously appreciated. These findings are not surprising given the clinical responses that have led to current clinical trials investigating immune-based approaches for MTC. These data support further investigation of immune-based therapies for MTC, and caution against labeling tumor “hot” or “cold” based on analysis of a single tissue section.
Both MSI and RNA expression profiling techniques are now commonly used for immune profiling studies. We specifically investigated whether immune profiling with IHC and RNASeq would yield comparable results. Our study revealed only a weak correlation (Fig. 5) between two methods. ImmSig T cell and macrophage signatures did not correlate with corresponding cell frequencies determined by MSI (data not shown). This may be explained by differences in sampling. In MSI analysis, we selected regions with an evident immune infiltrate, which included PT and IT aggregates. RNASeq data were generated from tumor tissue microdissected from normal tissue and would have variably included the PT immune infiltrate. Further, the frequency of each immune cell type by MSI was determined within the regions of the tumor that was chosen for high-resolution imaging, whereas RNASeq expression data is an aggregated analysis for the entire dissected tumor mass.
To facilitate comparable analyses of these methods, we would recommend imaging the entire tumor area to generate a more accurate estimate of cell frequency. This approach would be expensive and labor intensive in the analysis. Another major variable to these analyses is that the immune infiltrate may vary significantly between tissue sections. RNASeq analysis from multiple tissue sections may provide a more representative assessment of the heterogenous tumor; however, this approach does not provide single-cell phenotypic analysis and spatial information. Based on these studies, a combined approach including in situ (MSI) and RNASeq is most ideal when profiling the immune response in heterogeneous tumor tissues.
The MSI analysis of the immune cell phenotype in MTC revealed that CD8 T cells were common among infiltrates. PD-1 expression on both CD8+ and CD4+ T cells was evident in 10 out of 46 patient samples, in primary and/or metastatic tumors. Additional studies are necessary to better characterize immune activation in MTC; however, PD-1 expression is likely a sign of antigen recognition and T cell activation. Co-expression of Tim-3 is commonly observed in an exhausted population of PD-1+ T cells (37). Tim-3 expression was low and co-expression with PD-1 was rare in these tumors. Further, MHCII expression by lymphocytes (Supplementary Fig. S4) may be indicative of activated B and/or T cells.
Collectively, our study suggests that the T cell response in MTC occurs early in development and has not yet undergone exhaustion. In support of this hypothesis, immune expression profiling in the majority of tumors with intra-tumoral aggregated leukocytes (TAL3–4) revealed an enrichment in genes associated with an inflammatory T cell response.
As expected, myeloid infiltrate was also common in MTC and may suppress the ensuing anti-tumor immune response. CD163+ putative M2 macrophages, which lacked expression of MHCII, were most frequent. CD33 expression was not only evident on CD163+ macrophages but also expressed by other cell types and in isolation. CD33 is known for its ability to inhibit FcγR1 signaling and may contribute to dysfunction in these myeloid cell subsets (27,38). A more complete characterization of mMDSC and gMDSC markers is necessary to fully define the role of MDSC in MTC. Further analysis of distant metastatic tumors is necessary to better understand the functionality of the immune response in patients with progressive disease.
Despite high levels of immune infiltrates in many MTC samples, PD-L1 expression was sparse (1–5% of tumor cells) and evident in only 32% of primary tumors and 29% of TILN. This finding is in line with a previous report that found that 1–5% of cells expressed PD-L1 in 4 out of 16 primary MTC samples (36). Of interest, CD155 was expressed by a subset of primary MTC and broadly expressed in metastatic MTC. CD155, also known as the polio virus receptor, is commonly overexpressed in cancers (e.g., glioma, glioblastoma, breast, and colorectal cancers) and has been exploited for targeted infection by the oncolytic polio:rhinovirus chimera (PVSRIPO) in glioblastoma (39,40).
CD155 is now well characterized as an immunoregulatory molecule that has dual effects supporting or inhibiting CD8+ T cell cytotoxicity through binding to the costimulatory molecule CD226 or the coinhibitory receptors TIGIT and CD96 (41). Additional studies are necessary to assess the expression of TIGIT and CD96 by infiltrating T cells in MTC. Several strategies are currently under investigation to target CD155 in cancer therapy. These data suggest that CD155 may be a source of immune evasion in MTC and could be targeted in combination with other immune checkpoint blockades.
CD47, or IAP (integrin-associated protein), provides an inhibitory “don't eat me” signal to phagocytic cells through binding to SIRPα. CD47 was variably expressed in primary and metastatic MTC. Antagonistic antibodies that block this interaction are currently under clinical investigation and may enhance antibody-dependent cell-mediated cytotoxicity (ADCC) therapies (i.e., anti-CD20; rituximab) (42). Of interest, CD56 (NCAM, neuronal cell adhesion molecule) is commonly expressed by MTC (43). Pre-clinical studies with anti-CD56/anti-CD47 have shown promise in small cell lung cancer xenograft studies (44). A similar approach could be taken with anti-CEA antibodies (e.g., Labetuzumab) given that CEA is highly expressed in most primary and metastatic MTC cases.
Adoptive T cell therapies and vaccine strategies for cancer are continually evolving and improving. CAR T cell technologies have shown some promise for solid tumors; however, a number of challenges remain, including acquired resistance, cell persistence, immune suppression in the tumor microenvironment, and autoreactivity (45). The CEA is the most viable CAR-T cell target for MTC, given that it is highly expressed in a large majority of patients. Of note, CEA expression in MTC is similar to that observed in colon (Fig. 7). CEA-specific CAR-T cells have been studied in gastrointestinal cancers and have shown short-term efficacy in some patients (i.e., stable disease) (46). CEA is also expressed in GI and lung tissue; thus, on-target off-tumor adverse events are of concern.
In early studies using CEA-specific CAR-T therapies for gastrointestinal tumors, colitis and respiratory events were minimal (46). These data sharply contrast with the severe colitis observed with an anti-CEA transgenic TCR approach in colorectal cancer (47). Reduced side effects with CAR-T cell therapies may be due to localized expression of CEA on the luminal surface of epithelial cells (46). This hypothesis would support preferential targeting of tumor cells with diffuse membrane expression over normal epithelium with only apical expression. Patients with CEA+ MTC should be considered for further investigation of CEA CAR-T cell therapies.
The RET co-receptor GFRA4 has been proposed as a potential CAR-T cell target for MTC (31). Our data confirm that GFRA4 is highly tumor specific and that mean expression is elevated over the normal thyroid (Supplementary Fig. S6). Further studies are necessary to confirm protein expression in these patients given that RNA expression was quite low in many samples.
Our studies revealed that 80% of MTC retain expression of MHCI, which is required for peptide antigen presentation to tumor-specific T cells. While these results are encouraging, analysis of distant metastases is necessary to fully predict tumor antigenicity in advanced disease. CEA vaccine studies in MTC (NCT01856920) will inform future studies targeting this, and other, TAA.
Cancer-testes antigens (CTA) were expressed in a small subset of patients with MTC. Of interest, metastatic tumor (TILN) from MTC18 and MTC41 were positive for CTAG1B by both protein and RNA analyses and expressed RNA for multiple genes in this family (Fig. 6). These patients may benefit from personalized vaccine strategies targeting multiple CTA (48).
Expression analysis of MTC compared with normal tissues identified a small number of potential intracellular/secreted TAA in MTC. Calcitonin encoding genes, CALCA and its paralog, CALCB, known to be selectively expressed in MTC, are small molecules (127–141 amino acids [aa]) with limited antigenic potential. GRP and HIST1H4E (histone cluster 1 H4 family member E) were also highly specific to MTC but both are relatively small molecules (148aa and 103aa, respectively) that may be difficult to target. NOMO3 (nodal modulator 3; 1222 aa) and NPIPA2 (nuclear pore complex interacting protein family member A2; 350 aa) may have higher potential for antigenic peptides. Future studies are necessary to investigate the MHC binding potential and antigenicity of these molecules in patients with advanced MTC.
Mutation analysis in this cohort of MTC identified common mutations that could be targeted as neoantigens. RNASeq was used in parallel to targeted ThyroSeq analysis to broadly identify novel mutations; however, the efficacy of this approach for identifying novel mutations was limited by artifacts induced by FFPE processing and the lack of a normal tissue control. We identified, for the first time in MTC, 2 patients with alterations within MSH6 and MSH2 genes. Analyses with fresh tissue are necessary to better assess mutation burden in such tumors and whether these patients would be good candidates for immune checkpoint blockades based on their microsatellite instability status.
As expected, point mutations in RET and RAS were commonly identified. Additional studies are required to determine the immunogenicity of these potential neoantigens. Adoptive T cell therapies using transgenic TCR that recognize common mutations in KRAS G12D and KRAS G12V are gaining momentum with enhanced screening methods to identify reactive T cells in patients (49,50). Patients with progressive MTC who do not respond to targeted TKI therapies and express mutant forms of RAS or RET could be considered for this approach.
A large body of research has investigated the effects of specific oncogenes on tumor antigenicity and immune suppression (51 –54). Expression profiling studies using NIH-3T3 cells transformed with RET mutants revealed that expression of C609Yand C634R, but not M918T and Y791F, was associated with an anti-tumor immune profile (55). While our studies failed to show a statistically significant correlation between mutation type and immune infiltrate (Fig. 1C and Supplementary Fig. S6), additional studies with a larger number of RAS and non-M918T RET mutants are necessary to confirm our findings. Recent studies suggest that RET inhibitors elevate MHC expression and enhance antigenicity in tumor cells driven by RET oncogenes (56). Thus, therapeutic approaches that combine RET inhibition with immune checkpoint blockades may show more efficacy than single-agent approaches for MTC. Similarly, early studies targeting BRAF and RAS in combination with PD-1 or PD-L1 blockades have shown promise in anaplastic thyroid cancer (57).
In conclusion, this study is the first to thoroughly investigate the immune response and antigenic potential in MTC. Our data suggest that MTC can be an immunologically active tumor and that a subset of patients may benefit from immune-based treatment strategies. Future studies investigating immune checkpoints and tumor antigenicity in MTC may greatly expand the available therapies for these patients.
Footnotes
Acknowledgments
We thank the Human Immune Monitoring Shared Resource (HIMSR) within the University of Colorado Human Immunology and Immunotherapy Initiative for their expert assistance in the development and acquisition of the multispectral immunohistochemistry images. We are grateful to the patients who donated their time and tissue for this study.
Author Disclosure Statement
No competing financial interests exist.
Funding Information
This work was funded through the Research Education Action Cancer Thyroid (REACT) foundation, a pilot grant from the University of Colorado Cancer Center Cancer (UCCC), and Mary Rossick Kern and Jerome H. Kern Endowment in Endocrine Neoplasms Research. This work was supported, in part, by the Molecular Pathology Shared Resource of the University of Colorado (NCI Cancer Center Support Grant P30-CA046934) and the University of Colorado Cancer Center's Genomics and Microarray Core Shared Resource (NCI grant P30CA046934).
Supplementary Material
Supplementary Figure S1
Supplementary Figure S2
Supplementary Figure S3
Supplementary Figure S4
Supplementary Figure S5
Supplementary Figure S6