
Abstract
Background:
Current classification systems for thyroid nodules are very subjective. Artificial intelligence (AI) algorithms have been used to decrease subjectivity in medical image interpretation. One out of 2 women over the age of 50 years may have a thyroid nodule and at present the only way to exclude malignancy is through invasive procedures for those that are suspicious on ultrasonography. Hence, there exists a need for noninvasive objective classification of thyroid nodules. Some cancers have benign appearance on ultrasonogram. Hence, we decided to create an image similarity algorithm rather than image classification algorithm.
Materials and Methods:
Ultrasound images of thyroid nodules from patients who underwent either biopsy or thyroid surgery from February 2012 to February 2017 in our institution were used to create AI models. Nodules were excluded if there was no definitive diagnosis of it being benign or malignant. A total of 482 nodules met the inclusion criteria and all available images from these nodules were used to create the AI models. Later, these AI models were used to test 103 thyroid nodules that underwent biopsy or surgery from March 2017 to July 2018.
Results:
Negative predictive value (NPV) of the image similarity model was 93.2%. Sensitivity, specificity, positive predictive value (PPV), and accuracy of the model were 87.8%, 78.5%, 65.9%, and 81.5%, respectively.
Conclusions:
When compared with published results of ultrasound thyroid cancer risk stratification systems, our image similarity model had comparable NPV with better sensitivity, specificity, and PPV. By using image similarity AI models, we can decrease subjectivity and decrease the number of unnecessary biopsies. Using image similarity AI model, we were able to create an explainable AI model that increases physician's confidence in the predictions.
Introduction
Ubiquitous use of imaging modalities for evaluation of various medical conditions leads to the discovery of incidentalomas. Being present in more than half of women >50 years of age, thyroid nodules are common incidentalomas. Analysis of Medicare data (1) showed that thyroid ultrasound as the initial imaging modality in the cohort has risen by 20.9% year over year.
Current classification systems for thyroid nodules are labor intensive and are subjective (2). The most common systems used to classify thyroid nodules are Thyroid Imaging Reporting and Data System (TIRADS) by American College of Radiology (ACR) and American Thyroid Association (ATA) classification system (3,4). These systems are fraught with problems. Varying results can be seen when different classification systems are used to assess the same thyroid nodule (5). The ability to make a useful distinction especially by less experienced users is limited by the inherent subjectivity and the inter- and intrareader variability of these visual classification systems. Using the mentioned systems, follicular carcinomas, Hürthle cell cancer, and follicular variant of papillary thyroid cancer may end up being classified as benign (6). Not all nodules can be classified using all available systems. These classification systems also lack specificity and have low positive predictive value (PPV) (7). This results in unnecessary biopsies. Millions of thyroid biopsies are done every year all over the world. It was estimated that in 2015, >600,000 fine needle aspirations (FNAs) were done in the United States alone (8). Evaluation of the increasing number of benign thyroid incidentalomas is increasing the burden on the health care system.
Even when FNA biopsy of the thyroid is performed, it does not always yield a definitive result. A final diagnosis cannot be made in one out of seven nodules with FNA (9). Molecular markers were developed to avoid surgery for benign nodules with indeterminate FNA. The PPV for these molecular tests varies between 20% and 50% (9,10). Many times, a repeat biopsy may be required to do molecular markers. All of this adds to the health care expense without improving morbidity or mortality. Therefore, at present, we do not have a reliable nonsubjective method for avoiding invasive procedures for benign thyroid nodules.
Similar problems exist in other medical domains, and artificial intelligence (AI) algorithms have provided solutions. There is Food and Drug Administration (FDA) cleared AI software to diagnose diabetic retinopathy, stroke, and breast lesions (11 –14). AI algorithms have been used to classify thyroid nodules objectively (15 –18). AI image classification algorithms for thyroid nodules give a single output, benign or malignant without any supporting evidence regarding how it reached that conclusion. Predictions from these algorithms are not generally explainable, hence they are called black box algorithms. In clinical practice, explainable or interpretable deep learning models are needed to gain the trust of physicians (19). Because of these shortcomings, we decided to create an image similarity AI model instead of a classification model. An image similarity algorithm will output images similar to the test image with corresponding diagnosis.
In this article, we describe the creation of an image similarity deep learning algorithm for thyroid nodule risk stratification.
Materials and Methods
The research study was approved by the Mercy Institutional Review Board.
Image database
Ultrasound images of thyroid nodules from patients who underwent either FNA biopsy or thyroid surgery from February 2012 to February 2017 at Mercy Endocrinology Clinic or Mercy Hospital in Springfield, Missouri, were initially collected for the study. Cytology and histopathology examinations were done at the Mercy hospital by one group of pathologists. Cytopathology was reported using the Bethesda system (20).
Nodules were excluded if there was no definitive diagnosis of it being benign or malignant or if there were no good quality thyroid ultrasound images. Images used in the study came from ultrasound machines manufactured by GE, Siemens, Philips, and Sonosite. Ultrasound images were obtained using frequency ranging from 8 to 13 MHz. A total of 482 nodules from 402 patients met the inclusion criteria. The area of interest was cropped from the ultrasound images along with some neighboring tissue. Both sagittal and transverse view images were used. All available images for a nodule meeting inclusion criterion were used. This image set served as the training database. The testing imaging dataset was created in a similar retrospective fashion by collecting ultrasound images of patients with thyroid nodules who underwent biopsy or surgery between March 2017 through July 2018. There were 103 thyroid nodules obtained from 89 patients in the testing data set.
Convolutional neural network model
Convolutional neural networks (CNNs) with 18 layers to 152 layers were created and evaluated on our database. Increasing layers >34 did not increase the performance of the model. Hence, a 34-layered CNN—ResNet 34 was trained on thyroid ultrasound images of 482 thyroid nodules using transfer learning techniques (21). All images were resized to 224 × 224 pixels before being fed into the CNN. Image embeddings for these ultrasound images were obtained by taking the output before the final fully connected layer and stored in a database. Embeddings are N dimensional vectors representing one unique image. When a query image is received, it is first converted to image embeddings using the CNN. Embeddings from the input image are used to find embeddings that are similar to those from our training image database using a nearest neighbor algorithm. Finally, N number of nearest neighbors will be displayed as the output along with the label of the image. Figure 1 depicts the schema of image similarity algorithm.
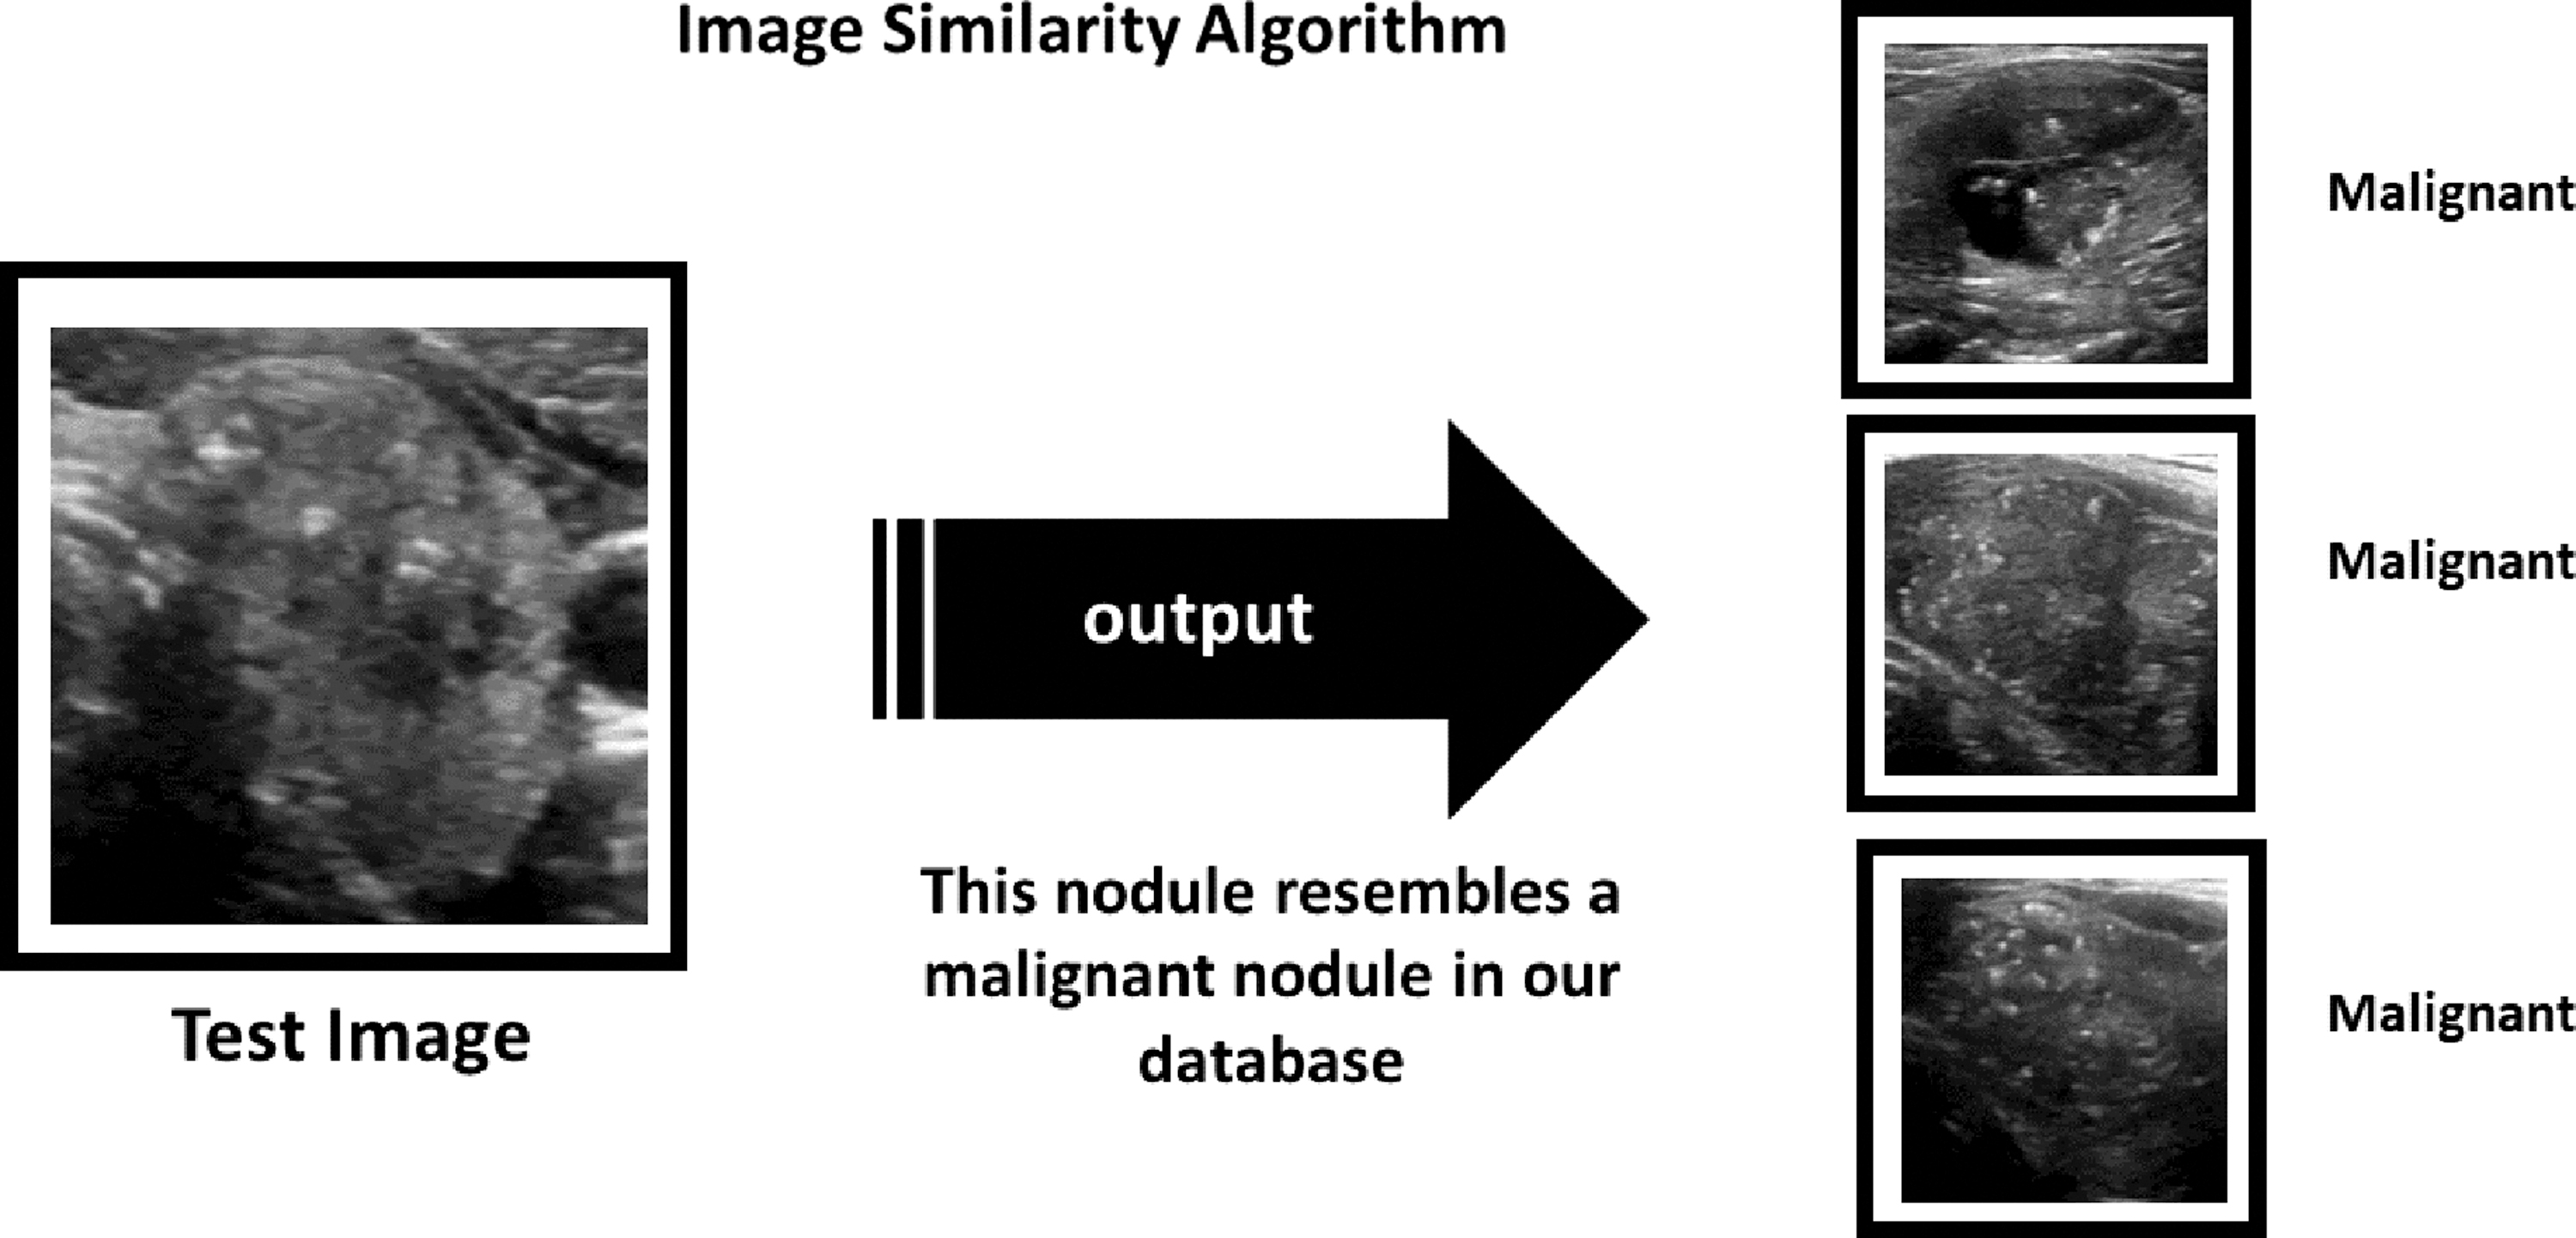
Schema of image similarity algorithm. Image similarity algorithm will output N number of images similar to the test image from the training data set.
Scoring the algorithms
In phase 1, image classification algorithms were used. The ResNet 34 model trained on 482 nodule images was used to classify test images. The algorithm returned a prediction for the test image as either benign or malignant. In phase 2, each of the test images were fed through the image similarity algorithm, AIBx. Image embeddings were created and the first nearest neighbor/similar image from our training data set was identified. If the nearest neighbor for a benign test image is a benign nodule from the training database, it was considered a true negative. If the algorithm outputs a malignant nodule as the similar image for a malignant nodule in the test set, it was considered a true positive. Opposite was true for false negative and false positives, respectively.
Statistical methods
A confusion matrix was created from the true positives, true negatives, false positives, and false negatives in both phases. Python programming language was used to calculate accuracy, sensitivity, specificity, PPV, and negative predictive value (NPV).
Results
The training data set consisted of 2025 images from 482 nodules. These included images with and without square aspect ratio (same length and breadth). Testing set had 103 images from 103 nodules. Image depicting the largest dimension of the nodule was used in the testing set as the representative image. Training and testing set had 66 and 33 malignant nodules, respectively. Of the training set, 6% were subcentimeter nodules. All of the testing nodules had at least one dimension >1 cm. The majority of the nodules in both groups underwent surgery, 67.6% (326 nodules) in the training group and 61% (62 nodules) in the testing group.
Of the 482 nodules in the training set, 156 nodules had a benign FNA cytologic diagnosis and did not undergo surgery. All nodules included in the study with a cytological result of Bethesda categories I, III, IV, V, and V1 underwent surgical excision. Twenty-two nodules were Bethesda category I, and 3 (13.6%) of these nodules were malignant. There were 43 nodules in Bethesda category III, and 16 (37.2%) of these nodules were malignant. Of the 11 nodules in category IV, 2 (18.1%) were malignant. Sixteen nodules had an FNA diagnosis suspicious for malignancy (category V) and 12 (75%) turned out to be malignant. Thirteen nodules had a cytological diagnosis of malignancy (category VI) and all of them were malignant on histopathological examination. Prevalence of cancer in the training data set was 13.7%. Of these malignant nodules, 56 were papillary thyroid cancer, 17 were follicular variant of papillary thyroid cancer, 6 were follicular thyroid cancers, and 4 were Hürthle cell cancers. The training set did not contain nodules with medullary thyroid cancer.
In the testing set, there were 103 nodules. Sixty-six nodules had histopathologic diagnosis, the rest of the nodules had benign cytologic diagnosis and did not undergo surgery. The distribution of indeterminate Bethesda categories in nodules that underwent surgery is as follows, in category I there were 8 nodules, 4 (50%) of them were malignant. Three out of five (60%) nodules in category III were malignant. None of the four nodules in category IV was malignant. Out of the eight nodules with a cytologic diagnosis of category V, 6 (75%) were malignant. All of the six nodules under category VI turned out to be malignant. Prevalence of malignancy in the testing set was 32%. There were 24 papillary thyroid cancers in the test set, of which 3 of them were follicular variant of papillary thyroid cancer. Three of the malignant nodules were follicular thyroid cancers and four were Hürthle cell cancers. There were two nodules with medullary thyroid cancer.
Phase 1
Image classification using ResNet 34 model resulted in an accuracy of 77.7%. Sensitivity, specificity, PPV, and NPVs were 84.9%, 74.3%, 60.9%, and 91.2%, respectively. The average time for prediction was 30 milliseconds per image. Heatmaps were generated for each test image to identify the area of interest for the algorithm.
Phase 2
When the image similarity model was used to classify test images, accuracy was 81.5%. The sensitivity, specificity, PPV and NPV of the model was 87.8%, 78.5%, 65.9% and 93.2%, respectively. Average time for prediction was 900 ms. Similar images for test images were displayed along with their diagnosis.
On using the image classification algorithm generated in phase 1, 55.3% of the nodules were determined to be benign. When the image similarity algorithm was used, 57.3% of the nodules were determined to be benign. Hence, using image similarity algorithm will avoid more biopsies. When results of phase 1 and phase 2 were compared (Table 1), image similarity algorithm turned out to be superior.
Results of Classification and Image Similarity Algorithms
NPV, negative predictive value; PPV, positive predictive value.
Discussion
One of the main challenges in the management of thyroid nodules is risk stratification. An experienced physician generally evaluates an ultrasound image and arrives at a decision regarding biopsy based on his or her previous experience and heuristics. Most have a mental picture of how a malignant thyroid nodule should appear. We tried to emulate this by creating an image similarity CNN model. While the repertoire of representative images stored in physicians' mind is limited by their experience and memory, AI models can store unlimited images and query it millions of time.
Multiple AI models have been developed for thyroid nodule classification, but none of them are widely used (16 –18). A recent study by Buda et al. suggested that machine learning algorithms could match the performance of radiologists in classifying thyroid nodules (15). When tested on 99 nodules, their model achieved a sensitivity of 87% and specificity was 52%. This was comparable with the performance of 3 ACR-TIRADS committee members and 9 other radiologists (15). Most image classification algorithms used in the risk stratification of thyroid nodules are black boxes. Therefore, we cannot readily explain why an algorithm yielded the wrong classification of a thyroid nodule.
Deep learning algorithms may make predictions based on nonmedically relevant information present in the images. Winkler et al. demonstrated that having gentian violet surgical skin markings in dermoscopic images increased the chance of melanoma prediction by an algorithm (22). Images obtained from different imaging machines will have different features. This can act as a confounding factor while creating deep learning algorithms. For example, if pneumonia is more common in X-rays obtained in the emergency room (ER) than in those obtained in the surgical ward, then there is an increased probability of false positives on X-rays performed in ERs. Algorithms created in one institution may underperform when used in another institution. AI models may overlook the actual pathology and instead may rely on other clinically nonrelevant features in the image such as placement of a metallic token to mark laterality (23).
Heatmaps have been used to explain outputs of image classification. But this approach did not help with thyroid nodule classification. Figure 2A depicts a benign cystic nodule. Image classification algorithm correctly classified it as a benign nodule. The corresponding heatmap in Figure 2A shows that the algorithm is focusing on the cystic area and the posterior enhancement to arrive at the diagnosis. Figure 2B depicts a malignant thyroid nodule. This was classified as a benign nodule by image classification algorithm. But the heatmaps do not help us to understand the rationale behind this prediction.

Explainable AI models will increase the trust of physicians and will foster adoption of these systems into clinical practice (19). AI health care team from Google created an image similarity model (SMILY) to help diagnose histopathology images (24). Given a histopathology image, SMILY can output images with similar histological features. They suggested that this approach could also inform us about the outcomes of patients with similar pathology.
To our knowledge, there is no published study on the use of image similarity models for the classification of thyroid nodules. Unlike other AI algorithms, our image similarity model, AIBx, uses physician in the loop, Figure 3. During each stage of AIBx, physicians have an active role. Operating physicians will select the image to be fed into AIBx. AIBx will output N number of similar images as requested by the user along with a classification. Physicians can verify the diagnosis by reviewing similar images and then accept or reject the classification provided by AIBx. This could also be used to retrieve all available information for a nodule including diagnosis, molecular markers, treatment received, and recurrence status. AIBx is designed as a decision support tool. Our goal is to enhance physician's decision-making process and not to replace it.
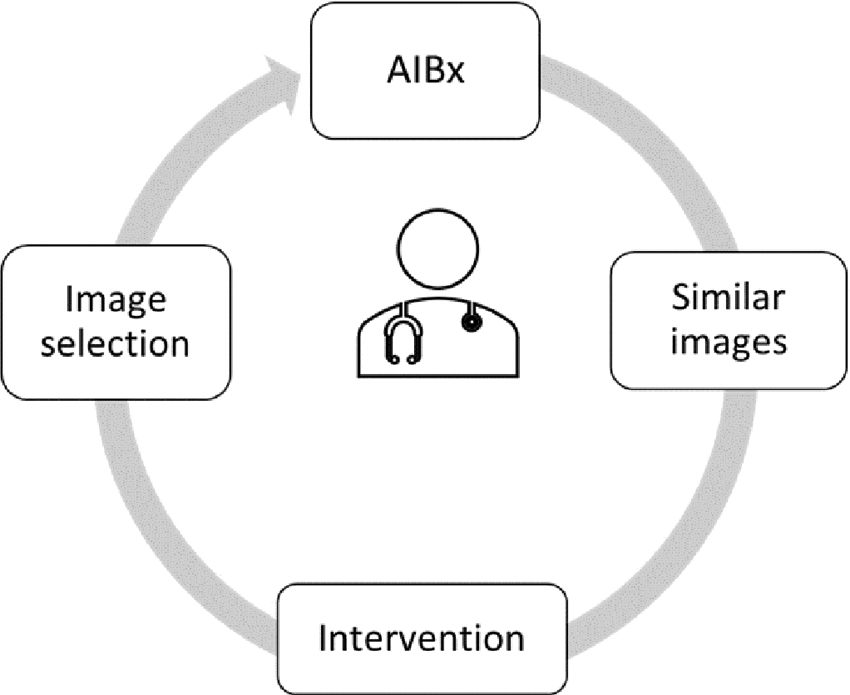
Physician in loop. Operating physician is involved in each step of AIBx. Physician selects the image and image window to be analyzed. Once AIBx outputs similar images, a physician will compare them to the test image and finally decides whether to accept to reject the output of AIBx. AI, artificial intelligence.
If an AI classification algorithm misclassified an image, adding this image back to the database and retraining the AI model may not result in the correct classification. Hence, retraining the classification model again with incorrectly classified images may not always result in better prediction of the misclassified images. However, a properly trained image similarity model has a high chance of reclassifying the image correctly if embeddings of the misclassified image are added to the database. Therefore, an image similarity model does not have to be retrained to increase accuracy.
False negative set had 3 papillary thyroid cancers and 1 Hürthle cell cancer. Among the false negative papillary thyroid cancers, one was follicular variant and another one was cystic papillary thyroid cancer. Based on this, it does not seem like the model is favoring one type of malignancy. AIBx can easily be incorporated into current physician workflow. Any ultrasound machine with an image output port can wirelessly transmit the image of interest to a nearby mobile computing device where it can be classified using the algorithm. If this method is used, data never leave the health care facility. AIBx can also be deployed as a local or remote website. Furthermore, the system could also be used as a teaching tool for residents and fellows.
Image similarity algorithms can consume more computing resources and time than classification algorithms. But the difference was <1 s for AIBx when compared with phase 1 image classification algorithm. The test data set only had 103 images. It is possible that a larger test set may yield different results. NPV and PPV should be interpreted relative to prevalence of disease in the test set. Prevalence of malignancy in our test set was 32% and this is greater than the prevalence of thyroid malignancy in the general population. Images acquired from an ultrasound machine other than the machines used in this study may not produce the correct response. However, this could be verified by the physician comparing similar images generated by AIBx with the test image. AIBx used images from ultrasound manufacturers frequently used in clinical settings, including GE, Philips, Siemens, and Sonosite. During testing, AIBx retrieved images from ultrasound machines other than that from the test image, partly alleviating these concerns. All nodules in our database did not undergo surgical excision. But, false negative rate for cytologically benign nodules in our institution is 1.7%. Most thyroid nodules evaluated by FNA or surgery may have worrisome features, and nodules that were not biopsied and/or surgically removed may have a benign appearance. As such, there could be underlying selection bias in our database. Since most of the nodules in our test database measured between 1 and 4 cm, we believe that our model is best applied to nodules with similar sizes.
A study by Grani et al. applied ACR-TIRADS, ATA, AACE, EU-TIRADS, and K-TIRADS classification systems to 502 nodules and reported that 11 malignant nodules would have been classified as not requiring biopsy by at least one of these systems (4,7,25 –28). The ATA system could not classify some of the nodules (7). This study shows the variability in classification systems even with experienced physicians. According to this study, ACR-TIRADS performed better and recommended the lowest number of biopsies. The PPV and NPV for ACR-TIRADS was 12.8% and 97.8% respectively. In another study by Ahmadi et al., NPV for both ATA and ACR-TIRADS was 90% (29). Thyroid cancer has 98.2% 5-year survival rate and low morbidity (30). Combined with the practice of active surveillance for low-risk thyroid cancer by many centers, a system with >90% NPV will be helpful in avoiding unnecessary biopsies without increasing morbidity or mortality (31).
Millions of thyroid biopsies are done every year based on very subjective criteria to find thyroid cancer in a very small percentage of population with an invasive technique, which may not be diagnostic 1 out of 7 times. In this study, we described an image similarity algorithm based on deep learning for thyroid nodule risk stratification. When compared with published results of ACR-TIRADS and ATA classification system, AIBx, the image similarity model had comparable NPV with better sensitivity specificity and PPV. By using image similarity AI models, we can decrease subjectivity and decrease the number of unnecessary biopsies. This algorithm may also aid in the management of indeterminate and nondiagnostic thyroid nodules. Using image similarity AI model, we were able to create an explainable AI model that encourages physician's confidence in model predictions.
Footnotes
Acknowledgment
We thank Mercy Research for facilitating the study.
Authors' Contributions
Concept, coding, image collection, and statistical analysis were performed by J.T. T.H. helped in creating the study protocol and edited the article.
Author Disclosure Statement
No competing financial interests exist.
Funding Information
No funding was received for this research.