
Abstract
Background:
Congenital hypothyroidism (CH) is a common and preventable cause of mental retardation, which is detected in many neonatal screening programs. Upon suspicion of CH, plasma free thyroxine (fT4) and thyrotropin (TSH) concentrations are measured. CH can be of thyroidal or central origin (CH-T and CH-C, respectively). While CH-T diagnosis is based on an elevated TSH with a low fT4, CH-C diagnosis is based on a low fT4 without a clearly elevated TSH. Currently, reliable neonatal reference intervals (RIs) for plasma fT4 and TSH are lacking. Age-specific RIs would greatly improve the diagnostic process for CH, especially for CH-C. Our aim was to establish neonatal RIs for plasma fT4 and TSH in term neonates at day 3–7 (t = 1) and day 13–15 (t = 2). The study was particularly designed to provide a reliable fT4 lower limit of the RI to facilitate the diagnosis of CH-C. In the Netherlands, neonates are screened at day 3–7 of life. After a screening result suggestive for CH-C, pediatric consultation takes place on average at day 14. Thus, the time points were chosen accordingly.
Methods:
Venous blood was collected from 120 healthy neonates at each time point (94 participants provided blood samples at two time points; 52 participants provided a sample at t = 1 or t = 2). fT4 and TSH were measured using an immunoassay (Cobas; Roche Diagnostics). RIs were calculated using the 95% confidence interval for normally distributed data and the nonparametric percentile method if data were not normally distributed.
Results:
From 146 participants (49% female), ≥1 measurement was available. Ninety-five percent RIs for fT4 were 20.5–37.1 pmol/L (day 3–7) and 15.3–26.5 pmol/L (day 13–15). Ninety-five percent RIs for TSH were 1.0–8.4 mU/L (day 3–7) and 1.4–8.6 mU/L (day 13–15).
Conclusions:
Our results indicate an fT4 lower limit of the RI of 20.5 pmol/L at day 3–7 and 15.3 pmol/L at day 13–15. These lower limits are considerably higher than this assay's lower limit of the adult RI for fT4. In case CH is suspected, we recommend measuring fT4 and TSH using an assay with an established neonatal RI, taking into account the child's age in days.
Introduction
Congenital hypothyroidism (CH) is thyroid hormone deficiency present at birth and is a common but preventable cause of mental retardation. Since its incorporation in many neonatal screening programs, early detection and treatment have greatly improved the prognosis of affected children (1,2).
After a neonatal screening result suspicious for CH, venous blood is collected to confirm or reject the diagnosis by measuring plasma free thyroxine (fT4) and thyrotropin (TSH). CH can be of thyroid (CH-T) or central origin (CH-C), caused by deficient hypothalamic–pituitary stimulation of the thyroid gland in the latter. While a CH-T diagnosis is based on a low fT4 combined with an elevated plasma TSH, the diagnosis of CH-C relies solely on a low fT4 concentration (3). However, reliable age-specific neonatal reference intervals (RIs) for fT4 and TSH are lacking, and diagnosing CH-C can be challenging (4 –6).
Early diagnosis of CH is important, especially since it may be the first step in uncovering multiple pituitary hormone deficiencies, present in the majority of CH-C patients (7). These additional pituitary hormone deficiencies, such as adrenocorticotropic hormone deficiency and growth hormone deficiency, are associated with life-threatening hypoglycemia and shock (8 –10). While pediatric fT4 and TSH RIs for various assays have been reported before (11 –14), only a few studies have included a sufficiently large number of neonates (15 –17). Moreover, blood collection was often performed throughout the entire neonatal period while the hypothalamus–pituitary–thyroid axis is still maturating in this dynamic phase of life (18,19).
The primary objective of this study was to establish reliable RIs for plasma fT4 and TSH concentrations in healthy, term neonates during the Dutch neonatal screening at day 3–7 and at day 13–15 (day of birth is day zero). This study was primarily designed to provide an fT4 lower limit of the RI to facilitate the diagnosis of CH-C. In the Netherlands, children with neonatal screening results suspicious for CH-C are seen by a pediatrician on average on day 14 of life; thus, the second time point was chosen accordingly (20). In addition, we studied whether demographic factors were associated with plasma fT4 concentrations.
Materials and Methods
Participants
Neonates were recruited by informing (future) parents using various approaches. Pregnant women were informed in several midwife practices in Amsterdam, and women scheduled for a cesarean section were informed during their hospital visit in the third trimester. Parents could also contact the researchers through a study website.
Term and healthy neonates were eligible to participate in the study. Study exclusion criteria for neonates were prematurity (gestational age <37 weeks), an Apgar score less than 7 at five minutes, cesarean section performed for fetal distress, and neonatal illness requiring hospitalization. Study exclusion criteria for mothers were thyroid or pituitary disorders and use of medication influencing neonatal thyroid function. To mimic population characteristics, a maximum of 20% of participants born through cesarean section was accepted. At the moment of preparation of the study protocol, 17% of neonates in the Netherlands were delivered with a cesarean section (21).
Written informed consent was obtained from all parents. The study protocol was approved by the Medical Ethical Committee of the Academic Medical Center Amsterdam, the Netherlands.
Sample collection
Venous blood collection was performed during home visits at two time points: day 3 to 7 (t = 1) and at the age of two weeks (day 13 to 15, t = 2). The time points represent two clinically significant moments (in the Netherlands): the neonatal screening and the moment a neonate with a screening result suspicious for CH-C is seen by a pediatrician (20). Parents were asked to participate at both time points, but participation during one time point was possible. If a time point was missing, another participant was recruited for replacement (total number of participants >120).
Blood samples were collected in a spray-coated lithium heparin serum separator tube (BD Vacutainer® PST™). If necessary, oral sucrose was offered as analgesic during venipuncture. Difficulties regarding blood collection, such as whether squeezing was necessary, were registered. Perinatal and demographic data, including race/ethnicity, were collected from all participants. To prevent dropout from the Dutch neonatal screening program, which had a participation rate of 99.2% in 2016 (22), neonates could be included only after the screening had been performed.
Biochemical analysis
Samples were centrifuged at 3000 g for 10 minutes within three hours after collection, using the Rotina 420R centrifuge (Hettich Lab Technology, Tuttlingen, Germany). Plasma was divided into aliquots and stored at −20°C until analysis. fT4 and TSH concentrations were measured using an electrochemiluminescence immunoassay (Cobas; Roche Diagnostics, Switzerland; adult RI for fT4 12–22 pmol/L and TSH 0.5–5.0 mU/L).
The Dutch neonatal CH screening program consists of a three-tier system, which has been described previously (3). In short, thyroxine (T4) measurement is followed by TSH measurement in the lowest 20% of that day's T4 concentrations (≤ −0.8 standard deviation [SD]), and measurement of T4-binding globulin (TBG) in the lowest 5% (≤ −1.6 SD). For all study participants, total T4 concentrations in dried blood spot (DBS) were measured in the context of the routine neonatal screening program, using an immunoassay (Perkin Elmer, MA) (3). If applicable, TSH concentrations were measured using the same immunoassay.
Statistical analysis
In total, 240 blood samples were obtained, consisting of 120 samples per time point, which is the recommended minimum to calculate valid RIs according to the National Committee for Clinical Laboratory Standards guidelines (23). Samples were obtained from 146 participants, of whom 94 participants provided samples at both time points, and 52 at only t = 1 or t = 2. The distribution of baseline characteristics, and fT4 and TSH concentrations were assessed for normality using the Shapiro–Wilk test. Differences in baseline characteristics between neonates participating at t = 1 only and neonates participating at t = 2 only were compared using a t-test in case of normal distribution and Mann–Whitney U test in case of lack of a normal distribution. Differences in fT4 concentrations between t = 1 and t = 2 were compared using the t-test for paired samples, as fT4 concentrations were distributed normally. TSH concentrations, which were not distributed normally, were compared between both time points with the Wilcoxon test.
RIs were determined using the 95% confidence interval of the normal distribution for fT4 concentrations with the parametric method. For the TSH concentrations, which were not distributed normally, the nonparametric percentile method was used. For both methods, the RI contains 95% of the observed values. To detect outliers, we used the Tukey test, which defines outliers as values 1.5 times the interquartile range below or above the first or third quartile. In case of outliers, the participant's clinical characteristics and circumstances during blood collection were re-evaluated. Outliers were not omitted automatically.
A linear mixed-effects model was constructed to analyze the effect of demographic and biochemical variables on neonatal fT4 concentrations. The mixed model was chosen to account for repeated measurements. Random intercepts were fitted for each participant. Variables were selected based on biological plausibility and previous study (17). Fixed effects included sex, gestational age, birth weight, birth method, TSH concentration in plasma, and total T4 concentration in DBS. Maximum likelihood was chosen as method for parameter estimation because only one random factor was included in the model. A p-value <0.05 was considered statistically significant.
Data were stored using Castor EDC (Castor Electronic Data Capture; Ciwit BV, Amsterdam, the Netherlands). RIs were calculated using MedCalc for Windows, version 18.5 (MedCalc Software, Ostend, Belgium). Descriptive data and linear mixed-effects models were obtained with RStudio version 3.5.1 (2018-07-02), using packages lme4 and lmerTest (24 –26).
Results
In 146 participants (49% female), ≥1 measurement was available. Samples for two time points were obtained from 94 participants. From 52 participants, one sample was obtained at t = 1 or t = 2. Baseline characteristics of the participants are provided in Table 1. There was no significant difference in baseline characteristics between neonates only participating at t = 1 compared with neonates only participating at t = 2. Neonatal CH screening results were normal in all participants (mean T4 concentration 86 ± 17 nmol/L). In 25 participants (17.1%), an additional DBS-TSH measurement was performed based on the neonatal screening results, as described under the “Biochemical analysis” section. All reported DBS-TSH concentrations were <3 mU/L. A DBS-TBG measurement was performed in seven participants (4.8%).
Baseline Characteristics of the Participating Neonates (n = 146) and Their Mothers
SD, standard deviation
fT4 concentrations in plasma were normally distributed at both time points; TSH concentrations in plasma were right-skewed (Fig. 1). Day-specific 95% RIs for fT4 and TSH concentrations are shown in Table 2. fT4 concentrations were significantly higher at t = 1 compared with t = 2 (p < 0.0001), while no significant difference between TSH concentrations was observed (p = 0.56).
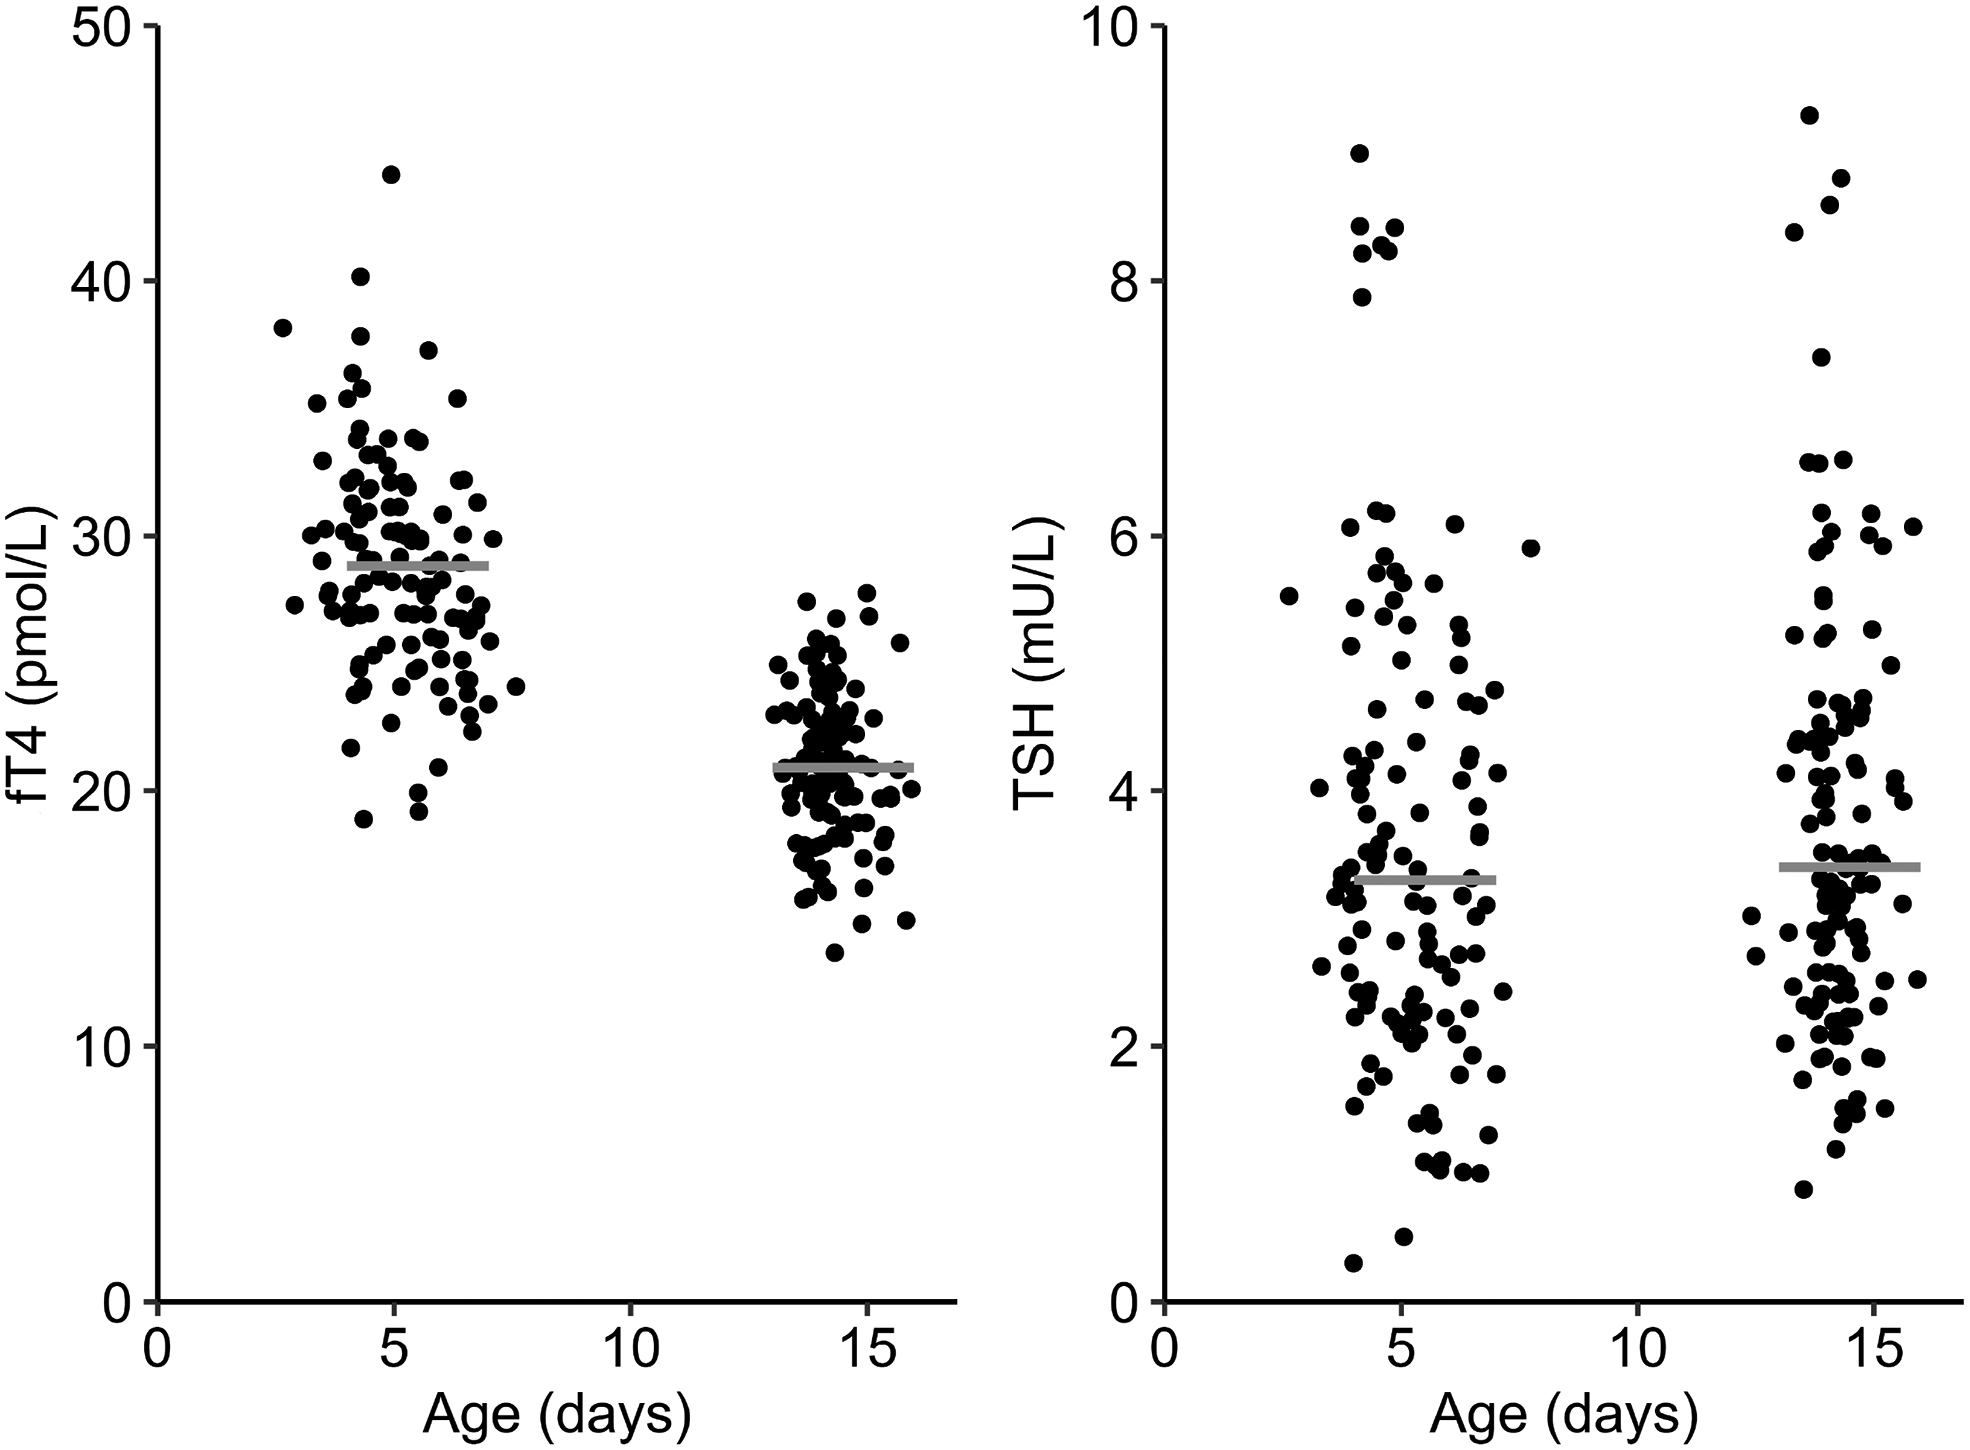
Plasma fT4 and TSH concentrations in term neonates (n = 120 samples at each time point, obtained from 146 participants: 94 participants with samples at both time points and 52 participants with a sample at the first or the second time point). Horizontal gray lines represent the mean (fT4) and median (TSH) concentrations. fT4, free thyroxine; TSH, thyrotropin.
Day-Specific 95% Neonatal Reference Intervals for Plasma Free Thyroxine and Thyrotropin Concentrations
The lower limit of the reference intervals represents the 2.5th percentile of the study population, the upper limit represents the 97.5th percentile.
fT4, free thyroxine; TSH, thyrotropin.
Linear mixed-effects model analysis showed that age in days (β = −0.866, p < 0.001) and total T4 concentration in DBS (β = 0.074, p < 0.001) were independently associated with plasma fT4 concentration (Table 3). Sex, gestational age, birth weight, birth method, or plasma TSH concentration was not associated with fT4 concentrations in the first two weeks of life. For the majority of the participants, the parental race/ethnicity was Caucasian (88% of the participants' mothers and 95% of the participants' fathers). Therefore, the effect of race/ethnicity on neonatal fT4 and TSH concentrations could not be assessed reliably.
Linear Mixed-Effects Model with Predictors for fT4 Concentrations During the Neonatal Period
CI, 95% confidence interval; DBS, dried blood spot; SE, standard error; T4, thyroxine.
Discussion
In this study, we calculated RIs for plasma fT4 and TSH in healthy, term neonates at two time points during the first two weeks of life, based on 120 measurements each. We found that fT4 concentrations differ significantly between the first and second week of life. Moreover, the fT4 lower limit of the RI at both time points was considerably higher than the adult lower limit of the RI for the same assay. Neonatal TSH concentrations were comparable at both time points, and the calculated RI differed only slightly from the adult RI, with higher neonatal TSH upper limits for the same assay.
To the best of our knowledge, this is the first study determining neonatal RIs for fT4 and TSH with the Cobas electrochemiluminescence immunoassay at these specific time points. Two previous studies used the similar Roche Modular E170 electrochemiluminescence immunoassay (27,28). Mutlu et al. collected blood from 22 healthy neonates on the 14th day of life and reported an fT4 RI of 14.5–28.7 pmol/L, which is consistent with our findings (27). In contrast to our findings, Jaber reported a mean fT4 of 33.4 pmol/L ± 12.0 at the 14th day of life (n = 32) (28). While both studies included a small number of participants, in the current study, we adhered to the recommended minimum of 120 observations for each time point to reliably determine RIs (23). In addition, the linear mixed-effects model demonstrates that age is related with fT4 concentrations, showing a daily decrease in fT4 concentrations during the first two weeks of life. This is in line with findings from previous studies, which show higher plasma fT4 and TSH concentrations in the first weeks of life, followed by a steady decline during infancy (11,29,30).
Comparison of venous TSH concentrations at day 3–7 with previous studies is difficult, as studies often measured TSH in small groups, on different days and with use of different assays (11,12). Neonatal TSH concentrations are known to peak within 30 minutes postpartum, the so-called TSH surge (31). In the following 24–48 hours, TSH rapidly declines toward the pediatric RI (14). Mutlu et al. studied TSH concentrations in small groups (<40 participants) on day 3, 5, and 7 and obtained TSH upper limits of 18.6, 13.1, and 12.1 mU/L, respectively, showing higher concentrations than in our current study (27). However, the TSH RI for day 14 reported in their study was 1.72–7.87 mU/L, which is consistent with our findings.
A limitation of our study is the lack of parents and neonates from specific ethnic subgroups. The majority of participants were born to parents of Caucasian descent (128/146 mothers; 138/146 fathers). Very few participants had parents of Sub-Saharan African descent (0/146 mothers; 2/146 fathers). Previously, RIs for fT4 and TSH have been established among healthy neonates in Kenya, using the same assay (15). Although different time points were studied, a comparable median fT4 concentration was found at day 8–14 of life (15). In contrast, others found slight differences in fT4 concentrations among white, East Asian, and South Asian children older than one year, indicating an influence of ethnicity, although effect sizes were modest (13).
The calculated fT4 lower limit of the RI of 15.3 pmol/L at day 13–15 is much higher than the currently recommended lower limit of the RI of 10–12 pmol/L, which has been suggested in previous literature (32 –35). In the Netherlands, an fT4 concentration of 12 pmol/L is often adhered to as a cutoff for further diagnostic testing at this age (32). This often used cutoff level may have been established using a different fT4 assay, as standardization differences between fT4 assays exist (36). It is therefore important to use a cutoff specific to the used assay. We encourage endocrinologists to become familiar with the fT4 assay used in their institution and to obtain information from their laboratory's clinical chemist if necessary.
The currently presented fT4 lower limit of the RI raises the question how frequently CH-C patients are missed following initially abnormal screening results from programs that detect CH-C. Due to the lack of age-specific neonatal RIs, CH-C patients may erroneously be regarded as euthyroid based on venous fT4 concentrations (4,37,38). At the same time, high false-positive rates have been reported for T4-based neonatal screening programs (39,40). A small proportion of these false-positive results might in fact represent CH-C patients and thus true-positive results.
While the neonatal TSH RIs approach the assay's adult RI, the neonatal TSH upper limits were slightly higher at both time points. Meanwhile, for TSH-based neonatal screening programs, there is no consensus whether TSH cutoffs should be lowered to 6–10 mU/L to detect mild cases of CH-T (41,42). However, distinguishing a neonate with mild CH-T from an euthyroid neonate remains difficult, which further highlights the importance of age-specific RIs (42,43). The currently presented TSH RIs might be helpful in this matter.
In case CH is suspected, we recommend measuring fT4 and TSH concentrations with assays with well-established neonatal RIs. For the Cobas immunoassay, the fT4 lower limit at day 3–7 and 13–15 are 20.5 pmol/L and 15.3 pmol/L, respectively. These lower limits should be used when CH-C is suspected. If mild CH-T is considered, the age-specific upper limit of the TSH RI should be taken into account as well.
In conclusion, we established age-specific neonatal RIs for fT4 and TSH concentrations at two time points. In a sufficiently large group of healthy, term neonates, TSH concentrations differed only slightly from the adult RI for the same assay, while fT4 concentrations were considerably higher. Most importantly, for the Cobas immunoassay, we report an fT4 lower limit of the RI of 15.3 pmol/L at day 13–15, which is higher than the lower limit of the adult reference range, and higher than often suggested for neonates. The established fT4 lower limit will be particularly useful if CH-C is suspected because this remains a difficult diagnosis.
Footnotes
Acknowledgments
The authors would like to thank all participants and their parents. We thank all collaborating midwife practices for their help, in particular “Femme Amsterdam,” “VPOE,” and “Witsenkade” in Amsterdam, the Netherlands, as well as the neonatal screening department of the GGD Amsterdam, the Netherlands.
Author Disclosure Statement
All authors declare that no competing financial interests exist.
Funding Information
No funding was received.