
Abstract
Background:
Subclinical hypothyroidism is diagnosed based on serum thyrotropin (TSH) reference intervals, which in turn are affected by many factors.
Methods:
Data were acquired from a Chinese nationally representative cross-sectional study of 78,470 participants (TIDE study). The total study population were participants from the TIDE program, and the reference population was a subset of the total population defined by the National Academy of Clinical Biochemistry (NACB) guidelines. Serum concentrations of thyroid hormones, TSH, thyroid antibodies, and urine iodine concentration (UIC) were measured.
Results:
The geometric mean serum TSH (2.5th–97.5th) for the reference population (defined by the NACB) and total population was 2.28 mIU/L (0.74–7.04 mIU/L) and 2.34 mIU/L (0.61–8.33 mIU/L), respectively. In the reference population, increase in UIC was significantly associated with increase in the 50th and 97.5th centiles and decrease in the 2.5th centile of TSH. The median TSH was significantly higher in women than in men (2.41 mIU/L vs. 2.16 mIU/L, p-value <0.001). Increased age was significantly associated with an increased TSH, 97.5th centile. For each 10-year increase in the population age, the TSH 97.5th centile increased by 0.534 mIU/L. The prevalence of subclinical hypothyroidism diagnosed according to the assay-recommended interval (Roche 0.27–4.2 mIU/L) and NACB standard interval in the TIDE study (0.74–7.04 mIU/L) differed significantly (Roche 13.61% vs. TIDE 3.00%, p < 0.05). However, there was no significant difference in future cardiovascular disease, reflected by the Framingham risk score, between the 0.27–4.2 and 4.2–7.04 mIU/L TSH groups.
Conclusions:
Serum TSH concentration significantly increased with increase in iodine intake. Thus, iodine intake must be considered in establishing TSH reference intervals. To avoid overdiagnosis and overtreatment of subclinical hypothyroidism, different areas should use individual serum TSH reference intervals.
Introduction
Serum thyrotropin (TSH) concentration is the most sensitive index of the hypothalamic/pituitary/thyroid axis function (1). The establishment of the highly sensitive TSH determination method in particular enabled the diagnosis of subclinical hypothyroidism and subclinical hyperthyroidism, which has ushered a new era in the study of subclinical thyroid dysfunction. As reported previously, the prevalence of subclinical hypothyroidism is as high as 3–15% (2 –4), and it is one of the most common thyroid dysfunction conditions.
Subclinical hypothyroidism is significantly associated with dyslipidemia and cardiovascular disease (CVD) and has been one of the hot topics in thyroid and cardiovascular sciences (5). Furthermore, specific clinical symptoms of subclinical hypothyroidism are lacking, and the diagnosis of the condition is mainly dependent on laboratory tests, that is, elevated serum TSH and normal serum thyroxine concentrations (6). Therefore, the diagnosis of subclinical hypothyroidism is based on the reference serum TSH value.
The normal serum TSH interval reported in most studies is 0.3 − 4.8 mIU/L, and the reference population was established according to the standard of National Academy of Clinical Biochemistry (NACB) in the United States (7). However, serum TSH concentration is affected by factors such as age, sex, race/ethnicity, region, and method of determination.
In recent years, in particular, iodine intake has been found to greatly affect normal serum TSH values (2,8,9). With the implementation of the universal salt iodization policy for more than 20 years, the trend of increasing serum TSH concentrations has become more and more obvious, particularly in China and Korea (3). Elevated serum TSH leads to a significant increase in the prevalence of subclinical hypothyroidism, as well as confusion and concern about it. Recently, we completed a large-scale, population-based, nationwide epidemiological survey of iodine nutrition status and thyroid disease (TIDE study), which covered 31 provinces and 78,470 individuals. In this study, we used the serum TSH value in China to analyze the association between iodine intake and other factors on serum TSH levels.
Materials and Methods
Study population
The data for the present analysis were obtained from the TIDE study, conducted from June 2015 to June 2017. The aim of the nationwide survey was to evaluate the iodine nutrition status and thyroid disorders among the national nongestational population aged ≥18 years in China. The study had four stages of random sampling from urban and rural locations in parallel (Supplementary Fig. S1). The age and sex composition of each community and the urban/rural ratio were determined by using the 2010 national census data of China (10). Parallel random sampling was performed in rural locations. More details of the TIDE study design have been published previously (8).
The total study population included the 78,470 participants from the TIDE program, and the reference population included participants within the total population as defined by the NACB guidelines (Supplementary Fig. S1) (7). These are the criteria listed by NACB: (i) individuals with no detectable thyroid autoantibodies, thyroid peroxidase antibodies (TPOAb), or thyroglobulin antibodies (TgAb); (ii) individuals with no personal or family history of thyroid dysfunction; (iii) individuals with no visible or palpable goiter; and (iv) individuals who did not receive any medications except estrogen.
From each participant, fasting blood and fasting spot urine samples were collected. Serum obtained by centrifugation of the blood samples was preserved at −20°C before being further processed. Upon the completion of the survey and specimen collection, all specimens were airlifted by the cold chain system to a central laboratory in Shenyang, China, for centralized testing.
All participants underwent thyroid ultrasonography performed by qualified observers, who had been trained and evaluated at the project center, by using a portable instrument (LOGIQ 100 PRO; GE, Milwaukee, WI; with 7.5 MHz linear transducers). Thyroid lobe height, width, and depth were measured, and thyroid lobe volume was determined by the formula of Brunn: 0.479 × depth × width × height (11). The study protocols were approved by the Medical Ethics Committee of China Medical University. All subjects provided written informed consent following a thorough explanation of the study procedures.
Laboratory tests
Serum TSH, TPOAb, and TgAb were measured using an electrochemiluminescence immunoassay on a Cobas 601 analyzer (Roche Diagnostic, Switzerland) at the central laboratory in Shenyang. The results were not measured using any other platform. Free thyroxine (fT4) and free triiodothyronine (fT3) levels were measured only if the TSH level was outside the normal range. The normal ranges for TSH, TPOAb, and TgAb provided by the manufacturers were 0.27–4.2 mIU/L, <34.0 IU/mL, and <115.0 IU/mL, respectively. Urine iodine concentration (UIC) was determined using inductively coupled plasma mass spectrometry (Agilent 7700x; Agilent Technologies). The measurement quality was controlled against that of the certified reference material (GBW09108, GBW9109, and GBW9110) from the Center for Disease Control in China. The target values of the standards were 70.8 ± 9.0, 143 ± 10, and 224 ± 14 μg/L, respectively. The corresponding interassay and intra-assay coefficients of variation (CV) were 2.3%, 2.5%, and 2.4%, and 2.7%, 1.4%, and 2.3%. The functional sensitivity of the serum TSH assay was 0.014 μIU/mL. The repeatability of serum assays for TSH, fT4, fT3, TPOAb, and TgAb was ensured by the intra-assay CV of 1.1–6.3% and the interassay CV of 1.9–9.5%.
Anthropometric assessment
Blood pressure was measured according to standard protocols. It was measured in the nondominant arm twice consecutively, with a 10-minute interval between the measurements and the participant in a seated position. Five minutes of rest were considered when using an electronic blood pressure monitor (Omron HEM-7430; Omron Corporation).
Biochemical assessment
Blood samples were collected from all the participants after overnight fasting for at least 10 hours. Serum triglyceride (TG), total cholesterol (TC), low-density lipoprotein cholesterol (LDL-C), and high-density lipoprotein cholesterol (HDL-C) were measured using an automatic biochemical analyzer (Mindray BS-180 Analyzer).
Iodine intake groups
Participants were classified into seven groups according to UIC, which is a well-established indicator of iodine intake. Those with a UIC ≥500 μg/L, 400–499 μg/L, 300–399 μg/L, 200–299 μg/L, 100–199 μg/L/L, 50–99 μg/L/L, and <50 μg/L were defined as having an extremely excessive iodine intake, moderately excessive iodine intake, mildly excessive iodine intake, more-than-adequate iodine intake, adequate iodine intake, mildly deficient iodine intake, and moderately-to-severely deficient iodine intake, respectively. This classification was adopted from the World Health Organization recommendation (12).
Statistical analysis
All calculations were performed with Statistical Analysis System (SAS) version 9.3 (SAS Institute, Inc.) and SPSS software (version 20.0; SPSS, Inc., Chicago, IL). Significance was defined as p < 0.05. The upper and lower limits for TSH were established from the 95% confidence limits (2.5th–97.5th) of the log-transformed values for the reference population; frequency distribution curves of TSH were prepared conventionally by using log-transformed TSH values (7). Since the log-transformation did not improve the form of the TSH distribution and the results of analyses using transformed data were similar to those of the analyses using untransformed data, raw values were used.
Quantile regression is a good way to identify trends in a distribution. The coefficients of quantile regression model could reveal the effect of a unit change (such as 1 or 10) in the covariate on the quantiles of response distribution. For example, a 10 μg/L increase in the UIC can predict a certain shift of the median centile of TSH (determined by the 50th centile regression coefficient). Hence, the arrays of these coefficients for a range of quantiles can be used to predict how a one-unit change in the covariate affects the form of the response distribution. We determined the effect of age, sex, race/ethnicity, and UIC levels on the median TSH level and 2.5th and 97.5th centiles of TSH.
Results
With an overall response rate of 92.08%, 80,937 participants had completed the study. Among them, 2467 subjects were excluded owing to missing information on sex, age, or thyroid function tests and 78,470 samples (38,182 men and 40,288 women) remained eligible for analysis. Furthermore, among these subjects, 58,684 participants were defined as the reference population according to NACB, which ruled out the influences of factors such as thyroid autoantibodies (Supplementary Fig. S1) (7).
Standard interval
As shown in Table 1, the geometric mean serum TSH (2.5th–97.5th) for the reference population in this study (defined by NACB) was 2.28 mIU/L (0.74–7.04 mIU/L) and that for the total population in this study was 2.34 mIU/L (0.61–8.33 mIU/L). The median TSH level and 2.5th and 97.5th percentiles were calculated for the total population and the reference population by considering different factors, including age, sex, median urine iodine (MUI), race/ethnicity, and geographic region (Table 1).
Serum Thyrotropin Concentration (Median, 2.5th and 97.5th Centiles) by Population Characteristics, Age, Sex, Race/Ethnicity, and Geographic Region in China; TIDE (2015–2017)
TSH = mIU/L.
The reference population was defined according to the NACB and it included participants who had: (i) no detectable thyroid autoantibodies, TPOAb, or TgAb; (ii) no personal or family history of thyroid dysfunction; (iii) no visible or palpable goiter; and (iv) no medications (except estrogen).
NACB, National Academy of Clinical Biochemistry; TgAb, thyroglobulin antibodies; TPOAb, thyroid peroxidase antibodies; TSH, thyrotropin.
Iodine intake
In the reference population, the TSH lower limit (2.5th) showed a downward trend with an increase in iodine intake (Table 1 and Fig. 1A). The median of TSH (50th) level increased significantly with an increase in the iodine intake, which showed a trend of linear correlation (correlation coefficient: 0.989, p = 0.000; Table 1 and Fig. 1B). The TSH upper limit (97.5th) showed a significant upward trend with an increase in iodine intake (Table 1 and Fig. 1C), the TSH levels were 6.83, 6.95, and 8.20 mIU/L for UIC <50, 200–299 μg/L, and UIC >500 μg/L, respectively. The TSH intervals for the total population were higher than those for the reference population but showed the same trend. As shown in Table 2, increased UICs were significantly associated with increased 50th and 97.5th centiles of TSH and decreased with the 2.5th centiles of TSH. The main effect of UIC was seen at the 97.5th centile of TSH. For every 10 μg/L increase in the population's UIC, the 97.5th centile of TSH increased by 0.0132 mIU/L. This trend remained after adjustment for age, sex, and race/ethnicity in the reference population. Furthermore, the median TSH level in each province showed a significant positive correlation (correlation coefficient 0.523, p = 0.003) with the MUI of the population in the province (Fig. 1D).
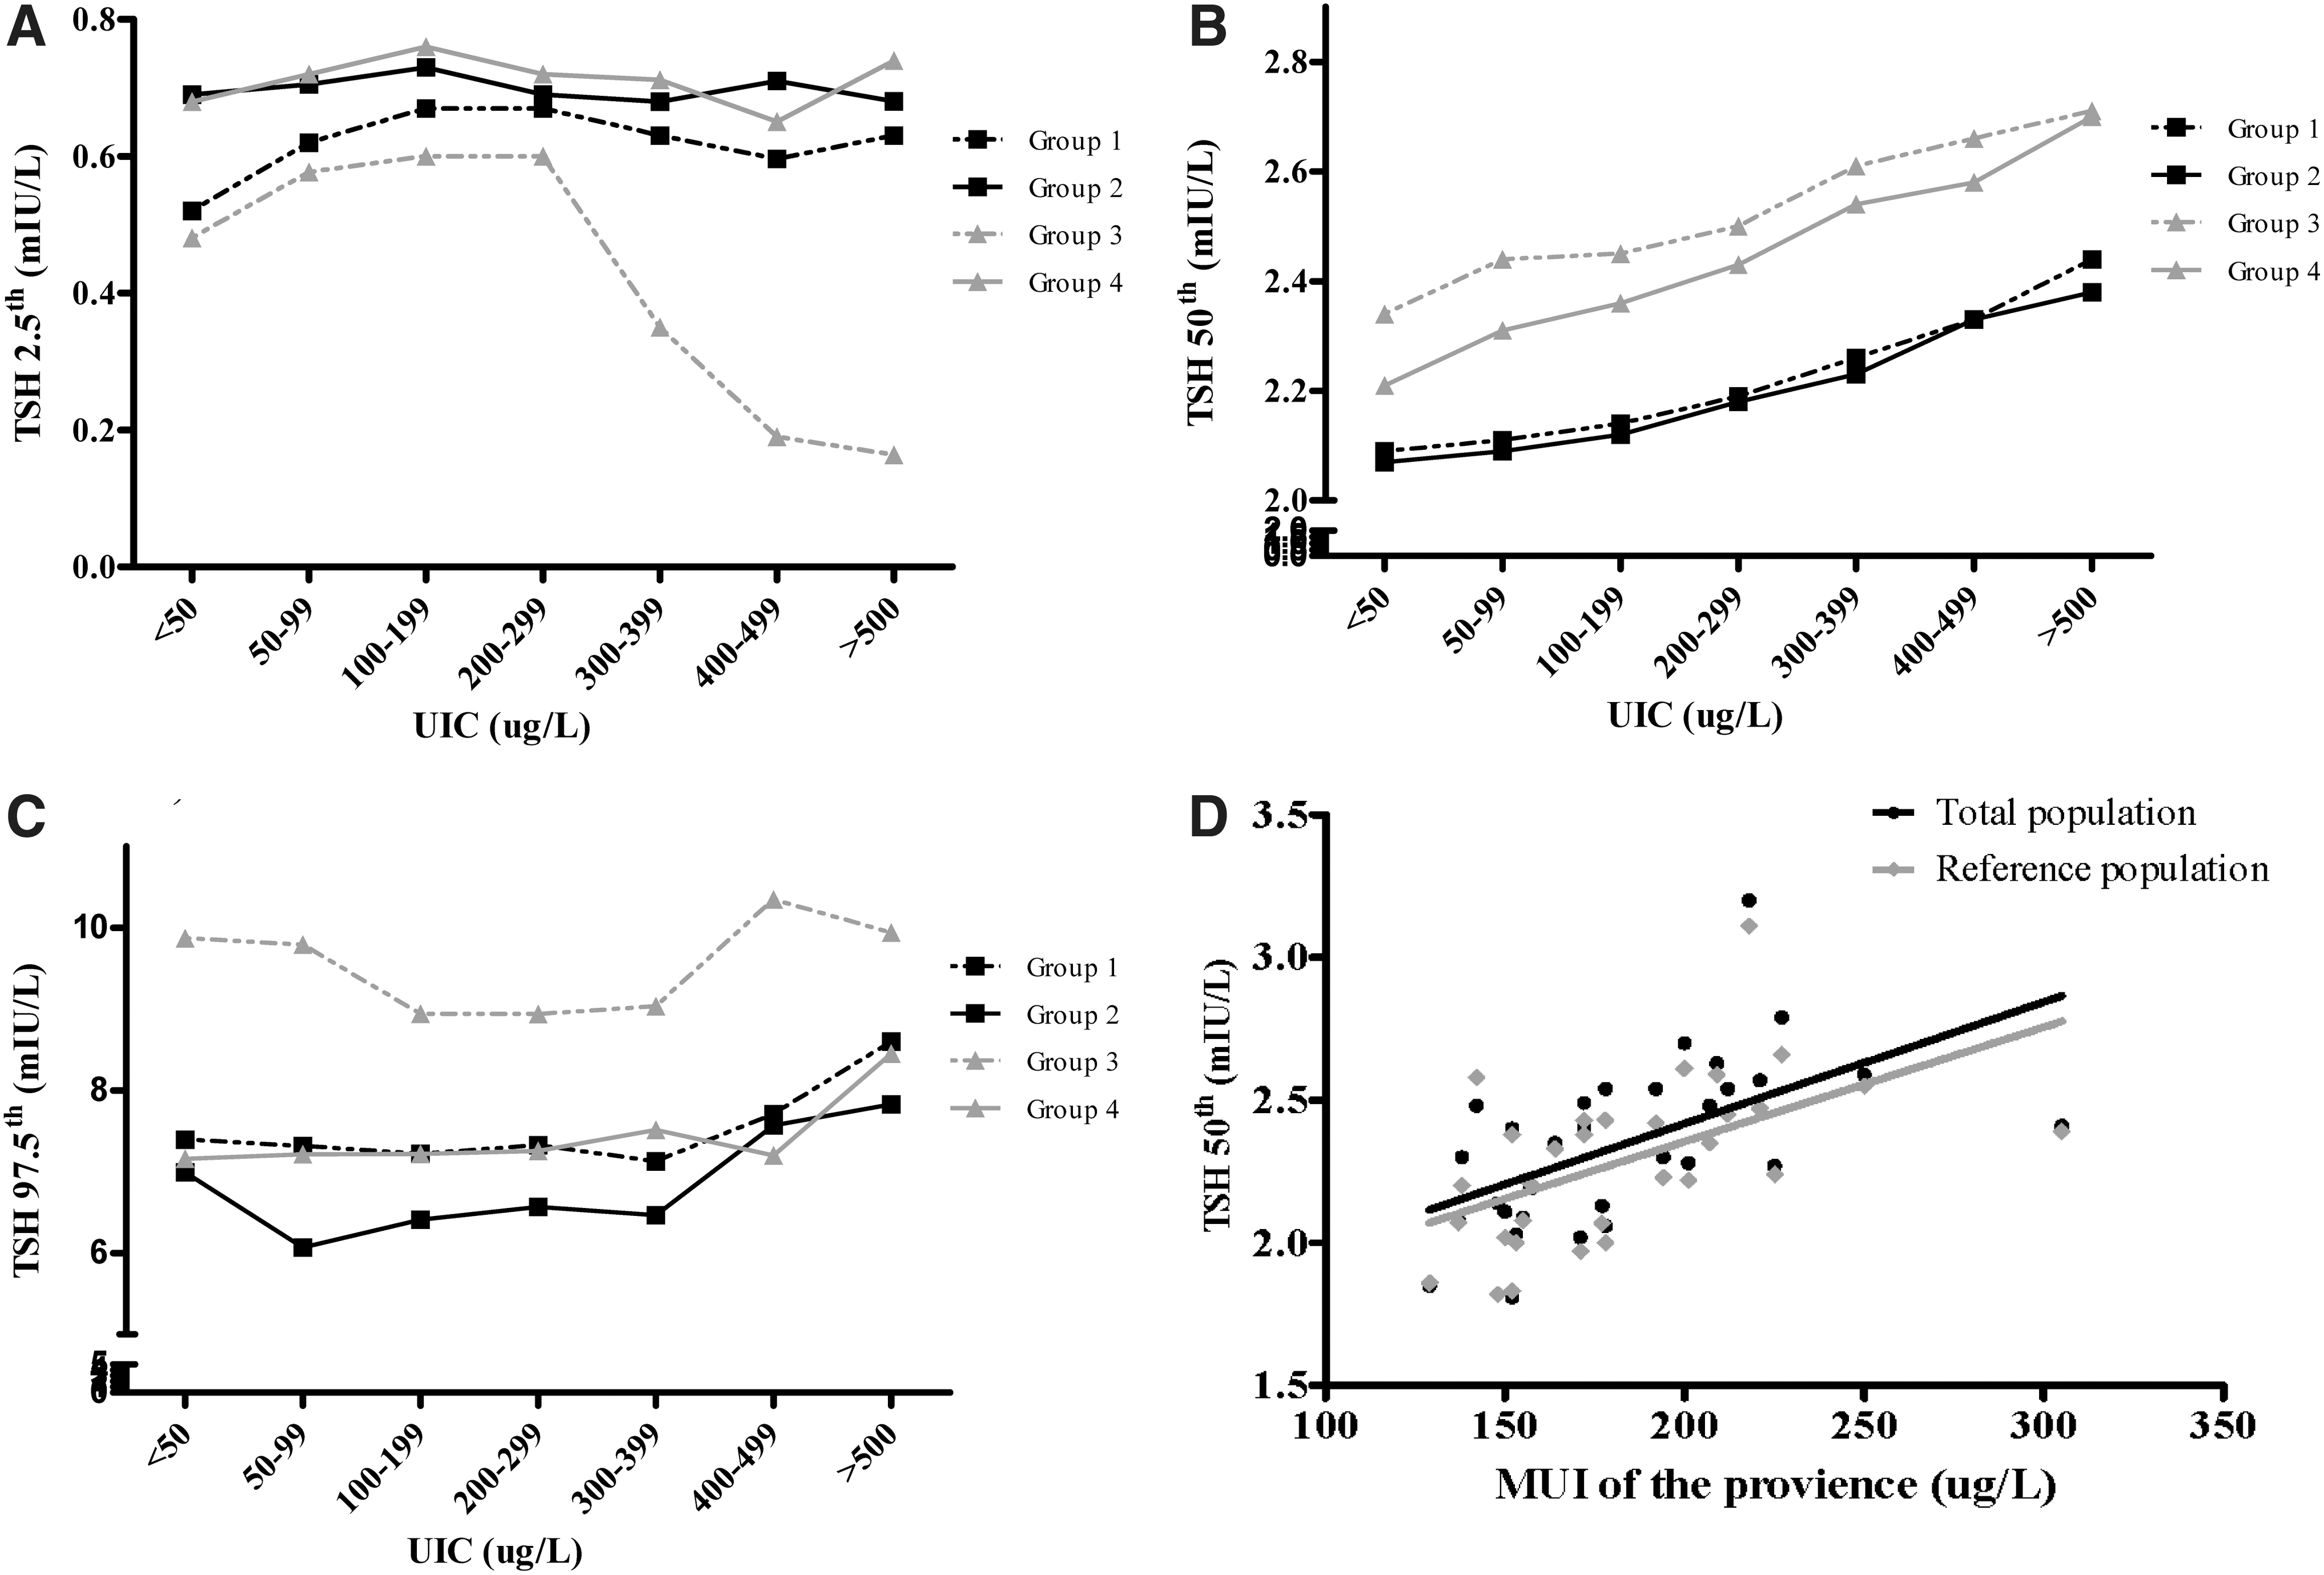
Serum TSH levels in terms of population characteristics and iodine excretion. The 2.5th (
Multivariate Quantile Regression Analysis of Factors Independently Associated with Thyrotropin at the 2.5th, Median, and 97.5th Centiles of Thyrotropin in the Reference Population
The reference population was defined according to NACB and it included participants who had: (i) no detectable thyroid autoantibodies, TPOAb, or TgAb; (ii) no personal or family history of thyroid dysfunction; (iii) no visible or palpable goiter; and (iv) no medications (except estrogen).
Coefficients less than zero indicate an inverse association between the characteristics (age, etc.) and TSH.
For every 10-μg/L increase in MUI, there is a 0.0011-μg/L increase in the 50th centile of TSH.
The Han ethnicity was chosen as the reference since it was the largest subpopulation.
MUI, median urine iodine; UIC, urine iodine concentration.
Sex
In the reference population, the median TSH (50th) level was significantly higher in women than in men (2.41 mIU/L vs. 2.16 mIU/L, p < 0.001). The upper limit of TSH for women was as high as 7.32 mIU/L. There was right-shifted TSH distribution among women compared with men (Supplementary Fig. S2A).
Age
The median TSH concentration increased with age after the age of 29 years in both populations, and the TSH 97.5th centile significantly increased with age in both populations, with the peak occurring in the >70-year age group. There was a small peak of median TSH in the 18–29-year age group. There was no trend between the TSH 2.5th centile and increasing age in both populations. There was a right-shifted TSH distribution in the >70-year age group compared with the 30–39-year age group (Supplementary Fig. S2B). Increased age was significantly associated with an increase in the 50th and 97.5th centiles of TSH. The main effect of age was observed at the 97.5th centile of TSH. For each 10-year increase in the population age, the 97.5th centile of TSH increased by 0.534 mIU/L (Table 2).
Geographic region
We found significant differences in serum TSH intervals in 31 provinces (Supplementary Table S1). The lowest and highest TSH intervals were obtained in the Guangdong Province (50th centile, 1.86 mIU/L; 97.5th centile, 5.14 mIU/L), which was in the south of China, and in the northern province Qinghai (50th centile, 3.11 mIU/L; 97.5th centile, 11.44 mIU/L). There was no significant serum TSH percentile or distribution between urban and rural populations; however, the median and 97.5th percentile for the inland populations were much higher than the corresponding values for the coastal populations (2.34 mIU/L vs. 2.11 mIU/L, p = 0.003; 7.14 mIU/L vs. 5.91 mIU/L, p = 0.001) (Table 1). There was a right-shifted TSH distribution between these two areas in the reference population (Supplementary Fig. S2C). Interestingly, the difference between inland and coastal areas (2.30 mIU/L vs. 2.06 mIU/L, p = 0.007) persisted in the reference population with adequate iodine intake (MUI 100–199 μg/L).
Race/ethnicity
TSH distribution showed substantial differences among the five ethnicities assessed in this study. In comparison with individuals of Han ethnicity (2.28 mIU/L), who are the largest ethnic group in China, individuals of Tibetan and Hui ethnicities showed much higher TSH levels (2.44 mIU/L, p = 0.000 and 2.89 mIU/L, p = 0.000, respectively). However, the mean TSH levels in individuals of Zhuang (1.99 mIU/L, p = 0.00) and Uygur (2.01 mIU/L, p = 0.00) ethnicities were lower than those in individuals of Han ethnicity (Table 1). Tibetan and Hui ethnicities showed significantly higher 50th and 97.5th centiles, especially 97.5th centiles, than Han ethnicity. In contrast, Zhuang ethnicity showed significantly lower 2.5th, 50th, and 97.5th centiles than Han ethnicity, suggesting that the TSH frequency distribution curve of Zhuang ethnicity shifted to lower TSH concentrations than that of Han ethnicity. Uygur ethnicity showed a significantly lower 2.5th centile and median compared with Han ethnicity. These trends across different ethnicities in comparison with Han ethnicity persisted after adjusting for age, sex, and UIC (Table 2).
Differences in the prevalence of thyroid disease
Table 3 shows major differences in the prevalence of thyroid disorders between the recommended interval provided by the Roche kit (0.27 − 4.2 mIU/L) and the standard interval determined in this study (0.74 − 7.04 mIU/L). The most significant difference was found in the prevalence of subclinical hypothyroidism, which showed a significant intergroup difference in the adequate iodine intake population (Roche 13.61% vs. TIDE 3.00%, p < 0.05).
Prevalence of Hyperthyroidism and Hypothyroidism Based on the Kit-Recommended Interval and National Academy of Clinical Biochemistry Standard Interval Derived from This Study by Urine Iodine Concentration
UIC group classification is mainly adopted from the WHO recommendation.
The kit-recommended interval for TSH provided by the Cobas 601 analyzer (Roche Diagnostic, Switzerland) is 0.27–4.2 mIU/L.
The reference population was defined according to NACB, which included participants who had: (i) no detectable thyroid autoantibodies, TPOAb, or TgAb; (ii) no personal or family history of thyroid dysfunction; (iii) no visible or palpable goiter; and (iv) no medications (except estrogen).
Overt hyperthyroidism refers to patients whose TSH <0.27 mIU/L, fT4 > 22 pmol/L, or fT3 > 6.8 pmol/L.
Subclinical hyperthyroidism refers to patients whose TSH <0.27 mIU/L, fT4 was within 12–22 pmol/L, and fT3 was within 3.1–6.8 pmol/L.
Overt hypothyroidism refers to patients whose TSH >4.2 mIU/L and fT4 < 12 pmol/L.
Subclinical hypothyroidism refers to patients whose TSH >4.2 mIU/L and fT4 was within 12–22 pmol/L.
The prevalence between recommended and NACB in the certain iodine area is significantly different (p < 0.05).
fT3, free triiodothyronine; fT4, free thyroxine.
CVD risk between different TSH groups
To further explain the applicability of the standard interval obtained in this study, we divided the population into three groups according to their serum TSH level. Group 1 contained individuals with serum TSH level 0.27–4.2 mIU/L; group 2 with serum TSH level 4.2–7.04 mIU/L; and group 3 with TSH level more than 7.04 mIU/L. Then, we calculated the Framingham risk score (FRS) for every participant in the three groups. FRS was calculated by adding the scores for the six main coronary risk factors: sex, age, HDL, TC, systolic blood pressure, and smoking habit. The 10-year CVD risk (as a percentage) was determined from the total score (13). As shown in Table 4, group 2 (TSH: 4.2–7.04 mIU/L) had a slightly lower 10-year CVD risk (over 10% and 20% in males; over 11% and 22% in females) than did group 1 (TSH: 0.27–4.2 mIU/L). Regarding the 10-year CVD risk of over 30% in both sexes, the prevalence in group 2 was not significantly different from that in group 1. Group 3 (TSH: >7.04 mIU/L) had a significantly higher risk prevalence than groups 1 and 2 in all comparisons.
Ten-Year Cardiovascular Disease Risk in Percentage Reflected by Framingham Risk Score Among Different Thyrotropin Level Groups
The calculation of FRS was to add up the scores based on six main coronary risk factors, including sex, age, HDL, TC, systolic blood pressure, and smoking habit. CVD risk in percentage was reflected by total points.
Each letter denotes a subset of intervention categories whose column proportions do not differ significantly from each other at the p < 0.05 level. That is the column that shows the same letter has no significant differences and that showing different letters has a significant difference.
CVD, cardiovascular disease; FRS, Framingham risk score; HDL, high-density lipoprotein; TC, total cholesterol.
Discussion
TSH is an essential part of the hypothalamic/pituitary feedback system and is the most sensitive parameter indicating early changes in thyroid function. According to the American Thyroid Association (ATA), TSH secretion is exquisitely sensitive to both minor increases and decreases in serum fT4 levels (14). Since there is a physiologic logarithmic relationship between TSH and fT4, abnormal TSH levels occur before fT4 abnormalities are detectable during the development of hypothyroidism and hyperthyroidism (15). Therefore, it is very important to understand the factors and determine how exactly they affect the TSH distribution. This study uses data from the TIDE study to provide supporting evidence for establishing TSH intervals for specific subpopulations in China.
Autoimmune thyroiditis is one of the most common causes of elevated TSH levels. In our study, to rule out the relationship between risk factors and elevated TSH levels, we used the NACB guidelines and defined a reference population with negative serum autoimmune antibodies (TPOAb and TgAb). We confirmed that the TSH intervals were significantly associated with nutritional iodine intake. Increased iodine intake was associated with elevation of 50th and 97.5th centiles of the reference population, but not with the 2.5th centile. The high iodine state group showed a clear right shift (UIC ≥500 μg/L) in comparison with the adequate iodine intake group (UIC 100–299 μg/L) (Supplementary Fig. S2D). On the basis of our quantile regression results, for every 10 μg/L increase in the population UIC, the 97.5th centile of TSH increases by 0.0132 mIU/L. This trend was shown in both the reference and total populations in this study.
Most literature reported serum TSH level intervals ranging from 0.4 to 4.0 mIU/L with a median value of 1.5 mIU/L in iodine-rich regions (4,16). Comparable studies have been reported in South Korea and China. The Korean NHANES survey (2013–2015) enrolled 6564 participants covering the whole country. The study reported a TSH standard interval of 0.62–6.84 mIU/L for the reference population (n = 5563). The median serum TSH level was 2.23 mIU/L, and the MUI was 299.3 μg/L (3). An increased serum TSH level was also reported by Sang et al. in a Chinese study (n = 525), in which the median serum TSH levels (2.5th–97.5th) in an iodine-adequate area and excessive iodine area were 3.42 mIU/L (2.57–4.48 mIU/L) and 4.01 mIU/L (2.79–5.45 mIU/L), respectively (17). Tan et al. reported similar results in a study (n = 506) conducted in an area with high iodine levels. The median serum TSH level was 2.42 mIU/L with an MUI of 185 μg/L and 2.71 mIU/L with an MUI of 1152 μg/L (18). However, these reports were all local and included small samples. A large survey (n = 15,008) of 10 cities located in east and central China was performed by our group in 2010. The serum TSH standard interval in that study was 0.76–6.92 mIU/L, and the median serum TSH value was 2.40 mIU/L with an MUI of 197 μg/L (2). Furthermore, in this study, we reported a median serum TSH level (2.5th–97.5th) of 2.28 mIU/L (0.74–7.04 mIU/L), which confirmed that the phenomenon is not local. Instead, it exists in 31 provinces in mainland China. In comparison with the serum TSH standard interval (0.3–4.8 mIU/L) derived from the survey in 1999, the present serum TSH level in China is significantly higher (19). Even as early as 1999, we had already noted significant differences in median serum TSH values (0.99 mIU/L vs. 1.17 mIU/L vs. 1.90 mIU/L) in three different iodine intake communities (MUI 83.5 μg/L vs. 242.9 μg/L vs. 650.9 μg/L) (20). Therefore, we concluded that the elevated serum TSH value in the general population could be the result of long-term iodine supplementation taken in China. The Chinese population had been exposed to excessive iodine intake for 6 years and more-than-adequate iodine intake for 10 years, even though the MUI reported in this study has already dropped to 197 μg/L (21). A Korean study had similar results (3). However, further observations are needed to determine whether this phenomenon will continue. In the United States, the population MUI in the 1970s was once as high as 320 μg/L, but it then dropped to 145 g/L without any elevation of serum TSH values in the 1980s (4).
There may be three explanations for the high serum TSH level-related increased iodine intake. First is the overreaction of the thyroid to increased iodine intake. Laurberg and colleagues reported that even relatively small differences in iodine intake between populations were associated with differences in the distribution of TSH (22). If the level of iodine intake is sufficient for thyroid hormone production, the TSH level is higher with increasing iodine intake, which was proven in two Danish cohorts of young women examined before and after iodine fortification of salt (23). Moreover, a daily 200 μg iodine supplement increases serum TSH levels in young healthy men (24). However, we do not know whether the elevated serum TSH level is transient or persistent. The second explanation is the thyroid damage caused by thyroid autoimmunity. An increased frequency of thyroid autoimmunity following salt iodization programs was demonstrated (25). The third explanation is from the animal study by our group. Rats were treated with different concentrations of iodine for 10 to 24 weeks and we found that a 10- and 50-fold higher iodine administration significantly inhibited pituitary type II deiodinase activities and induced an increase in the TSHβ subunit in the pituitary (26). Type II deiodinase activity was suppressed by ubiquitination, which was related to prolonged high iodine intake (27).
The applied reference ranges for TSH have been a matter of debate in recent years (28). Our study found that the distribution of TSH in the >70-year group shifted to the right, and the increasing age is more significantly associated with the 97.5th TSH centile after adjusting for other factors. This brings up the diagnosis and treatment questions of mild subclinical hypothyroidism in older individuals. According to the latest ATA guidelines for hypothyroidism (29), very mild TSH elevations in older individuals may not reflect subclinical thyroid dysfunction, but may rather be a normal manifestation of aging, and not all patients who have mild TSH elevations are hypothyroid and therefore would not require thyroid hormone therapy. Serum TSH values were also slightly higher in younger people ages 18–29 years than in adults ages 30–39 years. These findings are in keeping with previous reports for older adults, women, and adolescents (28).
Our study also found that TSH distribution between different ethnicities varies substantially. NHANES III of the U.S. population (1988–1994) reported that TSH was significantly lower in the African Americans than in the Caucasian population. Our study also found a significant variation in serum TSH levels among different ethnicities; Tibet had a median serum TSH level (2.5th–97.5th) of 2.44 mIU/L (0.71–10.73 mIU/L). A recent study in Tibet showed that the prevalence of subclinical hypothyroidism was 19.7% (the diagnosis interval in that study was 2.7–4.2 mIU/L) (30). Since people of different ethnicities prefer to settle together, such as in Tibet, the higher TSH level may be partly caused by the iodine state in their region. However, after we adjusted for age, sex, and UIC in the quantile regression, the elevated serum TSH value trend persisted (Table 2). This result suggested that the elevated TSH value may also be related to genetic polymorphisms and geographical characteristics noted across individuals of different ethnicities, but more studies are needed to explain this phenomenon.
According to the upper limit of the serum TSH interval (0.27–4.2 mIU/L) provided by the manufacturer (Roche), the prevalence of subclinical hypothyroidism in the more than adequate iodine intake population was up to 13.85%, which was much higher than the 5–10% reported in most studies. We next examined whether the TSH reference interval value (0.74 − 7.04 mIU) derived by the NACB standard is reasonable. Although Rodondi reported that subclinical hypothyroidism is associated with hypercholesterolemia and an increase in LDL, a TSH range of 4.5 − 6.9 mIU/L was not associated with the risk of fatal and nonfatal coronary heart disease (31). Only TSH levels >7.0 mIU/L were found to increase the risk of congestive heart failure and stroke (32). In this study, the 10-year CVD risk of over 10% and 20% in the 4.2 − 7.04 mIU/L TSH group was slighter lower than that in the 0.27 − 4.2 mIU/L TSH group, and there was no difference between the two groups in the >30% 10-year CVD risk. This means that the TSH reference value of 0.74 − 7.04 mIU/L reported here is safe and reasonable.
Our report has limitations. The study is cross-sectional and hence does not include individual changes over time. We cannot demonstrate cause and effect and the mechanism leading to these findings. Hence, more studies are needed to explain this point.
In conclusion, our study suggests that, to avoid overdiagnosis and overtreatment of subclinical hypothyroidism, the standard method for establishing TSH reference intervals of populations in iodine-changed areas needs further modification. Measurement methods based on age, sex, race/ethnicity, region, and iodine intake all need to be standardized and modified. Otherwise, this situation will result in the overdiagnosis of subclinical hypothyroidism, which is what we have learned in studies on pregnant women with subclinical hypothyroidism (33). Although we provide some firm evidence for this TSH reference interval to be appropriate and safe, we still need more cohort studies to confirm this finding.
Footnotes
Authors' Contributions
W.P.Z. and Z.Y.S. conceived of and designed the study; Y.Z.L., X.G.S., and D.T. organized and supervised the study; Y.Z.L. and L.Z. conducted the statistical analysis. All authors contributed to the acquisition, analysis, or interpretation of data. W.P.T., Z.Y.S., and L.Z. drafted the article. All authors revised the report and approved of the final version before submission.
Acknowledgments
We thank the participants of this study for their contribution to this research. We also thank the following people for their continuous support, assistance, and cooperation: Wei Gong, Chenling Fan, Hong Wang, Hongmei Zhang, Shuangning Ding, Xiaochen Xie, and Tingting Liu (The First Hospital of China Medical University); Caiping Li and Jian Huangfu (The Affiliated Hospital of Inner Mongolia University); Nan Jin (Chinese PLA General Hospital); Wuquan Deng and Fang Deng (Third Military Medical University); Haicheng Zhou (The First Affiliated Hospital of Dalian Medical University); Qingling Lu (Cardiovascular and Cerebrovascular Disease Hospital of Ningxia Medical University); Yunfeng Shen (The Second Affiliated Hospital of Nanchang University); Guodong Liu (The First Affiliated Hospital of Harbin Medical University); Junxiu Hou and Zhiqiang Zhang (The Affiliated Hospital of Inner Mongolia Medical University); Hong Zhang (The Second Xiangya Hospital); Xiaodong Mao, Qifeng Wang, and Kun Wang (Nanjing University of Chinese Medicine); Yanping Wang (Fujian Medical University Union Hospital); Xiaojun Ma (The First Affiliated Hospital of Zhengzhou University); Liheng Meng (The First Affiliated Hospital of Guangxi Medical University); Weihua Linle and Tuanyu Fang (Hainan General Hospital); Xingjun Liu and Yanru Zhao (The First Affiliated Hospital of Xi'an Jiaotong University); Lulu Chen, Jiaoyue Zhang, and Hanyu Wang (Huazhong University of Science and Technology); Jingfang Liu and Songbo Fu (The First Hospital of Lanzhou University); Qingguo Lv (West China Hospital); Chenglin Sun (The First Hospital of Jilin University); Qiuming Yao and Ronghua Song (Shanghai University of Medicine & Health Science Affiliated to Zhoupu Hosipital); Tingting Chen (The First Hospital of An Hui Medical University); Ben Niu (The First People's Hospital of Yunnan Province); Mingtong Xu and Feng Li (Sun Yat-sen Memorial Hospital); Lizhen Lan (The First Hospital of Shanxi Medical University); Jun Yue and Jia Song (People's Hospital of Tibet Autonomous Region); Yanan Li and Wei Luo (Qinghai Provincial People's Hospital); Xiaoming Lou and Zhe Mo (Zhejiang Provincial Center for Disease Control and Prevention); Nianchun Peng and Lixin Shi (Affiliated Hospital of Guiyang Medical University); Mian Wang, Qiuxiao Zhu, and Lingling Yuan (The Second Hospital of Hebei Medical University); Haiqing Zhang (Shandong Provincial Hospital affiliated with Shandong University); Yong Fan (The First Affiliated Hospital of Xinjiang Medical University); and Hongyan Wei (Tianjin Medical University General Hospital).
Author Disclosure Statement
No competing financial interests exist.
Funding Information
This study was funded by the Research Fund for Public Welfare, National Health and Family Planning Commission of China (Grant No. 201402005), and the Clinical Research Fund of the Chinese Medical Association (Grant No. 15010010589).
Supplementary Material
Supplementary Table S1
Supplementary Figure S1
Supplementary Figure S2