
Abstract
Background:
We examined the changes in glucose metabolites of papillary thyroid cancer (PTC) and identified phosphoglycerate dehydrogenase (PHGDH) as a potential target. The role of PHGDH in the proliferation and tumorigenesis of thyroid cancer cells and its clinical significance were analyzed.
Methods:
Glucose metabolites of various thyroid tissues were analyzed via targeted metabolomics analysis. In vitro experiments using shPHGDHs, inhibitor (NCT503), or PHGDH overexpression in thyroid cell lines (BCPAP, 8505C, and Nthy-Ori) were performed. In vivo experiments were performed by using shPHGDH. Human tissue samples and The Cancer Genome Atlas (TCGA) data were used to validate the experimental findings.
Results:
PHGDH knockdown in BCPAP and 8505c cell lines significantly inhibited cell viability, colony formation, and tumor spheroid formation compared with the control. In addition, treatment with NCT503 showed similar results. PHGDH inhibition by both knockdown and treatment with NCT503 significantly inhibited the expression of embryonic cancer stemness markers (Oct4, Sox2, KLF4, and Nanog). PHGDH overexpression in Nthy-Ori cells significantly increased cell viability and colony formation. The stemness markers were significantly increased after PHGDH overexpression. PHGDH knockdown significantly inhibited tumor growth in an in vivo mouse xenograft study using 8505c cells. The protein expression of Oct4 in tumors was significantly reduced after PHGDH knockdown. The associations between PHGDH expression and stemness markers were confirmed in the TCGA data and human thyroid tissue samples. Positive PHGDH protein expression was associated with metastases of PTC.
Conclusions:
PHGDH expression is induced in thyroid cancer and is associated with stemness and aggressiveness of PTC.
Introduction
Proliferative cancer cells require many nutrients for rapid growth. It is now evident that many oncogenic signals target the metabolic processes of cancer cells to produce important precursors for biosynthesis (1,2). This metabolic reprogramming has emerged as a hallmark of cancer. In terms of glucose metabolism, cancer cells show enhanced glucose uptake and redirection of glucose-derived metabolites into biosynthetic pathways, such as nucleotides, lipids, or protein synthesis (3,4). Warburg already reported that even in the presence of sufficient oxygen, cancer tissue consumes large amounts of glucose by glycolysis (5). A flip-flop phenomenon has been identified as a reverse relationship between iodine and fluorodeoxyglucose accumulation in thyroid cancer (6), which suggested that the dedifferentiation of cancer cells induces glucose uptake in thyroid cancer. However, detailed metabolic dysregulation in thyroid cancer remains poorly characterized (7).
Metabolomics is the scientific study of investigating low-molecular-weight metabolites present in biological samples (8 –10). Changes in metabolite composition reflect alterations in associated enzymes, cellular regulation, and signaling pathways. Cancer metabolomics research in thyroid cancer might help to gain insight into its metabolic alterations and exploit them for better diagnostic or therapeutic strategies.
We applied the liquid chromatography-mass spectrometry (LC-MS) method to evaluate the glucose metabolite levels in papillary thyroid cancer (PTC) tissues compared with normal or benign thyroid tissues. Using this approach, we identified phosphoglycerate dehydrogenase (PHGDH), a well-known enzyme in serine biosynthesis, as a potential therapeutic target in thyroid cancer. Using in vitro and in vivo experiments, we revealed that PHGDH is involved in the proliferation, tumorigenesis, and stemness of thyroid cancer cells. PHGDH inhibition by knockdown or inhibitor treatment significantly inhibited the cell proliferation, tumorigenesis, and stemness of thyroid cancer cells. Moreover, The Cancer Genome Atlas (TCGA) data and human PTC tissue analysis confirmed the association between PHGDH expression and stemness markers. We found that PHGDH protein expression is associated with PTC aggressiveness.
Materials and Methods
Thyroid tissue specimens and construction of tissue microarray blocks
Thirty-five fresh frozen PTC tissues with matched normal thyroid tissues and 8 nodular hyperplasia (NH) tissues were used for metabolite measurements. An additional 23 fresh frozen PTC tissues and 6 normal tissues were used for analyzing messenger RNA (mRNA) or protein expression of PHGDH and stem cell markers. All these tissues were from the Asan Bio Resource Center, Seoul, Korea. Data on the clinicopathological characteristics of patients were also retrieved. Formalin-fixed, paraffin-embedded (FFPE) tissues from surgically removed thyroid samples were collected from the archives between 1996 and 2012 at the Asan Medical Center. They comprised 160 classical PTCs, 153 matched normal thyroid tissue specimens, and 25 anaplastic thyroid cancers (ATCs) from 185 patients. An experienced pathologist (D.E.S.) reviewed the histopathology and immunohistology of the thyroid cancer specimens. The FFPE tissues were arrayed by using a tissue-arraying instrument (MTAII; Beecher Instruments, Silver Spring, Sun Prairie, WI); two core samples were retrieved from each donor block, as previously described (11). This study protocol was approved by the institutional review board of the Asan Medical Center.
Metabolite measurements in fresh frozen tissues
Approximately 50–100 mg of tissue was homogenized by using TissueLyzer (Qiagen) with 400 μL of chloroform/methanol (2:1 ratio). The homogenate was incubated for 20 minutes at 4°C. Glutamine-13C5, a surrogate internal standard, was added to the sample after incubation, and it was mixed. The sample was centrifuged at 13,000 rpm for 10 minutes using Eppendorf Centrifuge 5424 (Eppendorf, Hambrug, Germany). After collecting the supernatant, 100 μL of H2O was added. The sample was mixed vigorously and centrifuged at 4000 rpm for 20 minutes. The upper aqueous phase was removed and dried under a vacuum. The dried sample was stored at −20°C and reconstituted with 40 μL of H2O/acetonitrile (50/50 v/v) before LC-MS/mass spectrometry (MS) analysis. Metabolites were analyzed by using LC-MS/MS (1290 HPLC [Agilent]/QTRAP 5500 [AB Sciex]) equipped with a reverse-phase column (Synergi fusion RP 50 × 2 mm). Three microliters of sample was injected into the LC-MS/MS system and ionized with a turbo spray ionization source. Further, 5 mM ammonium acetate in H2O and 5 mM ammonium acetate in acetonitrile were used for mobile phases A and B, respectively. The separation gradient was performed as follows: hold at 0% B for 5 minutes, 0–90% B for 2 minutes, hold at 90% for 8 minutes, 90–0% B for 1 minute, and hold at 0% B for 9 minutes. The LC flow was 70 μL/min (except for 140 μL/min between 7 and 15 minutes), and column temperature was maintained at 23°C. Multiple reaction monitoring was used in the negative ion mode, and the extracted ion chromatogram (EIC) corresponding to the specific transition for each metabolite was used for quantitation. The area under the curve of EIC was normalized to that of the EIC of the internal standard. After normalization, glucose metabolite levels were renormalized by the amount of glucose in normal thyroid tissues and shown as a relative ratio.
mRNA expression analysis
The mRNA expression of PHGDH, phosphoserine aminotransferase 1 (PSAT1), and phosphoserine phosphatase (PSPH) was analyzed by using quantitative real-time polymerase chain reaction (PCR) in 35 fresh frozen thyroid PTC tissues and matched normal thyroid tissues. The mRNA expression of KLF4, Oct4, Sox-2, and Nanog was also analyzed by quantitative real-time PCR in cell lysates (BCPAP, 8505C, and Nthy-Ori 3.1). Total RNA was isolated by using TRIzol® RNA isolation reagents (Invitrogen, Thermo Fisher Scientific, Waltham, MA). Complementary DNA (cDNA) preparation was performed by using a RevertAid First-Strand cDNA Synthesis Kit (Fermentas, Thermo Fisher Scientific) with 1 μg of RNA for each sample. Each reaction mixture contained 1.0 μL of cDNA, 12.5 μL of QuantiFast SYBR Green PCR mixture, 1.0 μL of RNAse-free water, and 10 pM of each primer in a final volume of 25 μL. The real-time quantitation of RNA expression was performed by using the 7500 Fast Real-Time PCR System (Applied Biosystems, Foster City, CA). Overall, 18S ribosomal RNA was used as the internal control and expression of each gene was normalized by the value. The primers used are shown in Supplementary Table S1. The amplification protocol comprised denaturation at 95°C for 10 seconds, followed by 40 cycles of annealing at 60°C for 30 seconds.
Cell culture
The BCPAP originating from PTC with a BRAFV600E mutation, 8505c cells originating from ATC with a BRAFV600E mutation, and Nthy-Ori 3.1 thyroid cells originating from normal thyroid follicular cells were used in the experiments. The BCPAP and 8505c cells were purchased from DSMZ-German Collection of Microorganisms and Cell Cultures GmbH (Braunschweig, Germany), and Nthy-Ori 3.1 was purchased from the European Collection of Authenticated Cell Cultures (Salisbury, UK). These cell lines were authenticated by short tandem repeat profiling. All cell lines were maintained in RPMI 1640 (GIBCO, Grand Island, NY) containing 10% fetal bovine serum at 37°C in 5% carbon dioxide. Media were changed every 2 to 3 days, and subculturing was performed when the cells reached ∼80% confluency.
Knockdown of PHGDH by small hairpin RNA
We made small hairpin RNA (shRNA)-expressing lentiviral vectors by using BLOCK-iT™ Pol II miR RNAi Expression Vector Kits and BLOCK-iT HiPerform Lentiviral Pol II miR RNAi Expression system with EmGFP (Thermo Fisher Scientific). The shRNA transfection was performed with two different sequences. The target sequences were CTTAGCAAAGAGGAGCTGATA (TRCN0000221861, shPHGDH #1) and CGCAGAACTCACTTGTGGAAT (TRCN0000221862, shPHGDH #2) for the human PHGDH gene. For the PHGDH knockdown experiments, BCPAP and 8505C cells were infected with shRNA-expressing lentiviruses of known titers at a multiplicity of infection of 2.5 to 5. The cells were cultured in 12-well plates and infected via a 30-minute spin at 2250 rpm in a Beckman Coulter Allegra X-12R centrifuge with an SX4750 rotor and uPlate Carrier attachment followed by an overnight incubation in polybrene-containing media.
PHGDH plasmid transfection
For the PHGDH overexpression experiments, the pCMV6-empty-myc DDK tagged plasmid (control, PS100001), and pCMV6 PHGDH-myc DDK tagged plasmid PHGDH (RC203949) were purchased from OriGene (Rockville, MD). Nthy-Ori 3.1 cells were transiently transfected by using Lipofectamine 2000 (Invitrogen, Thermo Fisher Scientific) according to the manufacturer's instructions.
Western blot analysis
Thirty to 50 μg of whole cell lysate or mouse and human samples was resolved on NuPAGE gels (Invitrogen, Thermo Fisher Scientific) and transferred to 0.45 μm nitrocellulose membranes (Amersham Bioscience, Piscataway, NJ). The membranes were blocked in tri-buffered saline containing 5% nonfat dry milk and 0.1% Tris-buffered saline with 0.1% Tween 20 (TBS-T) and then incubated with specific antibodies overnight at 4°C. The membranes were washed with TBS-T and incubated with horseradish peroxidase-conjugated secondary antibody for 1 hour. After washing with TBS-T, immunoreactive proteins were detected by enhanced chemiluminescence (Enzo Life Sciences, New York). Expression levels of PHGDH (5 μg/10 mL; ab57030; Abcam, Cambridge, UK), KLF4 (5 μg/10 mL; ab106629; Abcam), Oct4 (1:200; sc-5279; Santa Cruz Biotechnology), Sox-2 (1:1000; 2748; Cell Signaling Technology), and Nanog (1:2000; 4903; Cell Signaling Technology) were normalized to that of glyceraldehyde-3-phosphate dehydrogenase (2.5 μg/10 mL; ab8245; Abcam) or β-actin (1:5000; 4970; Cell Signaling Technology) in each sample.
Cell proliferation assay
The cells were trypsinized, counted, and plated in 24-well plates (5 × 10³ cells/well). After 24 hours, nonattached cells were removed by gently washing twice with phosphate buffered saline (PBS) and were fixed in 500 μL of 10% formalin for 20 minutes. The cells were then stained with 500 μL of 0.1% crystal violet for 20 minutes, and the stained plate was washed with water. The dye was extracted with 500 μL of 10% acetic acid solution for 20 minutes. The bound form of the dye has an absorption spectrum maximum of 595 nm. The increase of absorbance at 595 nm is proportional to the amount of bound dye and the concentration of protein present in the sample. Thus, the relative proliferation index was determined by the absorbance at 595 nm. The 3-(4,5-Dimethylthiazol-2-yl)-2,5-diphenyltetrazolium bromide (MTT) assay was applied to investigate cell proliferation (12). Briefly, MTT reagent was added to each well and incubated at 37°C for 4 hours. The reaction was stopped with the addition of 100 μL of detergent solution followed by incubation at room temperature for 2 hours to being protected overnight from light. Absorbance values were measured at 540 nm.
Clonogenic assay
The transfected cells were plated in 6-well plates at 1 × 10³ cells per well in 2 mL of media. The medium was changed after 24 hours. The cells were incubated for 10 days. The colonies were fixed in 80% ethanol and stained with 0.2% crystal violet. The number of colonies was counted. Dye was extracted with 10% acetic acid, and absorbance was measured at 595 nm.
Tumorigenesis assay
Tumorigenesis formation was examined by using ultralow adherent 96- and 6-well plates. The cells (Nthy-Ori 3.1, BCPAP, 8505C) were initially seeded with 20000 cells per well (6 wells) for further analysis. Media were prepared by using recombinant human epidermal growth factor (Invitrogen, Thermo Fisher Scientific), human fibroblast growth factor (Invitrogen, Thermo Fisher Scientific), B27 supplement (Invitrogen, Thermo Fisher Scientific), and 1% penicillin/streptomycin (Invitrogen, Thermo Fisher Scientific) in RPMI media and changed every 2 to 3 days. Tumorsphere formation MEDIA was also added every 3 days and observed for 10 days. Spheres more than 50 μm in size were quantified and counted at day 10 after taking at least 5 pictures of each condition. The samples were collected for further analysis (real-time PCR, Western blot, or ALDEFLUOR assay) (13).
ALDEFLUOR assay
The protocol was based on the manufacturer's instructions (STEMCELL Technologies). Briefly, the cells were grown by tumorigenesis assay, harvested by using 0.25% trypsin-EDTA (Fisher Scientific), spun for 5 minutes, pelleted, and washed once with PBS. The cells were resuspended in ALDEFLUOR assay buffer at a concentration of 10,000 cells per mL. Two tubes were labeled as the control and the sample. After adding 5 μL of N,N-diethylaminobenzaldehyde inhibitor or 5 μL of activated ALDEFLUOR reagent to the sample tube and mixing, the cells were incubated for 40 minutes at 37°C. After incubation, the cells were pelleted by spinning for 5 minutes and washed once with ALDEFLUOR buffer. The cells were resuspended in 500 μL of ALDEFLUOR buffer and then analyzed by BD FACSAria II flow cytometry.
In vivo mouse xenograft study
All animal procedures and protocols implemented in this study were approved by the Institutional Animal Care and Use Committee of the Asan Institute of Life Sciences, Seoul, Korea. Four-week-old female athymic BALB/c nude mice (Orient Bio, Korea) were used. Control transfected 8505c cells and shRNA-transfected 8505C cells (shPHGDH #1 and #2) were prepared, and 5 × 10⁶ cells in 200 μL of suspension mixture with Matrigel (BD Biosciences, San Jose, CA) were subcutaneously inoculated into the right flank of the mice. Eighteen mice were randomly divided into three groups (control, shPHGDH #1, and #2). Body weight and tumor size were monitored twice weekly. Tumor size was measured with calipers, and tumor volume was calculated as length × width2/2. Tumor weight was determined after dissecting the tumor tissues from euthanized mice at the study endpoint. The tumor tissues were fixed and dissected for immunohistochemical (IHC) staining of PHGDH with anti-PHGDH antibodies (1:100; Abcam, Cambridge, UK) and anti-Oct4 antibodies (1:100; sc-5279; Santa Cruz Biotechnology).
Reagents
RNeasy Mini kits, QuantiFast SYBR Green PCR kits, and QIAamp DNA FFPE tissue kits were purchased from QiaGENE (Valencia, CA). A RevertAid First-Strand cDNA Synthesis Kit was purchased from Fermentas (Thermo Fisher Scientific). Media and cell culture reagents were purchased from GIBCO. BrdU cell proliferation ELISA kit was purchased from Roche (Mannheim, Germany). A PHGDH inhibitor (NCT 503), which inhibits PHGDH activity, was purchased from Sigma (St. Louis, MO).
IHC analysis and PHGDH protein expression
The degree of PHGDH protein expression was evaluated by IHC staining with anti-PHGDH (ab57030; Abcam) antibody. IHC staining was performed on tissue microarray sections, using a BenchMark XT automated immunostaining device (Ventana Medical Systems, Tucson, AZ) with the OptiView DAB IHC Detection Kit (Ventana Medical Systems) (11). The nuclear staining intensity was graded semi-quantitatively by experienced pathologists: 0, negative; 1+, weak; 2+, moderate; and 3+, strong. The sample with intensity scores higher than two positive points was classified as having positive PHGDH protein expression.
TCGA data analysis
A public transcriptome database of TCGA-thyroid cancer (THCA) (
Statistical analyses
Categorical variables are presented as numbers and percentages, and continuous variables are expressed as means with standard deviations or medians with interquartile ranges. Comparisons of continuous variables were performed by using the Student's t-test. Comparisons between each group for categorical variables were performed by using Fisher's exact test. The statistical significance between three or more groups was analyzed by using a one-way or two-way analysis of variance (in vivo mouse xenograft models). The data were analyzed by using SPSS statistics version 19.0 (SPSS, Inc., Chicago, IL). All p-values were two-sided, with p < 0.05 considered statistically significant. GraphPad Prism version 5.01 (GraphPad Software, Inc., San Diego, CA) was used to draw graphs.
Results
Metabolite analysis involving glucose metabolism in thyroid cancer
First, we analyzed the metabolite levels involving glucose metabolism by using 35 fresh frozen PTC tissues and compared those with matched normal thyroid tissues and 8 NH tissues. The clinicopathological characteristics of the 35 PTC patients are presented in Supplementary Table S2. The mean patient age was 47 years, and ∼23% were male. The mean tumor size was 2.5 cm, and 89% showed extrathyroidal extension (ETE) of the tumor. Approximately 71% had cervical lymph node (LN) metastasis.
In the glycolytic pathway (Fig. 1A), glucose, glucose 6-phosphate/fructose-6-phosphate, fructose-1, 6-bisphosphate, pyruvate, and lactate levels of PTCs were significantly higher than those of the matched normal thyroid or NH tissues. However, 3-phosphoglycerate (3PG) levels, an intermediate metabolite for serine synthesis, did not differ between PTCs and normal or NH tissues. Citrate/isocitrate was significantly lower in PTCs than in normal or NH tissues in the tricarboxylic acid (TCA) cycle (Fig. 1B). However, other metabolites, including α-ketoglutarate, succinate, fumarate, and malate, were higher in PTCs than in normal or NH tissues.
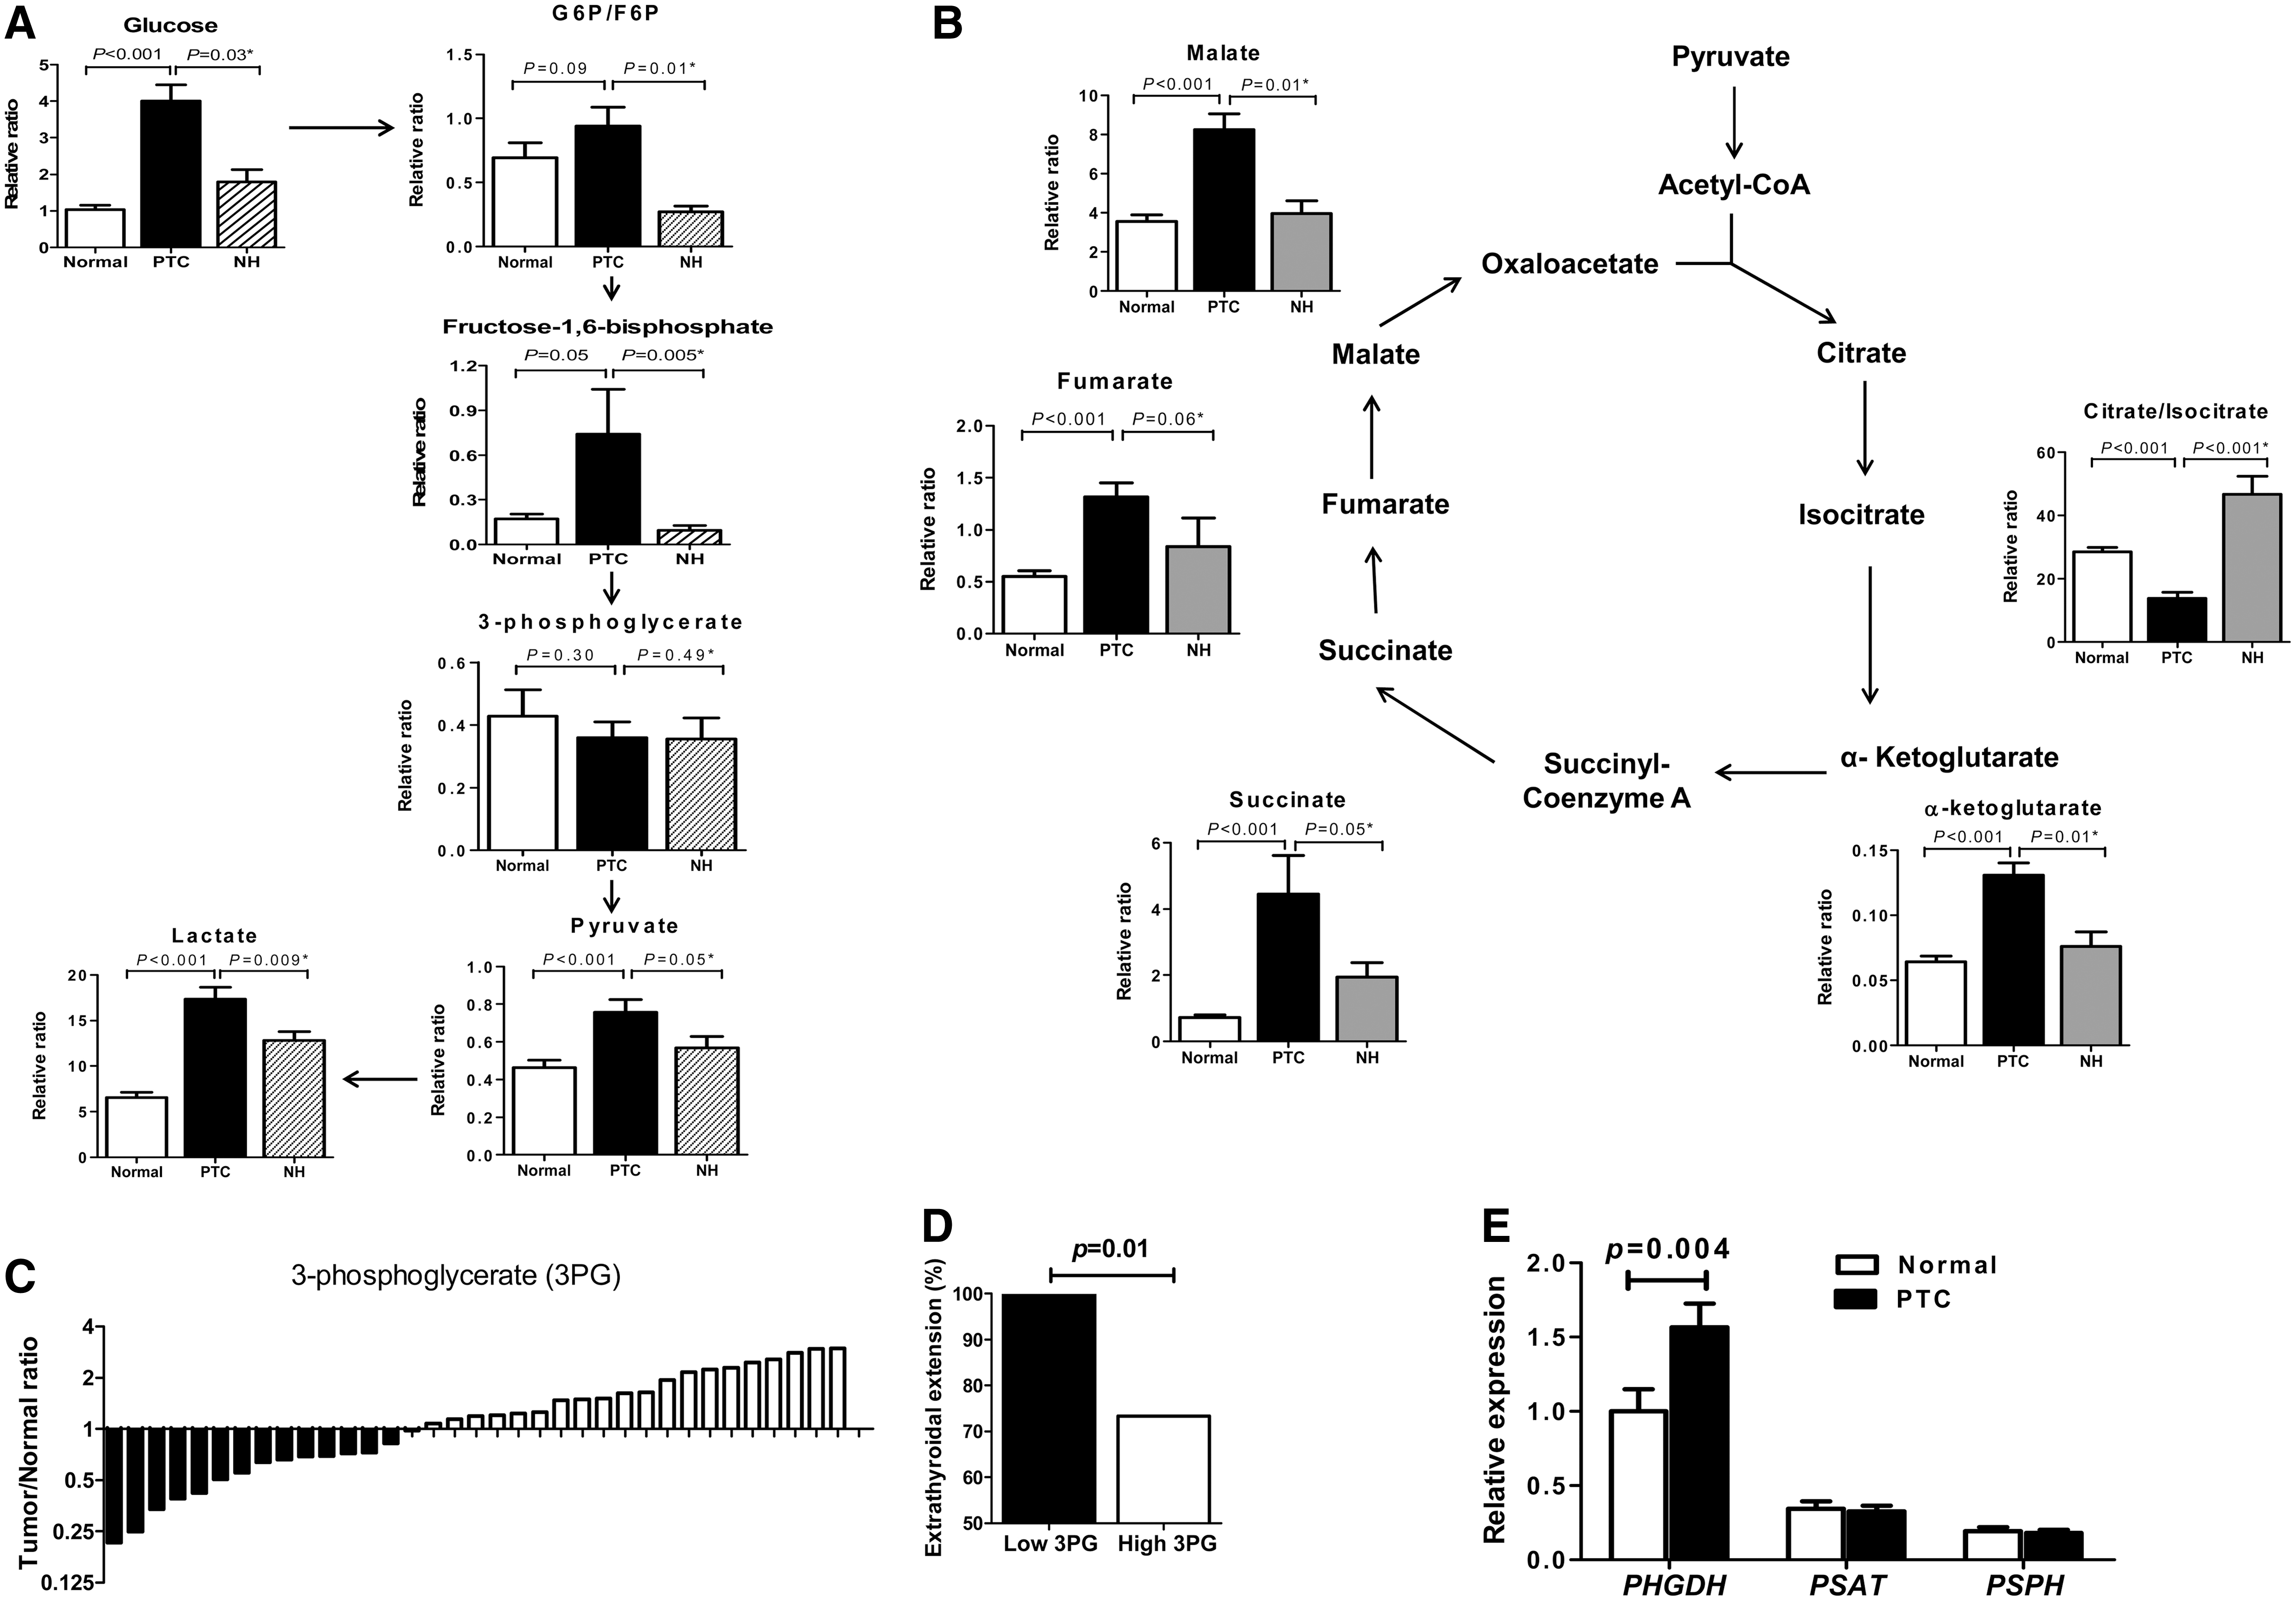
Metabolite analysis involving glucose metabolism in thyroid tissues (
The lack of 3PG increase in PTCs was a metabolic change that drew our interest, which suggests that 3PG consumption is increased in PTCs. We further analyzed the association of 3PG levels with clinicopathological characteristics of PTC. In terms of the tumor to normal ratio for 3PG levels, the 3PG ratio varied among PTCs; PTCs with a low 3PG ratio were significantly associated with the presence of ETE (Fig. 1C, D). The glycolytic intermediate 3PG is well known to be converted to serine after a three-step enzymatic reaction through PHGDH, PSAT1, and PSPH. Thus, to confirm that increased 3PG consumption is associated with serine synthesis pathway activation, we determined the expression of these enzymes for serine synthesis by real-time PCR. PHGDH mRNA expression was significantly higher in PTCs than in matched normal tissues (Fig. 1E), but the expression of the other two enzymes (PSAT1 and PSPH) did not differ between PTCs and matched normal tissues.
PHGDH is essential for cell proliferation and tumorigenesis
To address the role of PHGDH in thyroid cancer cells, we used an shRNA-induced PHGDH knockdown model. PHGDH expression was suppressed by both shPHGDH #1 and #2 by Western blot analysis in both BCPAP and 8505C cells (Supplementary Fig. 1A). PHGDH knockdown by both shPHGDH #1 and #2 in BCPAP and 8505C cells markedly reduced cell viability from days 2 to 6 (Fig. 2A, p < 0.05). It also significantly inhibited the colony formation of 8505C cells (Fig. 2B, p < 0.01).

PHGDH is essential for cell proliferation and tumorigenesis. (
Next, we tested the effect of the PHGDH inhibitor (NCT503) on cell proliferation and colony formation of BCPAP and 8505C cell lines. According to the results of the MTT assay, we fixed the concentration of NCT503 as 15 μM (Supplementary Fig. 1B). NTC503 treatment in both thyroid cancer cell lines markedly reduced cell viability from days 3 to 5 (Fig. 2C, p < 0.05) and colony formation (p < 0.01 for BCPAP and p < 0.001 for 8505c).
We investigated the effect of PHGDH on tumorsphere formation (Fig. 2E, F). After PHGDH knockdown, BCPAP cells showed a statistically significant decrease in the number of tumorspheres at day 10 compared with the control group (Figs. 2E, p < 0.05). The significantly reduced PHGDH protein expression in shPHGDH #2-transfected BCPAP cells at day 10 was confirmed (Supplementary Fig. 1C). Similar results were obtained when we compared tumorsphere formation between vehicle treatment and NCT503 treatment in BCPAP and 8505C cells (Fig. 2F, p < 0.01).
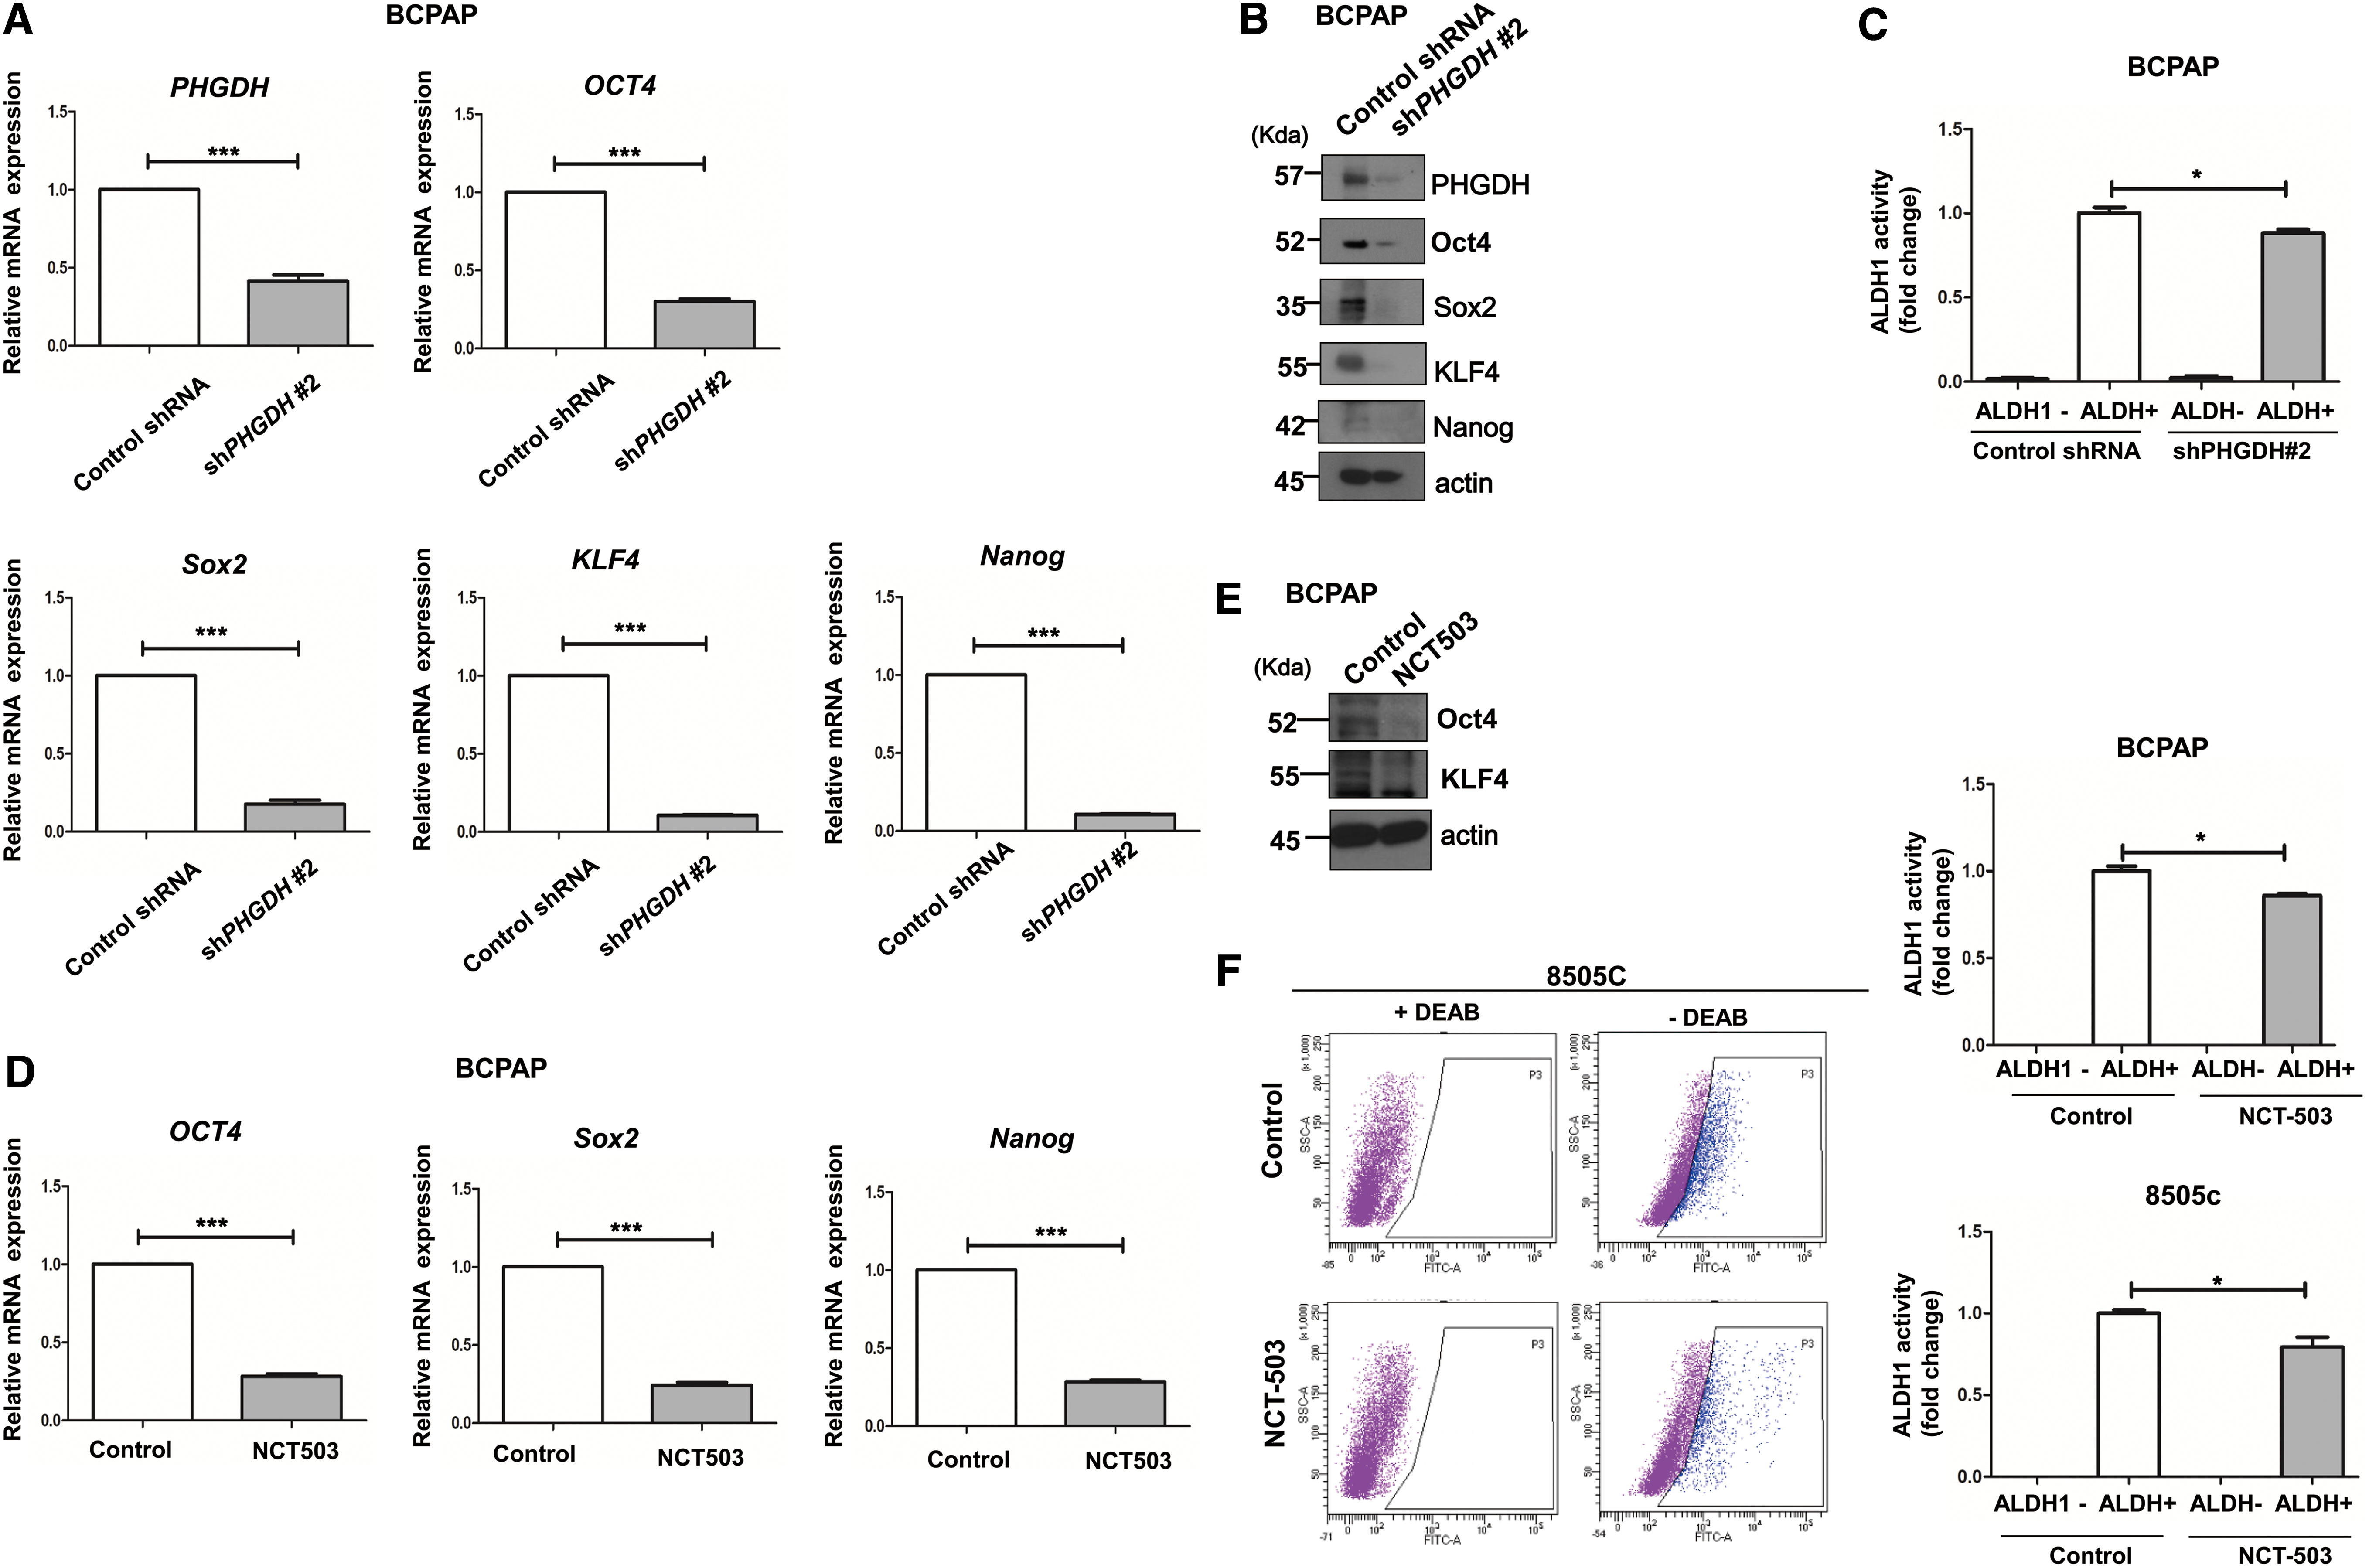
PHGDH expression is associated with thyroid cancer cell stemness
Tumorsphere formation is known to be associated with the stemness of cancer cells (15,16). Therefore, we examined changes in the mRNA and protein levels of cancer stem cell markers. When we analyzed the mRNA and protein changes of PHGDH and pluripotency transcription factors including Oct4, Sox2, KLF4, and Nanog in BCPAP cells collected after 10 days of tumorsphere assays, shPHGDH #2-transfected cells clearly showed significantly lower mRNA expression of PHGDH and Oct4, Sox2, KLF4, and Nanog, compared with the control group (Fig. 3A). A significant decrease in protein expression of these stem cell markers in the shPHGDH #2 group was observed by Western blot analysis (Fig. 3B). These changes were all statistically significant (Supplementary Fig. 2A, p < 0.001). Aldehyde dehydrogenase 1 (ALDH1) activity was examined via ALDEFLUOR assay. There was a significant decrease in ALDH1 activation in the shPHGDH #2 group compared with the control group (Fig. 3C, p < 0.05). Next, we examined the changes in stem cell markers after NCT503 treatment. Significant decreases in mRNA expressions of Oct4, Sox2, and Nanog were observed in the NCT503-treated group (Fig. 3D, p < 0.001). In addition, significant decreases in the protein expression of Oct4 and KLF4 in the NCT503-treated group were observed by Western blot analysis (Fig. 3E); these differences were statistically significant (Supplementary Fig. 2B, p < 0.001). NCT503 treatment of 8505c cells also showed similar results (Supplementary Fig. 3A, B). BCPAP cells in the NCT503-treated group showed a significant decrease in ALDH1 activation compared with the control group (Fig. 3F, p < 0.05). Similar results were seen in 8505c cells (p < 0.05).
PHGDH is associated with stemness in thyroid cancer cells. (
We analyzed changes in the cell proliferation and mRNA or protein expression of stem cell markers after PHGDH overexpression to confirm the association between PHGDH and stemness. For this experiment, we used Nthy-Ori 3.1 cells that originated from human normal follicular epithelial cells. The basal protein expression levels of PHGDH in thyroid cell lines used in the experiments was examined, and Nthy-Ori 3.1 cells showed the lowest protein expression of PHGDH compared with BCPAP and 8505c cells (Supplementary Fig. 3C). A significant increase in cell proliferation was observed in Nthy-Ori 3.1 cells overexpressing PHGDH compared with control; this difference was statistically significant at day 5 (Fig. 4A, p < 0.05). The colony formation assay also showed a statistically significant increase at day 7 in Nthy-Ori cells overexpressing PHGDH (Fig. 4B, p < 0.05). In stem cell marker expression analysis, significant increases in mRNA level of PHGDH and the stem cell markers (Oct4, KLF4, Sox2 and Nanog) were observed in PHGDH overexpression (Fig. 4C). Western blot analysis confirmed significant increases in the protein expression of PHGDH, Oct4, and Nanog in Nthy-Ori overexpressing PHGDH (Fig. 4D, E, p < 0.05).

PHGDH Overexpression increases cell proliferation and stemness. (
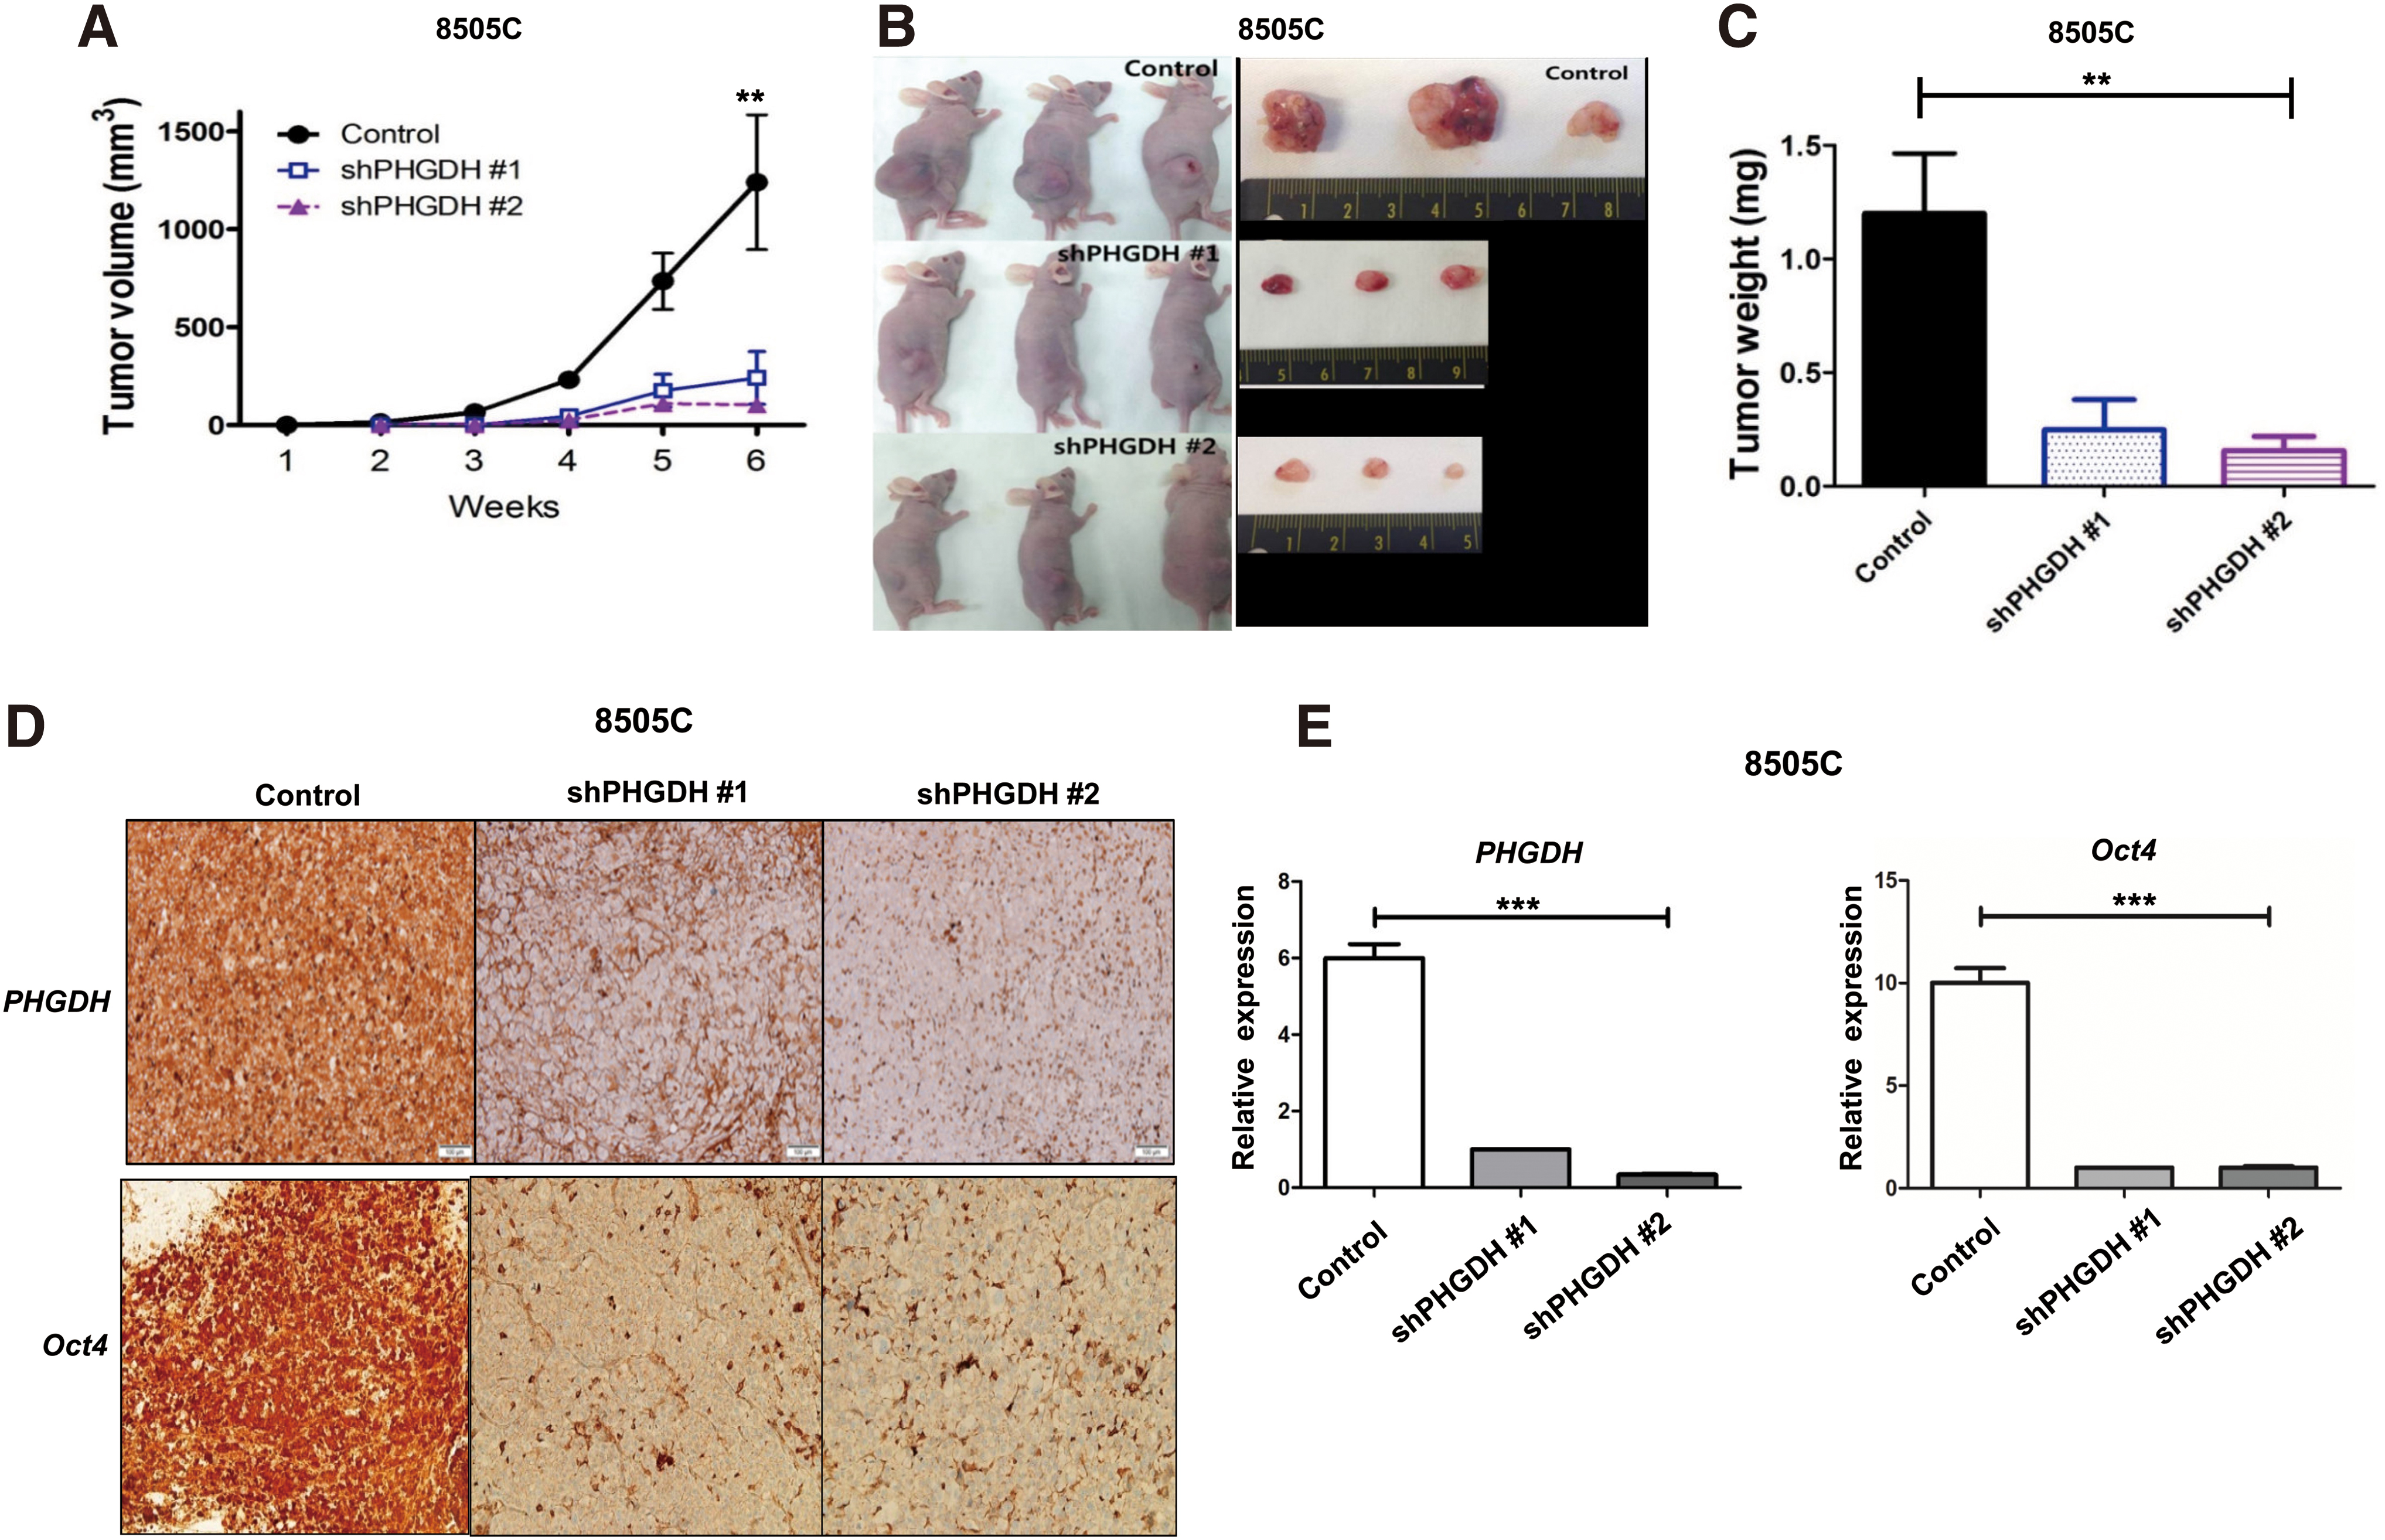
PHGDH knockdown inhibits tumor growth in mouse xenograft models
To confirm the role of PHGDH in cancer cell proliferation, we evaluated the effect of PHGDH knockdown on tumor growth by using in vivo mouse xenograft models. The tumor volume, induced by shRNA-transfected 8505C cells (shPHGDH #1 and #2), was significantly reduced compared with the control (Fig. 5A, B, p < 0.01). Tumor weight, measured at endpoint, was also significantly decreased after PHGDH knockdown compared with control (Fig. 5C, p < 0.01). In the samples where PHGDH was inhibited (shPHGDH #1 and #2), Oct4 protein expression was suppressed in the Western blot analysis (Supplementary Fig. 4A, B) and IHC staining (Fig. 5D). The quantification of IHC results also confirmed the decrease in protein expression of PHGDH and Oct4 in tumor tissues induced by shPHGDH #1- or shPHGDH #2-transfected 8505c cells (Fig. 5E, p < 0.001).
Tumor growth in mouse xenograft model after PHGDH knockdown (
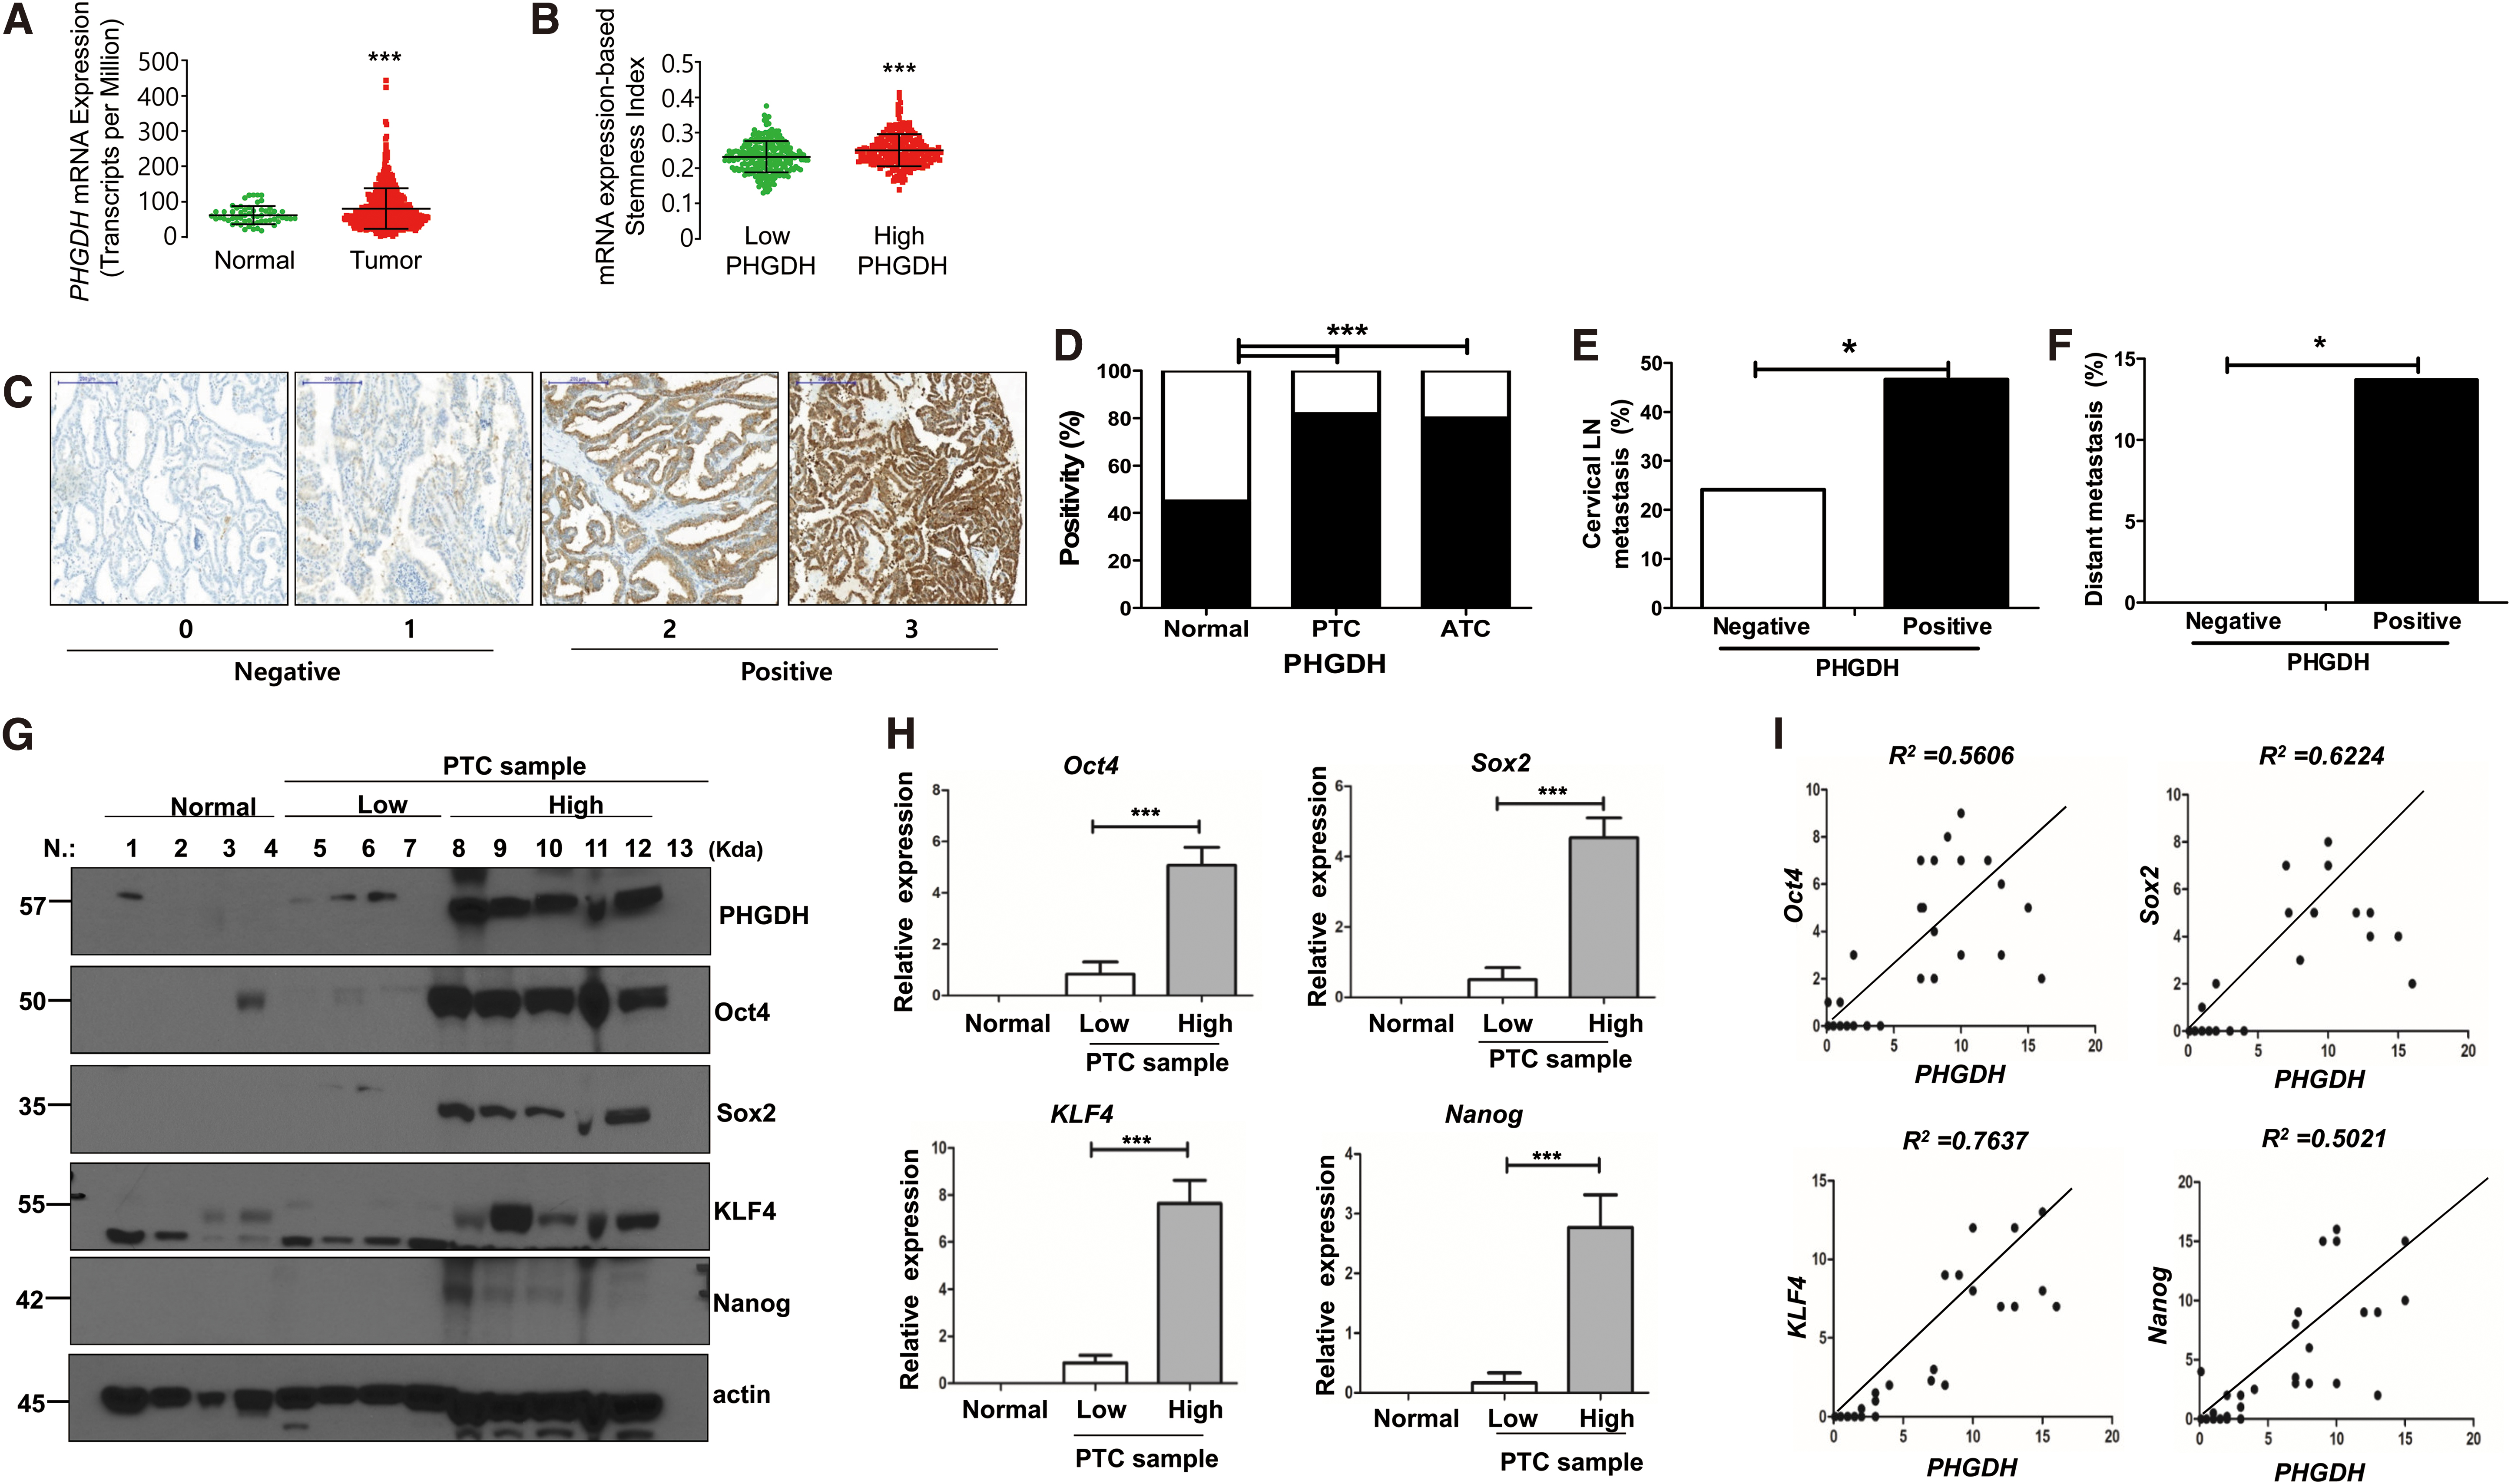
PHGDH is associated with stemness or aggressive characteristics of thyroid cancer
Analysis of the TCGA-THCA data showed that PHGDH mRNA expression was significantly higher in tumors than in normal thyroid tissues (Fig. 6A, p < 0.001). To confirm the positive relationship between PHGDH and cancer stemness, we compared mRNAsi that was generated by machine-learning algorithms between low and high PHGDH tumor groups in TCGA-THCA (14). Consistent with the experimental analyses, the high PHGDH group showed higher levels of mRNAsi than the low PHGDH group (Fig. 6B, p < 0.001).
The relationship between PHGDH and stem regulators or aggressive clinicopathological characteristics of thyroid cancer. (
We next analyzed the protein expression of PHGDH in various thyroid tissues and the association between PHGDH protein expression and clinicopathological characteristics of PTCs. Figure 6C shows representative images of IHC stain results. The positivity of PHGDH protein expression was significantly higher in PTCs or ATCs than in matched normal thyroid tissues (Fig. 6D, p < 0.001). PHGDH protein expression was positive in 45% of normal tissues, 82% of PTCs, and 80% of ATCs. These findings are consistent with TCGA-THCA analysis results. When we compared various clinicopathological characteristics of patients according to enzyme expression, positive PHGDH protein expression was significantly associated with the presence of cervical LN metastasis and distant metastasis (Fig. 6E, F). Detailed baseline clinicopathological characteristics of patients with 160 PTCs examined are presented in Supplementary Table S2.
Finally, Western blot analysis was performed to examine the expression of stem cell markers associated with PHGDH expression in human samples. We used 29 fresh frozen human thyroid tissues, including 6 normal tissues and 23 PTC tissues. The representative Western blot results are presented in Figure 6G. The expression of PHGDH and stem cell markers was low in normal tissues compared with the PTC tissue samples. PHGDH expression was variable in the PTC samples, and the PTC samples were arbitrarily divided into high and low PHGDH expression groups according to the results of the Western blot analysis. The expression of stem cell markers (Oct4, Sox2, KLF4, and Nanog) in the PTC samples was associated with PHGDH expression, and the high PHGDH expression group showed a high expression of all stem cell markers (Fig. 6G). When quantified, this association was statistically significant (Fig. 6H, p < 0.001). We also found a relatively high correlation between PHGDH and the major pluripotency transcription factors: Oct4 (R2 = 0.5606), Sox2 (R2 = 0.6224), KLF4 (R2 = 0.7637), and Nanog (R2 = 0.5021) (Fig. 6I).
Discussion
Although PTC is known as an indolent cancer, PTC tissues present specific changes in glucose metabolism compared with benign or normal thyroid tissue (7,17). First, PTCs had aerobic glycolysis features. Most metabolites in the glycolytic pathway, including lactate, were higher in PTCs compared with the matched normal tissues or benign tissues. Citrate/isocitrate, the first metabolic intermediate in the TCA cycle, was lower in PTCs than in other tissues, suggesting the decreased influx into the TCA cycle, and increased consumption of citrate/isocitrate for fatty acid synthesis in PTCs. Second, although there were lower levels of citrate/isocitrate in PTCs, α-ketoglutarate levels were significantly higher in PTCs, suggesting the increased influx of glutamine in PTCs, similar to other cancers (18). The most fascinating change in glucose metabolism in PTC is that the 3PG level does not differ according to tissue type. The large amount of 3PG may be converted to other pathways, such as the serine synthesis pathway (17). In fact, expression of PHGDH, the enzyme involved in the first step in the serine synthesis pathway, was significantly higher in PTCs than in normal or benign tissues. These results noted that serine biosynthesis was activated in PTCs due to increased PHGDH expression. It is well known that PSAT1 converts 3-phophohydroxypyruvate into 3-phosphoserine during serine synthesis by glutamate-dependent transamination reaction (Supplementary Fig. 5) (17,19), and increased α-ketoglutarate levels in the TCA cycle in our metabolomics analysis might also be associated with activated serine biosynthesis. Our findings were also consistent with a previous study that revealed increased expression of serine/glycine metabolism-related protein in poorly differentiated thyroid cancer and PTCs (20). Thus, this study was conducted to understand how PHGDH affects thyroid cancer.
In in vitro experiments, PHGDH inhibition by knockdown or treatment with NCT503 suppressed thyroid cancer cell growth, colony formation, and tumorosphere formation. PHGDH overexpression increased thyroid cell growth. Xenograft tumor growth was also inhibited after PHGDH knockdown. We hypothesized that the effect of PHGDH on growth and tumor formation in thyroid cancer cells might be related to cancer stem cell markers. In fact, PHGDH inhibition decreased the expression of various stem cell markers and vice versa for PHGDH overexpression. This association between PHGDH expression and stem cell markers was confirmed by TCGA-THCA mRNA expression data and human thyroid cancer tissue analyses. Clinically, PHGDH expression was significantly increased in both PTCs and ATCs compared with normal tissues, and there was a significant association between cervical LN and distant metastasis of PTC and high PHGDH expression. Our findings suggest that PHGDH induced thyroid cancer cell proliferation and tumor formation by regulating the stemness of cancer cells; moreover, PHGDH was associated with thyroid cancer aggressiveness. We believe this is the first study to confirm the role of PHGDH in controlling stemness in thyroid cancer.
The importance of PHGDH in cancer was first noted in 2011 by David Sabatini, who revealed that PHGDH increased cancer proliferation by contributing to the increase in glutamine influx into the TCA cycle in estrogen receptor negative breast cancer (19). PHGDH has also been reported to be closely associated with poor prognosis in many cancers (21 –23). However, a few studies have analyzed the detailed mechanism of how PHGDH affects cancer. Some recent studies showed the association between PHGDH and the activation of stem cell characteristics. One study reported that both breast cancer stem cells and PHGDH mRNA expression were induced by intratumoral hypoxia through the activation of hypoxia-inducible factor. PHGDH was required for the survival of hypoxic breast cancer cells, and PHGDH knockdown suppressed hypoxia-induced stem cell enrichment and increased the sensitivity of breast cancer cells to chemotherapy (24). Another study reported that PHGDH deficiency impairs tumorsphere formation in various stem-like cells with reduced expression of Oct4, Nanog, and Sox-2 (25). Considering these results, PHGDH is believed to be abnormally activated during cancer progression and induces stemness. The detailed mechanism on how PHGDH regulates stemness is not yet clearly elucidated. One previous study suggested that PHGDH regulates stemness through post-translational modifications. In that study, PHGDH inhibition increased the ubiquitination and degradation of Oct4 (25). Further studies are needed.
Our results clearly show that PHGDH modulates the prognosis of thyroid cancer by regulating stem cell marker expression. We showed a significant correlation between the expression of PHGDH and cancer stem cell markers such as Oct4, Nanog, and Sox-2 and the aggressiveness of thyroid cancer. A study that used transcriptomic and epigenetic data revealed that stemness index was increased in undifferentiated and metastatic tumors and the Sox2-Oct4 complex served as a master of stemness (14). Our results indicate that PHGDH might be an important factor controlling the Sox2-Oct4 master complex of stemness in thyroid cancer and might be a candidate prognostic and therapeutic target for thyroid cancer.
One previous preclinical study demonstrated the efficacy of a PHGDH inhibitor (NCT503) for cancer treatment (26). In that study, the investigators identified a small-molecule PHGDH inhibitor via a quantitative high-throughput screening; NCT503 treatment was effective in PHGDH-dependent cancer cells in culture or in orthotopic xenograft tumors by inhibiting PHGDH activity noncompetitively. We used this compound in our in vitro experiments and confirmed that NCT503 treatment reduced the expression of stem cell markers and reduced thyroid cancer cell proliferation. Our preclinical findings suggested that targeting PHGDH could be a promising therapeutic strategy in refractory PTC and ATC.
The clinical significance of our findings is that PHGDH might regulate stem cell genes and metabolic changes during thyroid cancer progression. This is clinically noteworthy, because PHGDH can directly control cancer prognosis and stem cell gene activation is specifically observed in aggressive cancers. Abnormal PHGDH activity in thyroid cancer appears directly related to local enhanced tumor cell survival, invasiveness potential, and metastasis. Therefore, measuring PHGDH levels early in thyroid cancer can help identify tumors that might progress to aggressive cancer that requires proper management.
In conclusion, PHGDH expression might regulate stemness in thyroid cancer, especially PTC and ATC, and might be important in determining the prognosis of PTC patients. Our findings strongly suggest that PHGDH is a potential therapeutic target for thyroid cancer.
Footnotes
Acknowledgments
The biospecimens and data used in this study were provided by the Asan Bio-Resource Center, Korea, Biobank Network [2014-5(74)]. Some data of this study were included in a doctoral thesis of Ji Min Han.
Authors Disclosure Statement
No competing financial interests exist.
Funding Information
This study was supported by the National Research Foundation of Korea Research Grant (NRF-2017R1D1A1B03028231). The funding source had no involvement in the collection, analysis, and interpretation of data or writing of the article.
Supplementary Material
Supplementary Table S1
Supplementary Table S2
Supplementary Figure S1
Supplementary Figure S2
Supplementary Figure S3
Supplementary Figure S4
Supplementary Figure S5