
Abstract
Background:
[18F]-Fluorodeoxyglucose (FDG)-avid thyroid lesions incidentally detected on positron emission tomography/computed tomography (PET/CT) scans represent a tumor lesion in about 30% of cases. The present study evaluated the ability of PET metrics and radiomics features to predict final diagnosis of [18F]FDG thyroid incidentalomas (TIs).
Methods:
A total of 104 patients with 107 TIs were retrospectively studied; 30 nodules (28%) were diagnosed as malignant. After volumetric segmentation of each thyroid lesion, metabolic tumor volume (MTV), total lesion glycolysis (TLG), standardized uptake values (SUVs), and metabolic heterogeneity were estimated, and 107 radiomics features were extracted following a standard protocol.
Results:
MTV, TLG, SUVmax, SUVmean, and SUVpeak among functional PET parameters, and gray-level co-occurrence matrix (GLCM)_InverseDifferenceMoment, shape_Sphericity, GLCM_SumSquares, firstorder_Maximum2DDiameterSlice, firstorder_Energy, and GLCM_Contrast among nonredundant radiomics features, showed significantly different values between malignant and benign TIs (Mann–Whitney U-test, p < 0.01 for all). Univariate logistic regression revealed that these parameters demonstrated good ability to predict final diagnosis of TIs (p < 0.02 for all). Shape_Sphericity was the best predictor classifying 82% of TIs correctly (p < 0.0001). Only TLG, SUVmax, and shape_Sphericity retained significance (p < 0.0001) by multivariate analysis. Malignant lesion prevalence increased from 7% to 100% in accordance with the number (score, 0–3) of the three positive parameters present (χ2 trend, p < 0.0001). A score of 0 excludes malignant TIs with a negative predictive value of 93%, while a score of 3 predicted malignancy with a positive predictive value of 100%.
Conclusions:
PET metrics and radiomics analysis can improve identification of [18F]FDG-avid TIs at high risk of malignancy. A model based on TLG, SUVmax, and shape_Sphericity may allow prediction of a final diagnosis, providing useful information for the management of TIs.
Introduction
Incidentally discovered [18F]-
International clinical guidelines strongly recommend use of fine-needle aspiration cytology to ascertain [18F]FDG-avid TIs greater than 1 cm in greatest diameter (5). However, the prognosis of oncology patients is dictated by the underlying malignancy rather than by incidentally detected thyroid cancers in most cases. Accordingly, the costs, risks, and anxiety associated with incidentally detected [18F]FDG-avid thyroid carcinomas should be carefully balanced by primary malignancy (18 –20).
Accurate PET-derived criteria would be helpful to directly stratify the malignancy risk of [18F]FDG-TIs during PET/CT interpretation and reduce the need for further evaluation and the associated risks, costs, and patient discomfort. Recent preliminary data have suggested that heterogeneous [18F]FDG uptake within thyroid nodules (i.e., “metabolic heterogeneity”) and PET/CT texture analysis are promising approaches to stratify the risk of a malignant nodule in patients with [18F]FDG-avid incidentalomas, refine selection of patients for cytology referral, and reduce the need for further investigations (21 –23). The present study investigated the role of PET-derived parameters and radiomics features to characterize [18F]FDG-TIs in a large series of patients with cancer and generated a predictive model for discriminating malignant from benign [18F]FDG-TIs based on PET/CT-derived data.
Materials and Methods
Study design and patient selection
Initially, our facility's database was searched for all patients who underwent [18F]FDG-PET/CT due to nonthyroid oncological indications from October 2013 to November 2018. Then, all cases with abnormal thyroid [18F]FDG uptake were retrieved. After exclusion of cases with diffuse [18F]FDG thyroid uptake, patients with focal [18F]FDG uptake were selected. The study inclusion criteria were as follows: (i) a histological diagnosis, (ii) benign cytological report in the absence of postoperative histology, and (iii) scintigraphically confirmed autonomously functioning thyroid nodules that received curative treatment with different modalities (24). All fine-needle aspiration cytology was reported according to the Italian Consensus for the Classification and Reporting of Thyroid Cytology [i.e., TIR1 (inadequate), TIR2 (benign), TIR3 (indeterminate), TIR4 (suspicious for malignancy), and TIR5 (malignancy)] (25).
[18F]FDG-PET/CT image acquisition
[18F]FDG-PET/CT whole-body images were acquired following a standard protocol in accordance with European Association of Nuclear Medicine guidelines (26) using two integrated PET/CT scanners of the same model (both Siemens Biograph mCT 40; Siemens, Erlangen, Germany). Scanning was performed 60 ± 5 minutes after intravenous injection of 3 MBq/kg of [18F]FDG. All patients fasted for at least 6 hours before image acquisition and their fasting blood glucose was <160 mg/dL. CT scans obtained with a low-dose protocol were used for attenuation-correction of PET images. Images were reconstructed with three-dimensional ordered subset expectation maximization iterative algorithms (3 iterations and 21 subsets), including Time-of-Flight and Point-Spread Function corrections.
[18F]FDG-PET/CT metrics
Reconstructed [18F]FDG-PET/CT images were analyzed with dedicated software (MM Oncology,
Radiomics features
Radiomics features were extracted from each segmented volume using PyRadiomics software package version 2.2.0 (37). To standardize the process of extraction, gray-level intensities and voxel dimensions of the original images were preliminary resampled following the Image Biomarkers Standardization Initiative recommendations (38 –41). From the segmented volumes, 107 standardized features evaluating different metabolic characteristics of the lesion were initially extracted. They included 14 shape-based features, 18 first-order statistics features, and 75 matrix-based features [24 gray-level co-occurrence matrix (GLCM), 16 gray-level run length matrix, 16 gray-level size zone matrix, 5 neighboring gray tone difference matrix, and 14 gray-level dependence matrix based]. Meaning and mathematical description of these radiomics features are reported in detail in the PyRadiomics documentation.
The shape-based features measure the dimensions and depict the geometric properties of the lesion. The first-order statistics features describe the presence of areas with statistically different metabolic activity without taking into account their distribution within the lesion, while the matrix-based features analyze spatial distribution of these areas and their mutual relationship. In the last group, the analysis is performed applying multiple mathematical models to the data organized in the form of matrices.
Since the image was acquired with two different scanners, the first analytic step was aimed at evaluating the inter-scanner reproducibility of the radiomics features. For each feature, the distributions of the values extracted by the two sets of images were compared. The features with different distributions were excluded from the final analysis to avoid a potential bias, while those with statistically proved inter-scanner reproducibility were tested as potential predictors of the final diagnosis of TIs.
Reference standard
Malignant lesions described throughout the article were thyroid cancers confirmed by surgical pathology examination. Benign lesions were defined as follows: histologically confirmed benign nodules (42), cytologically benign nodules (25) with clinical and US follow-up ≥3 years, and scintigraphically confirmed autonomously functioning thyroid nodules (43).
Ethics
This retrospective study on existing patient data and images was reviewed and approved by our Advisory Research Board and the Ethic Committee of Canton Tessin, Switzerland (ref. BASEC 2018-00685, CE TI 3351). The requirement for informed consent was waived. All procedures were in accordance with the ethical standards of the 1964 Declaration of Helsinki and its later amendments.
Statistical analyses
Quantitative variables are expressed as medians and interquartile ranges. Medians were compared by the Mann–Whitney U-test. Differences between categorical data frequency were assessed by χ2 test. Reproducible radiomics features were identified by comparing results from the two PET-CT scanners, applying the Mann–Whitney U-test with false discovery rate correction. Nonredundant and uncorrelated radiomics features were selected using the correlation-based feature selection algorithm, a supervised method for reducing the dimensionality. Continuous parameters were analyzed as dichotomized variables using receiver-operating characteristic curves and Youden's coefficient method to estimate the optimal cutoff point for discriminating malignant from benign TIs. Univariate logistic regression analysis was applied to assess the relationship between each parameter and the final diagnosis. Logistic stepwise regression function was used for multivariate analysis. To evaluate the robustness and the generalization of our model and considering the sample size of the study, a 1000-resampled bootstrapping was performed as cross-validation procedure. A p < 0.05 was considered statistically significant. Negative and positive predictive values were calculated. Statistical analyses were conducted using RStudio statistical software package version 1.2.503 (RStudio, Inc., Boston, MA) and MedCalc Statistical Software version 15.8 (MedCalc Software bvba, Ostend, Belgium).
Results
Characteristics of patients
Among the 12,652 consecutive patients who underwent [18F]FDG-PET/CT during the study period, 333 (2.6%) TIs were recorded. After exclusion of cases with diffuse [18F]FDG thyroid uptake patterns (n = 146), 187 (57%) [18F]FDG-TIs were included. According to the selection criteria, 107 focal TIs from 104 patients (67 females and 37 males; median age, 65 years) were selected for the present analysis (Fig. 1). The median thyrotropin was 1.5 mIU/L (0.96–2.1 mIU/L). Lesions had a median size of 17 mm (12–26 mm). As summarized in Table 1, 30/107 (28%) TIs were malignant (26 primary thyroid carcinomas, 1 non-Hodgkin lymphoma, and 3 metastatic lesions from sarcoma, renal, and esophageal cancer, respectively) and 77 (72%) were benign (14 autoimmune thyroiditis, 1 autonomously functioning thyroid nodules, and 62 hyperplastic nodules).
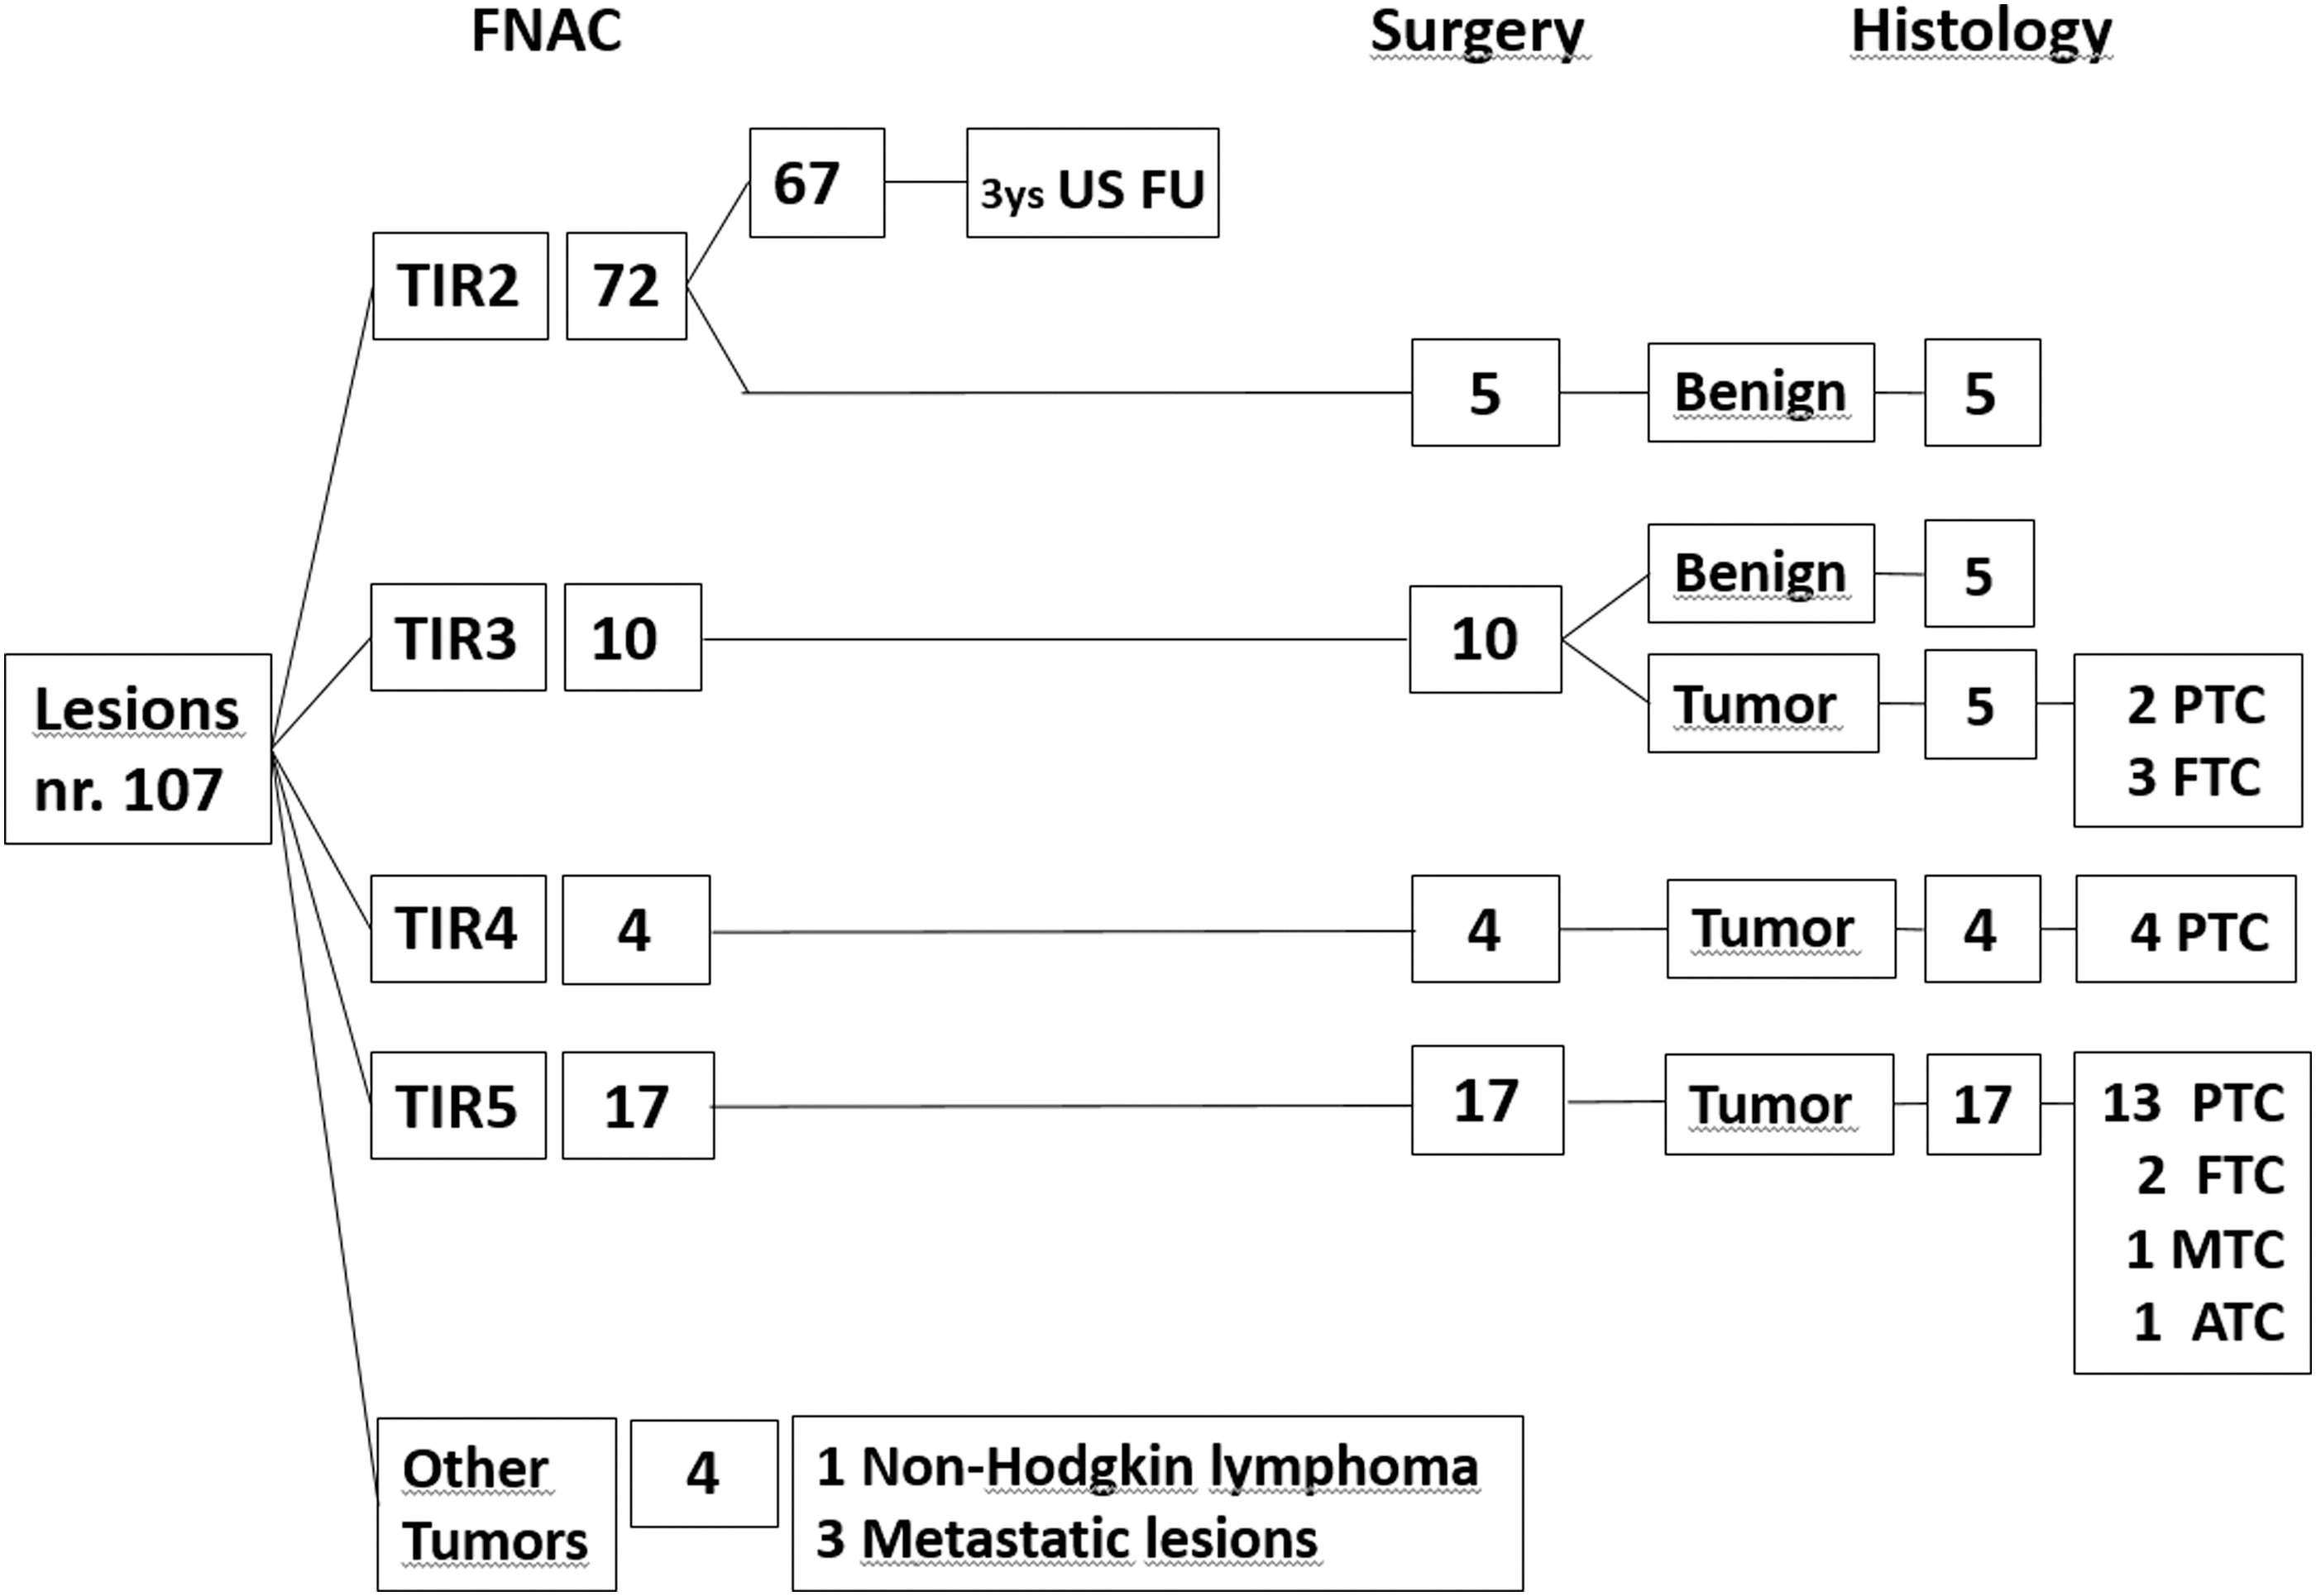
Patient evaluations and results of diagnostic workup. ATC, anaplastic thyroid carcinoma; FNAC, fine-needle aspiration cytology; FTC, follicular thyroid carcinoma; MTC, medullary thyroid carcinoma; PTC, papillary thyroid carcinoma; TIR, FNAC results reported according to the Italian Consensus for the Classification and Reporting of Thyroid Cytology [TIR1 (inadequate), TIR2 (benign), TIR3 (indeterminate), TIR4 (suspicious for malignancy), TIR5 (malignancy)]; US FU: ultrasounds follow-up.
Demographic and Clinicopathologic Characteristics of Patients
Data are expressed as *frequency or **median and interquartile range.
χ2 test for comparison of frequencies, and the Mann–Whitney U-test for comparison of medians.
AFTN, autonomously functioning thyroid nodules; AIT, autoimmune thyroiditis; TSH, thyrotropin; US, ultrasound.
PET metrics and radiomics analysis
Among functional and volumetric PET-derived parameters, MTV, TLG, SUVmax, SUVmean, and SUVpeak values were significantly increased in malignant compared with benign TIs (Table 2). After dichotomization, such parameters reliably predicted the final diagnosis on univariate analysis. TLG was the best predictor, correctly classifying 79% of lesions (univariate logistic regression, p < 0.0001). Specifically, low TLG values were associated with benign lesions and had a negative predictive value of 84%, while higher TLG values had a positive predictive value of 65% for malignant nodules. However, metabolic heterogeneity assessed either by area under the curve-CSH or by coefficient of variation was not associated with the final diagnosis due to the wide overlap of values between the two groups.
Distribution of Positron Emission Tomography Functional Parameters and Nonredundant Radiomics Features in the Two Subgroups of Patients with Benign and Malignant Nodular Disease
Data are expressed as median and interquartile range.
Mann–Whitney U-test.
AUC-CSH, area under the curve-cumulative SUV volume histograms; CV, coefficient of variation; GLCM, gray-level co-occurrence matrix; MTV, metabolic tumor volume; PET, positron emission tomography; SUV, standardized uptake value; TLG, total lesion glycolysis.
Among the 107 extracted radiomics features, only 54 were statistically reproducible between the two PET/CT scanners. Among these, the correlation-based feature selection algorithm selected six nonredundant and uncorrelated radiomics features as potential predictors of the final diagnosis. The six selected features are summarized in Table 2. The shape_Sphericity and the shape_Maximum2DDiameterSlice are two morphological features measuring the degree of spherical shape and the largest dimension in the axial plane of the lesion, respectively.
The firstorder_Energy is a gray-level histogram-based feature measuring the intensity of voxel values (i.e., the metabolic activity) in the image. The GLCM_Contrast, GLCM_InverseDifferenceMoment, and GLCM_SumSquares are three textural features belonging to the group of the GLCM-based features that describe with different tools the degree of metabolic heterogeneity of the TI.
Their ability to distinguish malignant from benign TIs was significant by the Mann–Whitney U-test (Table 2) and univariate logistic regression of dichotomized data (Table 3). Shape_Sphericity had the highest accuracy, correctly classifying 82% of TIs (univariate logistic regression, p < 0.0001). TIs closer to the spherical shape (i.e., with higher values of sphericity) had a lower risk of malignancy with negative predictive values of 82%, while the lack of sphericity identified a tumor lesion with positive predictive value of 82% (Table 3). In multivariate stepwise logistic regression analysis including the previously selected five functional PET parameters and six radiomics features, TLG, SUVmax, and shape_Sphericity retained statistical significance (p < 0.0001; Table 4). The 1000-resampled bootstrapping method validated the multivariate analysis results with an optimism-corrected area under the curve of 0.830 (p < 0.0001).
Positron Emission Tomography Metrics and Radiomics Parameters, Receiver Operator Characteristic Curve Analysis and Univariate Logistic Regression Results
CI, 95% confidence interval; NPV, negative predictive value; OR, odds ratio; PPV, positive predictive value.
Multivariate Analysis (Stepwise Logistic Regression) Results
Results including the five functional PET parameters and six radiomics features that were significant at univariate analysis.
AUC-ROC, area under the curve-receiver operator characteristic.
Multiparametric predictive model
Based on these results, we tested a predictive model integrating the dichotomized TLG, SUVmax, and shape_Sphericity. In this model, four subgroups of lesions were defined by a score from 0 to 3 reproducing the number of positive imaging-derived parameters. This model was accurate for stratifying the risk of TI malignancy (χ2 test, p < 0.0001). The prevalence of malignant TIs increased from 7% (3/41) for lesions with a score of 0 to 21% (9/42), 60% (9/15), and 100% (9/9) for lesions with scores of 1, 2, and 3, respectively (χ2 trend, p < 0.0001). Risk of malignancy only remained comparable to that of the overall population in the group with a score of 1 (χ2 test p = 0.503), while the group with a score of 0 was significantly lower (χ2 test, p = 0.0114) and groups with scores of 2 and 3 were significantly higher (χ2 test, p = 0.0282 and <0.0001, respectively). In summary, a score of 0 identified benign TIs with a negative predictive value of 93%, while scores of 2 and 3 predicted malignancy with positive predictive values of 60% and 100%, respectively.
Discussion
Assessment of [18F]FDG TIs is a critical challenge for oncology patients as the reported thyroid cancer prevalence ranges from 20% to 40%. Furthermore, patients undergoing [18F]FDG-PET/CT are generally affected by aggressive nonthyroid cancers that commonly dictate their prognosis. Thus, developing a PET/CT-based strategy to stratify the risk of malignancy in FDG-TIs may assist nuclear medicine physicians during PET/CT reporting and provide patient-specific risk stratification. In turn, additional referrals and investigations could be reduced, positively impacting patient quality of life and reducing overall costs.
Previous studies have reported increased SUVmax and SUVmean values and higher PET volume-based measurements (MTV and TLG) in malignant TIs, suggesting a potential role for these parameters, alone or in combination, as predictors of TI malignancy (7,9,10,22). Others, however, have reported no significant association of the same parameters with TI malignancy (1,6,8,11). More recently, a different approach based on assessment of [18F]FDG distribution within thyroid nodules has been proposed (21 –23), and preliminary data suggest that high metabolic heterogeneity may identify malignant TIs better than conventional PET metrics (21). Sollini et al. reported interesting preliminary results by evaluating histogram-based and matrix-based features by textural analysis (22,23).
To the best of our knowledge, our study is the first attempt to integrate textural features and conventional PET metrics in a multiparametric predictive model for TIs. The present data confirmed the predictive power of conventional PET metrics parameters and identified six independent radiomics features describing shape, heterogeneity, and intensity of lesion tracer uptake as additional tools for discriminating benign from malignant TIs. As the main result, a predictive model combining the three independent PET-derived predictive parameters (i.e., TLG, SUVmax, and shape_Sphericity) proved to be highly accurate for stratifying the risk of malignancy of [18F]FDG-avid TIs. In particular, all triple-positive TIs were malignant (positive predictive value, 100%), while 93% of triple-negative cases were benign.
The present retrospective single-center study has some limitations. First, in some cases, the severity of the primary malignancy could have prevented a complete diagnostic workup of the TI and the exclusion of these patient in our analysis. However, the prevalence of thyroid cancer among the study cohort was in line with current rates reported in the literature. Second, a validated threshold value to segment thyroid PET-positive thyroid nodules has not been defined yet. However, our approach was based on arbitrarily selecting the SUVmean of the contralateral lobe to define the actual volume of TIs independent of their metabolic activity increasing accuracy and reproducibility of radiomics analysis. Third, we analyzed only lesions larger than 1.1 cm, consistent with the current recommendation to not perform fine-needle aspiration cytology in nodules, included FDG-active ones, less than 1 cm in largest diameters (5). Thus, our findings may not be applicable to smaller TIs. Fourth, even if the present series is larger than those previously reported, validation of the current model in a prospective study including a larger number of cases is warranted to confirm these results.
Finally, we did not compare PET data with US pattern in our series as US examinations were performed by different sonographers in different centers precluding any reliable comparison. However, it should be noted that, even if the potential role of US in this setting was reported (17), current clinical guidelines still recommend fine-needle aspiration cytology in all FDG-active TIs >1 cm (5). Accordingly, the aim of this study was to test the possibility of better characterizing metabolic PET information to guide the need for fine-needle aspiration in patients with cancer independent of other evaluation. Our PET/CT-based model was able to predict the risk of malignancy of PET TIs. Such approach may potentially avoid unnecessary additional procedures. The potential improvement generated by the integration between PET and US risk factors remains of course of high interest and deserves to be explored in future studies.
In conclusion, the present multiparametric PET/CT-based radiomics model showed good performance in stratifying the risk of malignancy of [18F]FDG-avid TIs and may be useful for reducing the number of fine-needle aspiration cytology referrals in patients with cancer.
Footnotes
Author Disclosure Statement
The authors have no competing financial interests to declare.
Funding Information
The authors received no financial support for the study.