
Abstract
Background:
The risk stratification system of the American College of Radiology Thyroid Imaging Reporting and Data System (ACR TI-RADS) for thyroid nodules is affected by low diagnostic specificity. Machine learning (ML) methods can optimize the diagnostic performance in medical image analysis. However, it is unknown which ML-based diagnostic pattern is more effective in improving diagnostic performance for thyroid nodules and reducing nodule biopsies. Therefore, we compared ML-assisted visual approaches and radiomics approaches with ACR TI-RADS in diagnostic performance and unnecessary fine-needle aspiration biopsy (FNAB) rate for thyroid nodules.
Methods:
This retrospective study evaluated a data set of ultrasound (US) and shear wave elastography (SWE) images in patients with biopsy-proven thyroid nodules (≥1 cm) from the Shanghai Tenth People's Hospital (743 nodules in 720 patients from September 2017 to January 2019) and an independent test data set from the Ma'anshan People's Hospital (106 nodules in 102 patients from February 2019 to April 2019). Six US features and five SWE parameters from the radiologists' interpretation were used for building the ML-assisted visual approaches. The radiomics features extracted from the US and SWE images were used with ML methods for developing the radiomics approaches. The diagnostic performance for differentiating thyroid nodules and the unnecessary FNAB rate of the ML-assisted visual approaches and the radiomics approaches were compared with ACR TI-RADS.
Results:
The ML-assisted US visual approach had the best diagnostic performance than the US radiomics approach and ACR TI-RADS (area under the curve [AUC]: 0.900 vs. 0.789 vs. 0.689 for the validation data set, 0.917 vs. 0.770 vs. 0.681 for the test data set). After adding SWE, the ML-assisted visual approach had a better diagnostic performance than US alone (AUC: 0.951 vs. 0.900 for the validation data set, 0.953 vs. 0.917 for the test data set). When applying the ML-assisted US+SWE visual approach, the unnecessary FNAB rate decreased from 30.0% to 4.5% in the validation data set and from 37.7% to 4.7% in the test data set in comparison to ACR TI-RADS.
Conclusions:
The ML-assisted dual modalities visual approach can assist radiologists to diagnose thyroid nodules more effectively and considerably reduce the unnecessary FNAB rate in the clinical management of thyroid nodules.
Introduction
With the increasing use of thyroid high-frequency ultrasound (US) examination, US-guided fine-needle aspiration biopsy (FNAB), and molecular testing, the detection rate of thyroid cancer (particularly indolent papillary thyroid microcarcinoma) has rapidly increased. Meanwhile, the mortality rate of thyroid cancer has remained stable over the past few decades (1). The current major clinical challenges in the management of thyroid nodules are the diagnosis of thyroid cancer, which is a costly and intricate process, and the overdiagnosis of nonclinically significant thyroid cancers (2).
US is the first-line and most accurate imaging modality to assess thyroid nodules (3 –5). Recently, the American College of Radiology Thyroid Imaging Reporting and Data System (ACR TI-RADS) was established to determine which nodules should have FNAB or US follow-up by using five US feature categories and the maximum size of the nodule (5). Some retrospective studies have shown encouraging results that improve the diagnostic accuracy and reduce the nodule biopsy recommendations in comparison to other biopsy recommendation guidelines. However, the risk stratification system of the ACR TI-RADS for thyroid nodules is relatively complicated to apply in clinical practice, and it has low diagnostic specificity (44–67.3%) (6 –8). Due to the high prevalence of thyroid nodules and the low prevalence of biologically significant malignancy, a noninvasive and reliable diagnostic method with a high diagnostic sensitivity and specificity is highly desirable to identify which nodules warrant FNAB (9,10).
Shear wave elastography (SWE) imaging has been shown to be a useful biomarker for thyroid cancer by providing additional information on nodule hardness (11 –13). Some studies found that combining the SWE and grayscale US can improve the diagnostic specificity in comparison to grayscale US alone for predicting thyroid malignancy (14 –16). Nevertheless, a definitive supplementary role of SWE to the grayscale US in thyroid nodules is controversial in the literature (17,18). The main cause is that nonuniform diagnostic criteria in combination of SWE and grayscale US are used.
The state-of-the-art data analysis contributed by artificial intelligence (AI) has enormously expanded researchers' ability to make meaningful discoveries. Machine learning (ML), which is a subset of AI, provides novel clinical insights to improve diagnostic and prognostic accuracy. By taking advantage of the ability of AI to “learn” from clinical data sets or image texture information, ML-based computational methods can improve accuracy (19 –21). Recently, some studies based on ML method to evaluate thyroid cancer have been conducted (22,23). Nevertheless, the diagnosis of thyroid nodules using ML methods needs significant development, and further studies are necessary.
Currently, there are no studies on investigating which ML-based diagnostic pattern is more effective in improving the diagnostic performance and reducing thyroid nodule biopsies. Therefore, in this study, we developed two types of ML-based diagnostic patterns, namely ML-assisted visual approach and radiomics approach, to predict malignancy of thyroid nodules. The former is based on human feature extraction and computational techniques, while the latter is founded on computer-based image analysis. The primary aim of this study was to compare two ML-based diagnostic patterns with ACR TI-RADS in the diagnostic performance and the unnecessary FNAB rate for thyroid nodules. The secondary aim was to investigate whether SWE can provide added value to improve the performance of US in the two ML-based diagnostic patterns.
Materials and Methods
This retrospective two-center study was approved by the institutional review boards of the two participating centers and was granted a waiver of informed consent for the use of patient data. In addition, informed consent for the SWE examinations was obtained from all patients.
Study population
Between September 2017 and January 2019, a total of 1027 thyroid nodules (≥10 mm in maximum diameter) in 979 consecutive patients were subjected to grayscale US and SWE examinations before FNAB at the Shanghai Tenth People's Hospital in Shanghai, China, which is a tertiary referral center. Among them, 284 nodules were excluded. The exclusion criteria were as follows: (a) nodules that had inconclusive diagnoses of cytological findings including nondiagnostic or unsatisfactory, atypia of undetermined significance or follicular lesion of undetermined significance (AUS/FLUS), follicular neoplasm or suspicion of follicular neoplasm (FN/SFN), and suspicion for malignancy, without undergoing surgical resection (n = 217); (b) nodules that were not imaged successfully with SWE (n = 38); (c) nodules that had unreliable SWE images (n = 14); (d) nodules that had missing data on US or SWE images (n = 15). The final study group consisted of 743 nodules in 720 patients (168 men and 552 women; mean age, 49.61 years; range, 15–89 years). The ML-assisted visual approaches and the radiomics approaches were trained on 70% of the Shanghai Tenth People's Hospital data set (520 nodules in 504 patients) and validated on the remaining 30% (223 nodules in 216 patients).
From February 2019 to June 2019, an independent external test cohort of 102 consecutive patients with 106 thyroid nodules (25 men and 77 women; mean age, 50.62 years; range, 17–77 years) from the Ma'anshan People's Hospital in Anhui, China, were enrolled with the same criteria that were used for the primary cohort. If nodule had one or more suspicious US feature(s) (solid nodule, hypoechogenicity or marked hypoechogenicity, taller-than-wide shape, microlobulated or irregular margin, and microcalcifications or mixed calcifications) and a maximal diameter more than 10 mm, the nodule was recommended for FNAB by the radiologists in two participating centers (24). The final decision whether to perform FNAB was determined according to the physicians' preference. In addition, the surgical selection was based on the cytological results and the patients' preference. Use of SWE examinations before FNAB at the two participating centers was for studying the value of SWE in the thyroid nodules, and the SWE results were not prospectively used for management decisions in the FNAB recommendation. A detailed patient inclusion and exclusion flowchart is shown in Figure 1.
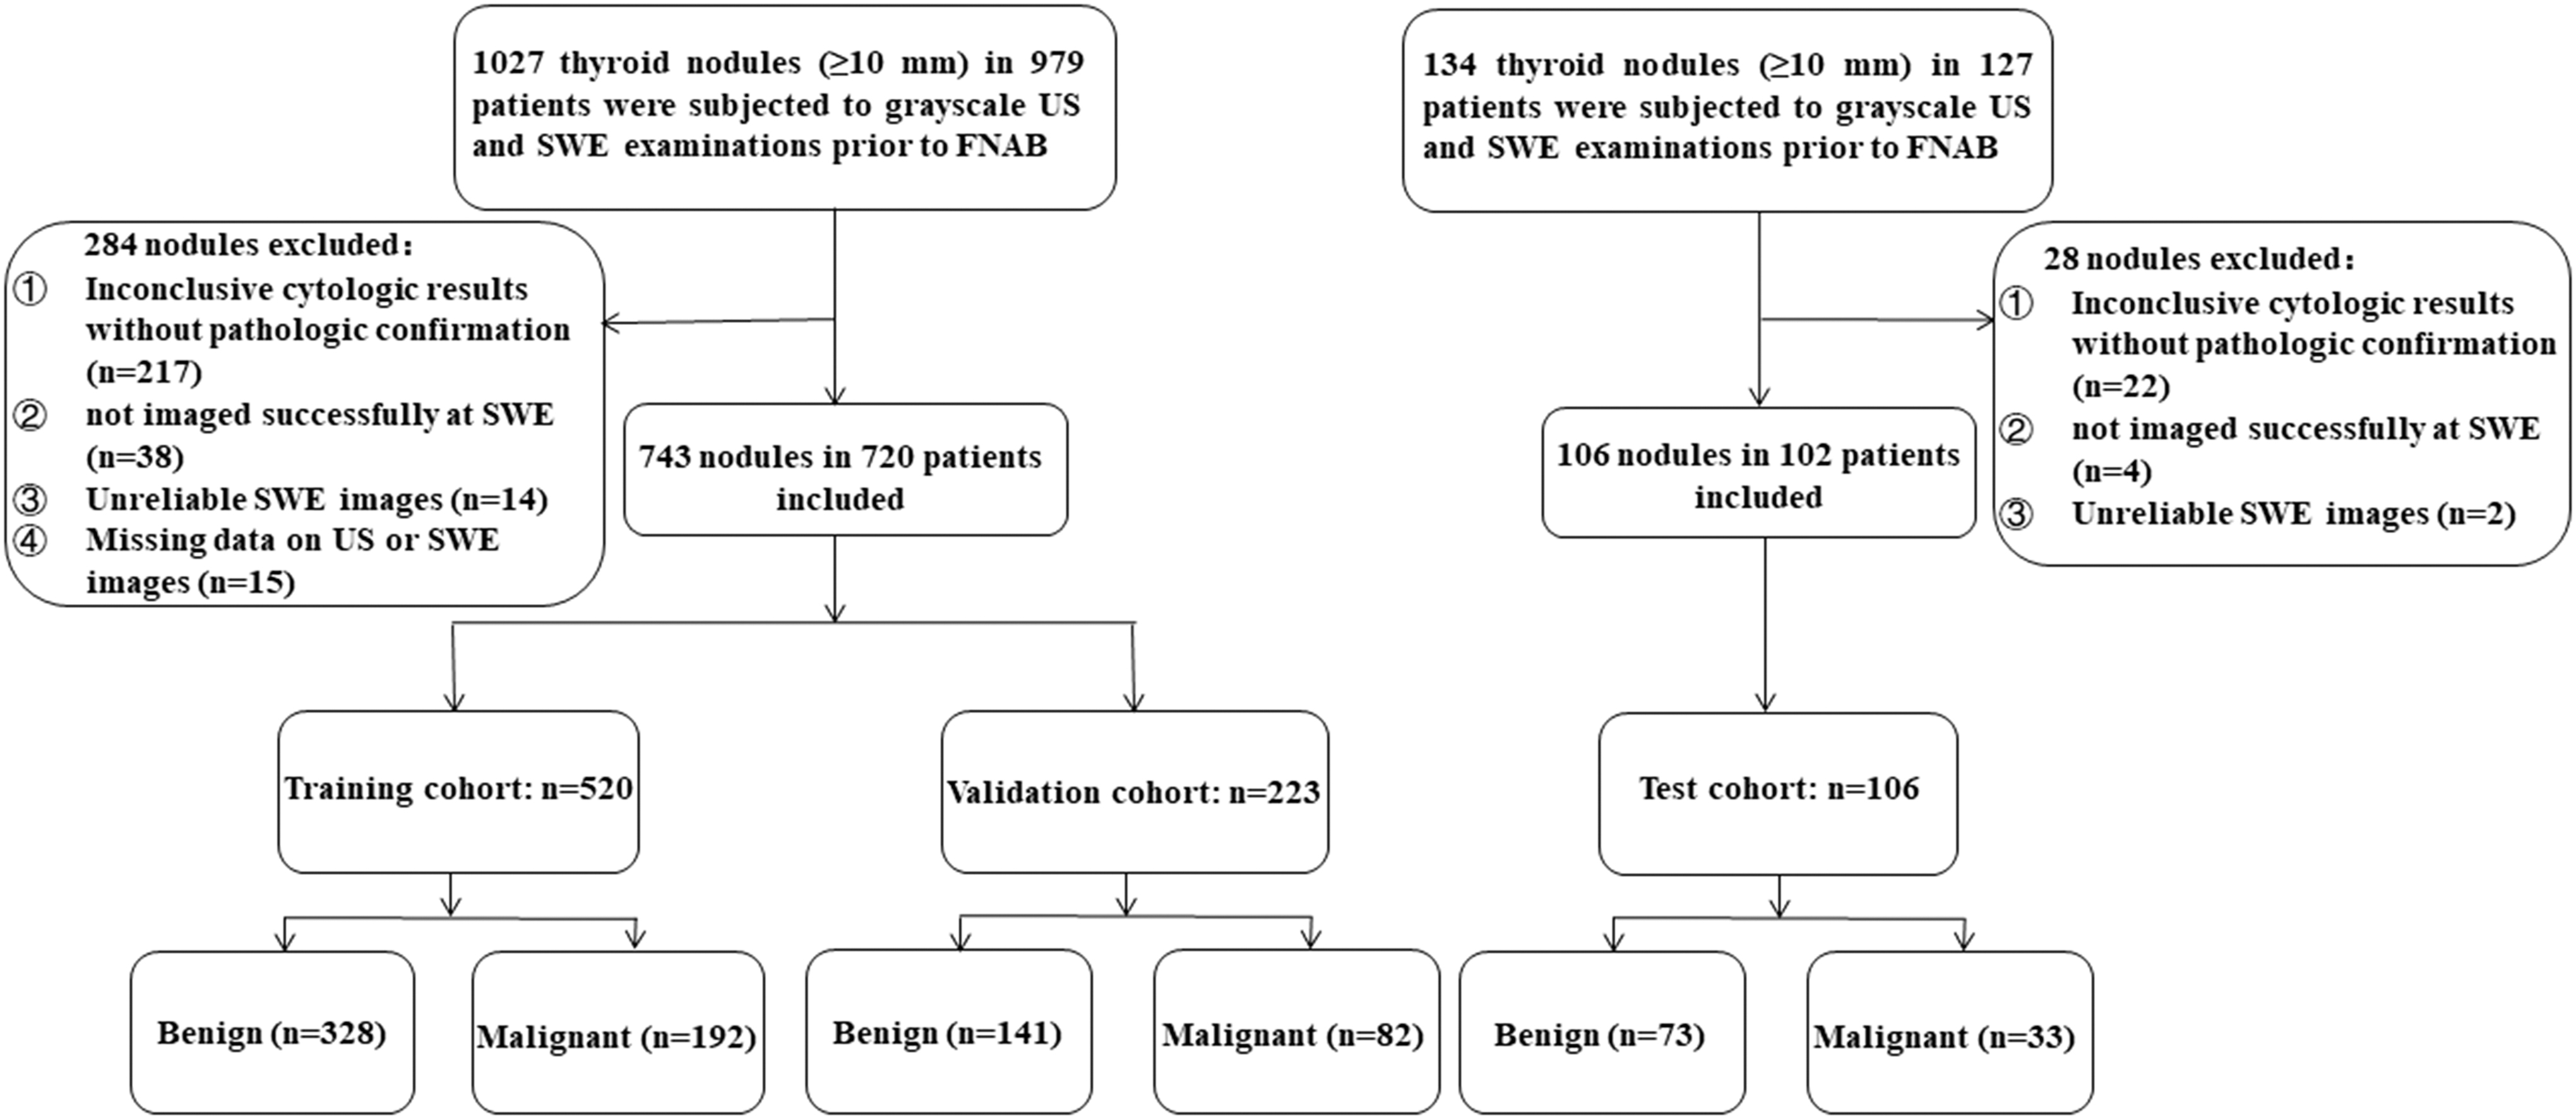
Flowchart of patient selection in the study.
Grayscale US and SWE examinations
The grayscale US and SWE examinations were performed with the same sonography machine (Aixplorer; Supersonic Imagine, Paris, France) with a 5–14 MHz high-frequency linear transducer. The imaging parameters were adjusted by board-certified radiologists who performed the US examination and acquired the images. The image settings, which included the time-gain compensation, the focal position, the dynamic range, and the mechanical index, were optimized for each examination. Two US images for each target nodule (the largest transverse cross section and the largest long-axis cross section) were routinely recorded. In addition, the other US images in the other planes with relevant meaningful US findings and video clips of each target nodule were also acquired.
The SWE acquisition and measurements were performed immediately after the grayscale US examination. To optimize the beam penetration, the “penetration” mode was selected. The pressure exertion on the transducer was limited to avoid compression artifacts. The SWE image was displayed along with the grayscale US image in a split screen mode (top and bottom). Three SWE images were routinely acquired in each of the two scanning planes for each target nodule (the largest transverse cross section and the largest long-axis cross section). The SWE parameters were measured using the device manufacturer's “Q-Box” quantification tool. The first 2-mm diameter region of interest (ROI) was positioned in the nodule where the color map was the most homogeneous. The SWE Q-Box parameters from this first ROI included the mean (SWE-mean), minimum (SWE-min), maximum (SWE-max), and standard deviation (SWE-SD) of the elasticity index in kPa. Another ROI of the same size was subsequently positioned inside the thyroid parenchyma next to the nodule. Then, the ratio (SWE-ratio) between the mean elasticity in the nodule ROI over the mean elasticity in the parenchyma ROI was provided.
The grayscale US and SWE images in the digital imaging and communications in medicine (DICOM) format were stored on the supersonic imagine system platform.
US image interpretation, SWE parameters selection, and ACR TI-RADS recommendation
Two experienced radiologists (reader 1 [Y.-F.Y.] with 16 years of clinical experience and reader 2 [C.L.] with 14 years of clinical experience in evaluating thyroid US images) were blinded to the cytological and/or pathological results of the patients. They retrospectively analyzed the full examination by reviewing two to five static US images per nodule and one to two video clips of the same nodule to independently assign US features in the five ACR TI-RADS categories. Subsequently, they reached consensus on a feature-by-feature basis as the “truth” US imaging features of the nodule. They jointly interpreted additional 50 cases to standardize the features assignment at the beginning of the study. The five US features categories were as defined by the ACR TI-RADS lexicon, which included the internal composition (cystic or almost completely cystic, spongiform, mixed cystic and solid, and solid or almost completely solid), echogenicity of the solid portion (hyperechogenicity, isoechogenicity, hypoechogenicity, or marked hypoechogenicity), shape (wider-than-tall or taller-than-wide), margin (well-defined smooth, microlobulated or spiculated, ill-defined, or extrathyroidal extension), and echogenic foci (the absence of calcification, large comet-tail artifacts, macrocalcifications, peripheral [rim] calcifications, punctate echogenic foci, or mix calcifications). Meanwhile, the five elastograms were determined in the representative SWE image with a minimal artifact from the six SWE images, which was based on the two experienced radiologists' consensus selection.
A point was given for each of the five US features in the nodule, and the total point determined the nodule's ACR TI-RADS risk level (ranges from TR1 to TR5). The thyroid nodules were categorized into two groups on the basis of the nodule's ACR TI-RADS risk level and its maximum diameter: the nodules in which the US-guided FNAB were not indicated and the nodules in which the US-guided FNAB were indicated (Fig. 2) (5).

Study workflow of the two ML-assisted visual approaches, the two radiomics approaches, and ACR TI-RADS. ACR TI-RADS, American College of Radiology Thyroid Imaging Reporting and Data System; ML, machine learning.
Development of the ML-assisted visual approaches
For each nodule, the data including six US features (size, composition, echogenicity, shape, margin, and echogenic foci) based on the ACR TI-RADS lexicon and five SWE parameters (SWE-mean, SWE-min, SWE-max, SWE-SD, and SWE-ratio) from the two experienced radiologists' consensus interpretation and selection were collected. To avoid overfitting, the Spearman correlation coefficient (r) with a threshold of 0.95 was used to assess the correlations among all the features in the training data set. After the high-correlation features were excluded, the random forest-based feature importance method was applied to select the most significant features. Subsequently, 10 ML classifiers were separately used with the selected features to develop the optimum ML-assisted US visual approach and the ML-assisted US+SWE visual approach (Fig. 2). These classifiers were decision tree, naive Bayes, k-nearest neighbors (KNN), logistic regression, support vector machine (SVM), KNN-based bagging, random forest, extremely randomized trees (xgboost), multilayer perception, and gradient boosting tree.
Development of the radiomics approaches
Using the ITK-SNAP software program (version 3.6.0), one radiologist (C.-K.Z.) with five years of experience in performing thyroid US examinations delineated the ROI around the nodule outline on the grayscale US image in the largest long-axis cross section as the nodule segmentation in the US image. For the nodule segmentation in the SWE image, one representative SWE image with a minimal artifact was chosen from three SWE images in the largest long-axis cross section, which was based on the two experienced radiologists' consensus selection. This radiologist first delineated the ROI around the nodule outline in the grayscale US image (bottom screen) and then moved this ROI to the corresponding SWE image (top screen) because of an indefinite boundary of the nodule in the SWE image. In addition, the radiologist (C.-K.Z.) delineated the ROIs in the US and SWE images of 100 randomly chosen nodules twice with a one-week interval to assess the intraoperator reproducibility. Another radiologist (B.-Y.Z.) with three years of experience in performing thyroid US examinations participated to independently delineate the ROIs in the same images for evaluating the interoperator reproducibility. For each ROI of the US and SWE images, 6940 radiomics features were extracted automatically by the software program IFoundry (Intelligence Foundry 1.2; GE Healthcare, China). This includes six classes of radiomics features. (a) Class 1 consisted of 5 contour features, 13 shape features, and 13 textural phenotype features. (b) Class 2 had 18 histogram features. (c) Class 3 contained 73 second-order textural features, including gray-level co-occurrence matrix, gray-level run-length matrix, gray-level size zone matrix, neighborhood gray-tone difference matrix, and gray-level dependence matrix features (23, 16, 16, 5, and 13, respectively). (d) Class 4 consisted of the 6068 filter-based features, which included the wavelet filter, Gabor filter, local ternary patterns filter, local derivative patterns filter, local binary patterns filter, and shearlet filter (492, 240, 240, 480, 200, and 4416, respectively). (e) Class 5 included 48 intra-perinodular textural transition features. (f) Class 6 consisted of 702 co-occurrence of local anisotropic gradient orientations features.
After the US radiomics feature-set and the SWE radiomics feature-set were obtained, the same feature reduction and selection methods mentioned above were used for determining potential risk predictors. In addition, the same 10 ML classifiers were separately used with the selected radiomics features for building the optimum US radiomics approach and the US+SWE radiomics approach (Fig. 2).
Statistical analyses
Data analyses were performed using the Python module scikit-learn (version 0.21.2, open source Python programming language; Python Software Foundation), which is a module for ML, along with SPSS software (version 22.0; IBM Corporation, Armonk, NY). The interclass correlation coefficient (ICC) was used to assess the intraoperator and interoperator reproducibility of the radiomics features extraction. In addition, an ICC ≥0.75 was considered to have a high consistency. Each ML algorithm that was used is described in Supplementary Table S1. Consistent with the strategy of ACR TI-RADS for the biopsy recommendation, the thyroid nodules were not indicated for the US-guided FNAB if the result of the AI methods was negative, whereas they were indicated for US-guided FNAB if the result was positive. The unnecessary biopsy rate was defined as the percentage of the benign nodules among the currently total biopsy-required nodules. The diagnostic performances for each of the methods were evaluated according to the area under the curve (AUC), sensitivity, specificity, positive predictive value (PPV), negative predictive value (NPV), and accuracy. DeLong's test was applied for the comparisons between the AUCs. A p-value <0.05 represented a statistically significant difference. Confidence intervals [CIs] for the proportions were reported as a two-sided exact binomial with a 95% CI.
Results
Demographics and thyroid nodules characteristics
As shown in Table 1, the average patient age was 49.97 ± 13.89 years (SD) (range 19–89 years) for the training data set, 48.93 ± 13.75 years (range 15–78 years) for the validation data set, and 50.57 ± 10.71 years (range 17–77 years) for the test data set. The mean nodule size was 17.35 ± 7.65 mm (range 10–47 mm) for the training data set, 17.31 ± 8.36 mm (range 10–58 mm) for the validation data set, and 19.15 ± 8.61 mm (range 10–38 mm) for the test data set. Of the 849 thyroid nodules, there were 307 (36.2%) malignant nodules that consisted of 300 papillary thyroid carcinomas (which contained 8 follicular variant papillary thyroid carcinomas), 4 follicular carcinomas, 2 medullary carcinomas, and 1 anaplastic carcinoma. Among the 542 benign nodules, 214 (39.5%) benign nodules were confirmed by surgical excision. These included 130 nodular hyperplasia, 26 adenomatous hyperplasia, 25 follicular adenomas, 2 oxyphilic adenomas, and 31 Hashimoto's nodules that were caused by lymphocytic thyroiditis. For the remaining 328 (60.5%) benign nodules, their benign status was determined by the concordant benign cytological results of twice FNABs (n = 57), or the initial benign cytological results of FNAB and a decreased or stable size on US after at least six months of follow-up (n = 271). Table 2 summarizes the US findings that were based on the two experienced radiologists' consensus interpretation and the nodule's ACR TI-RADS risk level. In addition, the SWE findings from the two experienced radiologists' consensus selection are presented in Table 3.
Patient Demographics and the Thyroid Nodule Characteristics
Data in parentheses are percentages.
Data are mean ± SD, with ranges in parentheses.
SD, standard deviation.
Ultrasound Characteristics of Thyroid Nodules Based on Consensus
Data in parentheses are percentages.
ACR TI-RADS, American College of Radiology Thyroid Imaging Reporting and Data System; US, ultrasound.
Shear Wave Elastography Parameters of Thyroid Nodules Based on Consensus
Data are presented as mean ± SD.
SWE, shear wave elastography.
Construction and validation of the ML-assisted visual approaches and the radiomics approaches
For the ML-assisted US visual approach, six US visual features were reserved as the most significant features for predicting thyroid malignancy after applying the Spearman correlation coefficient of 0.95 and the random forest-based feature importance method in the training cohort. In comparison to the other nine ML classifiers, the gradient boosting tree model showed the highest AUC of 0.900 for the prediction of thyroid malignancy using the optimum cutoff value of 0.342 in the validation cohort. The sensitivity, specificity, PPV, NPV, and accuracy of the model were 89.0%, 77.3%, 69.5%, 92.4%, and 81.6%, respectively. In the ML-assisted US+SWE visual approach, likewise, the 11 visual features from US and SWE were reduced to 10 risk predictors (size, composition, echogenicity, shape, margin, echogenic foci, SWE-mean, SWE-min, SWE-max, and SWE-ratio) after the feature selection in the training cohort. In comparison to the other 9 ML classifiers, the KNN-based bagging model with 10 selected US and SWE visual features showed the highest AUC of 0.951 for the prediction of thyroid malignancy using the optimum cutoff value of 0.445 in the validation cohort. The sensitivity, specificity, PPV, NPV, and accuracy of the model were 81.7%, 92.9%, 87.0%, 89.7%, and 88.8%, respectively (Supplementary Figs. S1 and S2 and Table 4).
Comparison of the Diagnostic Performance of Models
Data in parentheses are used to calculate percentages, and data in brackets are confidence intervals.
AUC, area under the curve; ML, machine learning; NPV, negative predictive value; PPV, positive predictive value.
Satisfactory intraoperator and interoperator reproducibility of the radiomics features extraction in the US and SWE images were achieved. The intraoperator ICCs ranged from 0.827 to 0.965 in US, 0.741 to 0.923 in SWE, and the interoperator ICCs ranged from 0.766 to 0.945 in US, 0.689 to 0.896 in SWE. In the US radiomics approach, 6940 radiomics features that were extracted from the US image were reduced to 26 features as the most significant features for predicting thyroid malignancy after applying the Spearman correlation coefficient of 0.95 and the random forest-based feature importance method in the training cohort. With the optimum cutoff value of 0.330, the SVM model with the selected US radiomics features showed the highest AUC of 0.789 in comparison to the other nine ML classifiers for the prediction of thyroid malignancy in the validation cohort. The sensitivity, specificity, PPV, NPV, and the accuracy of the model were 74.4%, 72.3%, 61.0%, 82.9%, and 73.1%, respectively. For the US+SWE radiomics approach, 13,880 radiomics features that were extracted from the US and SWE image were reduced to 26 risk predictors after the feature selection and reduction in the training cohort. With the optimum cutoff value of 0.418, the SVM model with selected US+SWE radiomics features had the highest AUC of 0.834 in comparison to the other nine ML classifiers for the prediction of thyroid malignancy in the validation cohort. The sensitivity, specificity, PPV, NPV, and the accuracy of the model were 70.7%, 79.4%, 66.7%, 82.4%, and 76.2%, respectively (Supplementary Figs. S1 and S2 and Table 4).
Comparison of the diagnostic performance and the unnecessary FNAB rate between the two ML-based diagnostic patterns and ACR TI-RADS in the validation and test data sets
The ML-assisted US visual approach had the best diagnostic performance (AUC: 0.900 vs. 0.789 vs. 0.689 for the validation data set, 0.917 vs. 0.770 vs. 0.681 for the test data set, all p < 0.05) and the lowest unnecessary FNAB rate (14.3% vs. 17.5% vs. 30.0% for the validation data set, 15.1% vs. 15.1% vs. 37.7% for the test data set) than the US radiomics approach and ACR TI-RADS recommendation.
After adding SWE to US, the ML-assisted visual approach displayed a better diagnostic performance in comparison to US alone; AUC (0.951 vs. 0.900 for the validation data set, p < 0.05, 0.930 vs. 0.917 for the test data set, p > 0.05), specificity (92.9% vs. 77.3% for the validation data set, 93.2% vs. 78.1% for the test data set), PPV (87.0% vs. 69.5% for the validation data set, 86.1% vs. 65.2% for the test data set), and unnecessary FNAB rate (4.5% vs. 14.3% for the validation data set, 4.7% vs. 15.1% for the test data set).
After adding SWE to US, the radiomics approach showed a better diagnostic performance in comparison to US alone, as measured in terms of the AUC (0.834 vs. 0.789 for the validation data set, 0.882 vs. 0.771 for the test data set, all p < 0.05), specificity (79.4% vs. 72.3% for the validation data set, 83.6% vs. 78.1% for the test data set), PPV (66.7% vs. 61.0% for the validation data set, 69.2% vs. 59.0% for the test data set), and the unnecessary FNAB rate (13.0% vs. 17.5% for the validation data set, 11.3% vs. 15.1% for the test data set).
Moreover, the ML-assisted SWE+US visual approach was better than the SWE+US radiomics approach in differentiating benign from malignant thyroid nodules. This was measured in terms of the AUC (0.951 vs. 0.834 for the validation data set, 0.953 vs. 0.882 for the test data set, all p < 0.05), specificity (92.9% vs. 79.4% for the validation data set, 93.2% vs. 83.6% for the test data set), PPV (87.0% vs. 66.7% for the validation data set, 86.1% vs. 69.2% for the test data set), and the unnecessary FNAB rate (4.5% vs. 13.0% for the validation data set, 4.7% vs. 11.3% for the test data set) (Fig. 3 and Tables 4 and 5).
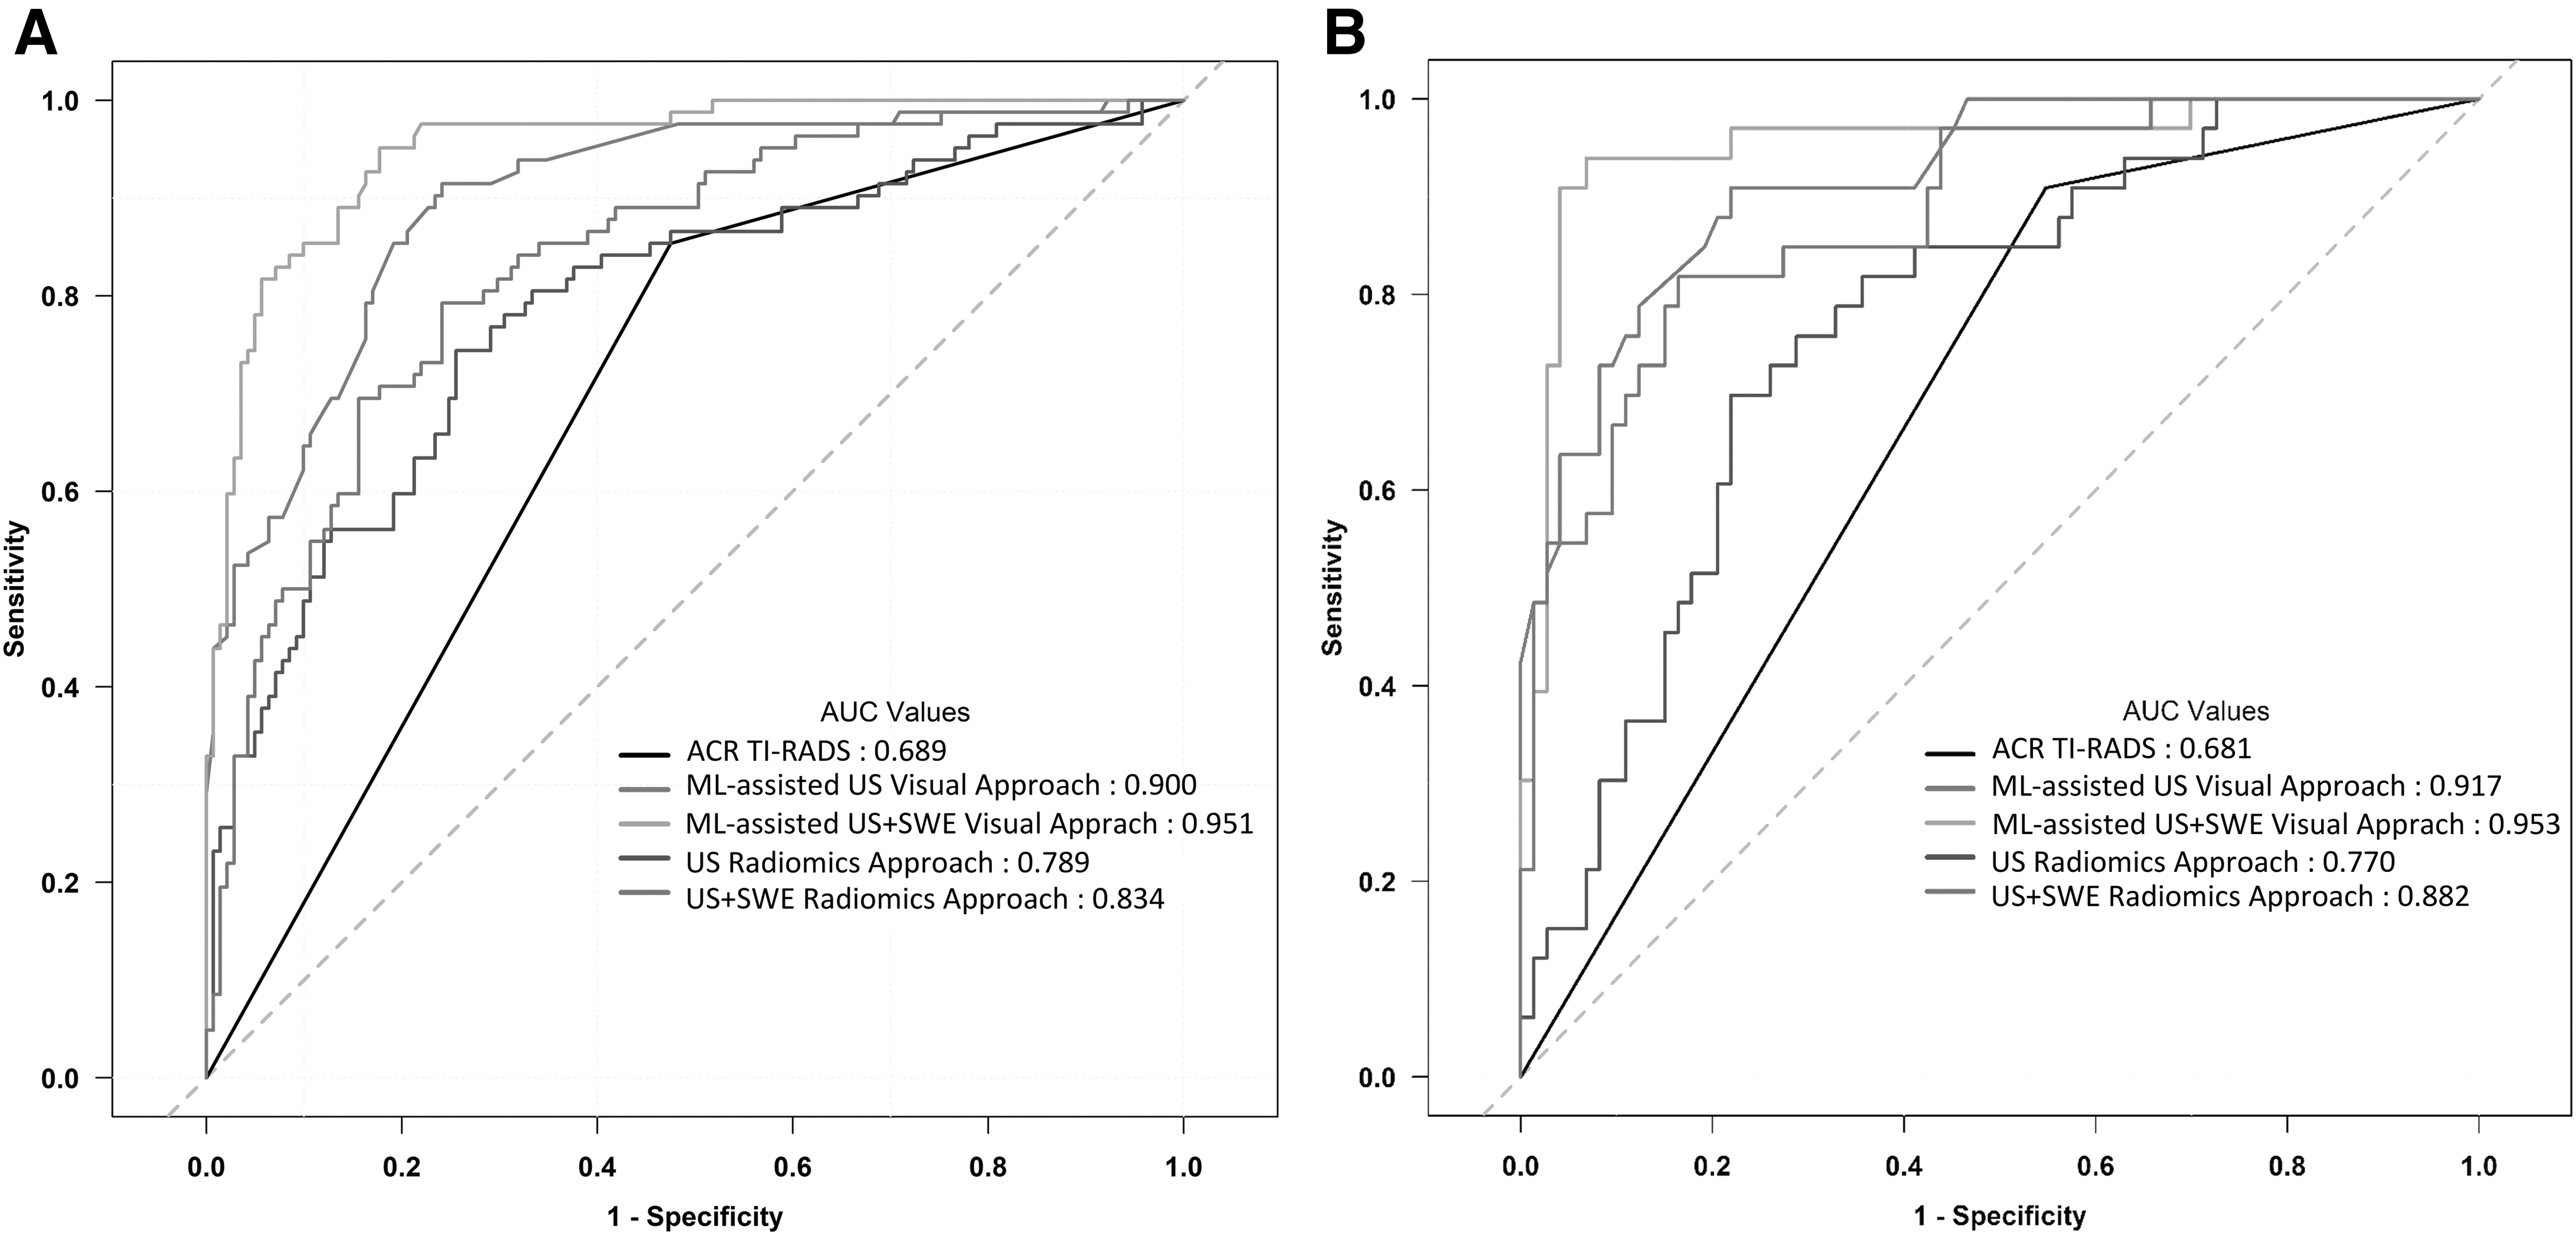
Receiver operating characteristic curves of two ML-assisted visual approaches, two radiomics approaches, and ACR TI-RADS in (
Comparison of Unnecessary Fine-Needle Aspiration Biopsy Rates in Diagnostic Models
Data in parentheses are percentages.
Data in parentheses are used to calculate percentages.
FNAB, fine-needle aspiration biopsy.
Discussion
Our study revealed that the ML-assisted dual modalities (US+SWE) visual approach yielded a satisfactory performance in diagnosing thyroid nodules, with an AUC of 0.951, a sensitivity of 81.7%, and a specificity of 92.9% for the validation data set from the primary hospital and an AUC of 0.953, a sensitivity of 93.9%, and a specificity of 93.2% for the independent test data set from another hospital. The unnecessary FNAB rate of thyroid nodules was decreased to 4.5% for the validation data set and 4.7% for the independent test data set. Furthermore, our results indicate that this approach, which is based on the knowledge of experienced radiologist and the ML classifier, can significantly outperform the radiomics approaches and the current biopsy guideline method in terms of diagnosing thyroid nodules and reducing the unnecessary FNAB rate of thyroid nodules.
The ML-assisted dual modalities visual approach, which shows a superior performance in terms of the specificity and PPV, offers a meaningful reduction in the unnecessary biopsy recommendation. It will help to substantially alleviate the financial burden on the health care system and the anxiety and financial burden on patients. In comparison to the previous articles that use computer-aided diagnostic methods to simply discriminate malignant from benign nodules, our AI methods are designed to identify which nodules warrant FNAB (25). The central aim of this study was to determine which approach reduces the unnecessary FNAB of benign nodules. To the best of our knowledge, this is the first two-center and large-scale study to comprehensively compare the ML-assisted visual approaches and the radiomics approaches with ACR TI-RADS in the diagnostic performance and the unnecessary biopsy rate in a real-world decision-making setting. In addition, our study further investigated whether SWE can provide the added value to improve the performance of US in two ML-based diagnostic patterns.
AI techniques have attracted considerable attention as a powerful tool for the classification of lesions in a variety of medical fields with outstanding performance results (26 –28). The deep learning (DL) algorithm has the complex “black box” problem so that physicians do not understand how it reaches that conclusion. The opacity of these algorithms makes their clinical implementation a dilemma. Moreover, large amounts of standardized image data are required to develop the DL algorithm, which is difficult to acquire in the medical field (29,30). Considering these concerning issues of the DL algorithm, we elected interpretable ML methods that can take advantage of obtainable sample sizes of the data to study for the risk stratification of thyroid lesions.
The diagnostic performance and the unnecessary biopsy rate of the ML-assisted US visual approach and the US radiomics approach were superior to the ACR TI-RADS evaluation in this study. The ACR TI-RADS evaluation results for predicting thyroid malignancy in this study (sensitivity, 85.4–90.9%; specificity, 45.2–52.5%) are similar to previous retrospective studies that used the ACR TI-RADS (sensitivity, 74.7–92%; specificity, 44–67.3%), and these results support the importance of ACR TI-RADS in the management of thyroid nodules (6 –8). Several studies have attempted to apply ML techniques to process a series of collected US features from the radiologist's interpretation. However, these included some nonmalignant-related parameters such as the hypoechoic halo and vascularity but excluded the nodule size (22,31). We used the ACR TI-RADS lexicon while applying the ML technique to optimize the performance of the risk stratification system. In addition, the six US features in this study were reserved by the reduction and selection method for the ML-assisted US visual approach and the ML-assisted US+SWE visual approach. A preliminary study showed that the US radiomics approach can be useful for predicting the malignancy in thyroid nodules (23). Although this study reported promising results, the use of a small sample size (a total of 137 thyroid nodules) in the training cohort can undoubtedly lead to the risk of overfitting, and this limits the generalizability of these results (32). A large-scale sample size (520 nodules) was used in this study for the training radiomics approaches. Similar results were obtained on the internal validation data set and the external test data set.
US alone cannot satisfactorily distinguish between benign and malignant thyroid nodules. As another important noninvasive technique, elastography imaging can assess the mechanical properties of the tissue elasticity for evaluating thyroid nodules. The stiffness of the tissue is determined by the structural properties of its matrix. Pathological changes alter the tissue composition and structure, which results in the lesion stiffness transformation (33,34). Given the advantages for the operator-independent, reproducible, and quantitative properties, SWE outperforms the strain elastography in clinical applications. In this study, five quantitative SWE parameters (the direct quantification of the stiffness) from two 2-mm circular ROIs were based on the radiologists' visual assessment, which are easily and widely used in routine clinical practice. A large-scale study by Park et al. found that the quantitative SWE parameters were independent predictors of thyroid malignancy, and the SWE evaluation was an effective adjunctive to the grayscale US for predicting thyroid malignancy (35). The requantified SWE radiomics features are acquired automatically from the entire nodule in SWE images by high-dimensional analysis. This has the potential to uncover the characteristics of diseases. Bhatia et al. suggested that an SWE textural analysis can accurately distinguish malignant and benign thyroid nodules and the SWE spatial heterogeneity is greater in malignant nodules (36). In addition, the SWE radiomics approach has been shown to be useful in diagnosing many diseases (37,38). However, the added value with SWE for thyroid nodule diagnosis has not been uniformly conclusive in the literature (14 –18). Our results verified that SWE can improve the performance of the experienced radiologists along with the radiomics approach by incorporating complementary information from SWE to US. Thus, the bimodality strategy based on US and SWE in the ML-assisted visual approach and the radiomics approach is more effective and valuable for evaluating thyroid nodules.
This study demonstrated that the diagnostic performance and the unnecessary biopsy rate of the ML-assisted visual approaches are superior to the radiomics approaches. The possible reason for this is that the visual interpretation of the nodule features that were obtained from experienced radiologists had the best correlation with properties of the nodules, in comparison to the selected radiomics features that were extracted through computerized algorithms. In contrast to the selected radiomics features with partial thyroid nodule signs in a single image, the experienced radiologists made their final decision by reviewing a series of thyroid US and SWE images. This visual information of thyroid imaging can be more targeted for the imaging assessment. Moreover, an abundant number of different radiomics features are an intractable challenge that prevents the use of ML models for the characterization of thyroid nodules in the clinical setting (39).
Our proposed ML-assisted visual approaches and radiomics approaches have the potential to be incorporated into the radiologists' current workflow. The ML-assisted visual approaches only require the radiologists to report six grayscale US characteristics (size, composition, echogenicity, shape, margin, and echogenic foci) or six grayscale US characteristics plus four SWE parameters (SWE-mean, SWE-min, SWE-max, and SWE-ratio) of the thyroid nodules like usual and launch one-button machine analysis in US image review workstations where these image features data are analyzed and the nodule can be classified within milliseconds by using the embedded ML classifiers (the gradient boosting tree model based on the US visual features, and the KNN-based bagging model based on the US+SWE visual features). In terms of the radiomics approaches, the sonography machines with an image output port wirelessly transmit US images or US images plus SWE images in the DICOM format to a picture archiving and communication system workstation. This allows the radiologists to delineate the ROIs of the thyroid nodules in the grayscale US and SWE images for a fully machine-based image analysis. The final diagnosis decision should be made by the radiologists. These interpretable AI methods with powerful performance can be used as a decision support tool to enhance the diagnosis and the clinical decision-making process. The radiologists can verify the diagnosis by reviewing the grayscale US and SWE images and then accept or discuss the classification that is offered by the AI methods. This can increase the radiologists' diagnostic confidence.
Despite these strong results, our study has some limitations. First, there is an inevitable selection bias because we included only thyroid nodules that are dichotomized as benign or malignant according to the definite biopsy cytological or surgical pathology results. Most of the benign nodules that did not undergo US-guided FNAB were excluded. These nodules are usually suggested for US follow-up in our practice. In addition, the malignancy rate (36.2%) is high in our cohort. Second, although 271 cytologically benign nodules included for this study had a decreased or stable size after at least six months of US follow-up, malignancy in these nodules may exist. However, a large-scale study reported that the false-negative rate for cytologically benign nodules is only 1.2% at the long-term US follow-up (40). Third, the cytologically indeterminate thyroid nodules (AUS/FLUS and FN/SFN) without surgical pathology confirmation were excluded in this study. However, follicular thyroid cancers are often present in this specific population (41). It results in a lower incidence rate for follicular thyroid cancer (1.3%) in the present study population. The diagnostic performance of our ML-based approaches for follicular thyroid cancer may be less efficient because of an insufficient amount of training data. Further efforts can use AI methods with two distinct protocols that are applied to US and SWE images to recognize follicular and papillary thyroid cancers separately in the cytologically indeterminate thyroid nodules. Fourth, the grayscale US and SWE findings of the nodules were determined by two radiologists in consensus in our study. However, given the interobserver variability in the identification of grayscale US and SWE features, it might lessen the value of the ML-assisted visual approaches by a single radiologist. In addition, our study did not evaluate the diagnostic performance of the ML-assisted visual approach based on the radiologists with different experience in comparison to the radiomics approaches and the ACR TI-RADS evaluation by the radiologists with different experience. Therefore, we suggest that further studies between radiologists and ML methods should be performed in the different clinical setting. Finally, this was a retrospective study, and these results might be affected by the composition of the limited-size data. Multicenter and prospective studies with long-term follow-up are needed to validate our results and further improve its impact on clinical outcomes.
In conclusion, the application of the ML-assisted dual modalities visual approach can improve diagnostic for thyroid nodules and meaningful reduction in unnecessary FNAB rate of thyroid nodules. The ML method has significant potential for enhancing the ability of radiologists to determine the optimal clinical management of thyroid nodules.
Footnotes
Author Disclosure Statement
X.L. and X.-R.W. are employed by GE Healthcare. The other authors declare that they have no conflicts of interest.
Funding Information
This work was supported in part by the National Natural Science Foundation of China (Grants 81671695, 81725008, and 81927801), Shanghai Municipal Health Commission (Grants 2019LJ21 and SHSLCZDZK03502), and the Science and Technology Commission of Shanghai Municipality (Grant 19441903200).
Supplementary Material
Supplementary Table S1
Supplementary Figure S1
Supplementary Figure S2