
Abstract
Background:
Similar to poorly differentiated thyroid carcinoma (PDTC), papillary thyroid carcinoma with high-grade features (PTC HGF) demonstrates increased mitotic activity and/or necrosis; however, PTC HGF is excluded from the World Health Organization (WHO) definition of PDTC based on maintained nuclear features of PTC.
Methods:
Consecutive tumors that met criteria for PTC HGF, defined as tumors with maintained nuclear features of PTC and mitoses numbering 5 or more per 10 contiguous high-power fields and/or tumor necrosis, and PDTC (defined as per the WHO criteria) were identified. Clinicopathologic characteristics, follow-up data, and targeted next-generation sequencing results were compared between groups.
Results:
There were 15 PTC HGF and 47 PDTC. PTC HGF was associated with a higher rate of pT4 disease (53% vs. 13%, p = 0.0027) and lymph node metastases (73% vs. 38%, p = 0.049). The disease-specific survival was worse for patients with PTC HGF compared with those with PDTC using Kaplan–Meier estimation (p < 0.001) and was worse in subgroup analysis evaluating patients with widely invasive PDTC (i.e., those with a similar rate of pT4 disease) and PTC HGF (p = 0.040). PTC HGF had a higher BRAF V600E mutation rate (42% vs. 3%; p = 0.003), a trend toward more gene fusions (25% vs. 3%; p = 0.052), and a higher rate of relative gain of 1q (67% vs. 15%; p = 0.002) than PDTC.
Conclusions:
Our results demonstrate that PTC HGF are important to recognize based on their aggressive behavior. The molecular differences between PTC HGF and PDTC suggest that PTC HGF should be considered a distinct group from PDTC.
Introduction
Poorly differentiated thyroid carcinoma (PDTC) is a tumor with intermediate biologic and clinical behavior between differentiated thyroid carcinoma and undifferentiated (anaplastic) thyroid carcinoma (ATC). It is defined by the World Health Organization (WHO) using criteria established in the Turin proposal, namely: (i) diagnostic features of malignancy, that is, capsular or vascular invasion, (ii) solid, insular, or trabecular growth, (iii) the presence of ≥3 mitoses per 10 high-power fields (HPF), necrosis, or convoluted nuclei, and (iv) the absence of nuclear features of papillary thyroid carcinoma (PTC) (1,2). Although these criteria have been validated in subsequent studies following their introduction (3 –5), there remains some controversy regarding the definition of PDTC. For example, different criteria for PDTC are utilized at the Memorial Sloan Kettering Cancer Center (MSKCC) based on a study by Hiltzik and colleagues (6). MSKCC PDTC are defined as tumors with increased proliferative activity (≥5 mitoses per 10 HPF) and/or necrosis, regardless of architecture or nuclear features. Thus, MSKCC PDTC includes tumors that are poorly differentiated by the WHO criteria and PTC with high-grade features (PTC HGF), that is, a PTC with increased mitotic activity and/or necrosis. In the study by Hiltzik and colleagues, tumors that fulfilled the MSKCC criteria had a five-year overall survival of 60%, similar to that of WHO-defined PDTC (4,6). In our study, we define PTC HGF as a tumor with maintained nuclear features of PTC with 5 or more mitoses per 10 HPF or tumor necrosis. Our threshold for mitotic count was based on the Hiltzik study. However, unlike the Hiltzik/MSKCC criteria, which group tumors that are PDTC by the WHO criteria with PTC HGF, in our study we evaluated PTC HGF and WHO-defined PDTC as separate groups.
Although the concept of grading over subtyping of PTC is not new (7,8), widespread adoption of grading in PTC is not commonly practiced. PTC HGF are excluded from the WHO category of PDTC and are subsumed under the morphologic subtype of PTC to which they resemble (1). As such, the aggressive nature of these tumors may be underrecognized. Although individual institutions may utilize the terminology of PTC HGF, diagnostic criteria have not been established, and there have been limited comparisons between PTC HGF and WHO-defined PDTC (9,10). Thus, the goal of this study was to propose criteria for PTC HGF and compare the pathologic, clinical, and molecular features of PTC HGF and WHO-defined PDTC.
Methods
Study population and data acquisition
Approval was obtained from the Brigham and Women's Hospital Institutional Review Board. Tumors diagnosed between 2005 and 2019 that met criteria for PTC HGF were identified. PTC HGF had maintained nuclear features of PTC along with ≥5 mitoses per 10 HPF (equivalent to 2.4 mm2 on an Olympus BX41 microscope) and/or tumor necrosis. Necrosis was defined as true tumor-type coagulative necrosis or comedo necrosis (with ghosts of tumor cells and karyorrhectic debris). Histopathologic characteristics, including tumor size, PTC morphology, mitotic count (per 10 HPF/2.4 mm2) in the area of the tumor with highest mitotic activity, necrosis, stage, margin status, and lymph node metastases, were recorded for each case. For cases that had a Ki-67 performed at the time of initial review, the Ki-67 proliferative index was recorded. We had previously characterized a cohort of 47 cases of PDTC that were resected between 2005 and 2018 (11). All cases met the 2017 Endocrine WHO criteria for PDTC (1). Tumors with any poorly differentiated component were included. PDTC had previously been categorized by extent of invasion as follows: (i) encapsulated with capsular invasion only, (ii) encapsulated with focal (<4 foci) vascular invasion, (iii) encapsulated with extensive (≥4 foci) vascular invasion, and (iv) widely invasive (grossly invasive through the gland, often with extensive vascular invasion).
For all study cases, tumors with progression to ATC were excluded. Tumors were extensively sampled to evaluate for progression to ATC, with an average of 2.6 slides submitted per centimeter of tumor. All slides were evaluated for progression to ATC, defined by the presence of areas of squamoid, sarcomatoid, pleomorphic giant cell, or epithelioid morphology along with marked pleomorphism and increased mitotic activity and/or necrosis. For the PTC HGF group, the entire tumor demonstrated maintained nuclear features of PTC. For all cases, tumor stage was determined using the criteria defined in the 8th edition of the American Joint Committee on Cancer TNM staging system (AJCC) (12). Clinical information and follow-up data were obtained from the electronic medical record. For cases with clinical follow-up data available, disease-free survival (DFS), defined as the time from initial diagnosis to disease recurrence (local or distant), and disease-specific survival (DSS), defined as the time from initial diagnosis to death, were recorded.
Molecular analysis
Targeted next-generation sequencing (NGS) was performed on cases of PDTC and PTC HGF with residual material available using the OncoPanel assay developed at Brigham and Women's Hospital, as previously described (13). Depending on the version of OncoPanel used at the time, bait sets covered either 298 genes or an extended panel of 447 genes (see Supplementary Tables S1 and S2 for a list of genes evaluated). For all cases, TERT was analyzed by NGS. In addition, a subset of cases (27 cases) underwent Sanger sequencing of the TERT promoter region to confirm TERT NGS findings. DNA samples were screened for mutations in the promoter region of TERT gene using a laboratory-developed Sanger sequencing-based method. Extracted DNA was amplified using the GC-RICH PCR system (Sigma-Aldrich) and M13 tagged primers flanking the promoter, as described previously (14). Exo-SAP purified amplicons were then Sanger sequenced using M13 primers on an automated ABI 3730 capillary electrophoresis system. Sequencher Software was used to analyze the ABI sequence data. All TERT mutations that were detected by Sanger sequencing had also been detected by OncoPanel.
Statistical analyses
A Mann–Whitney U-test or Fisher exact test was used to compare continuous and categorical variables, respectively. Survival was analyzed using the Kaplan–Meier estimation method, and differences in survival were evaluated using the log-rank test (Prism 8; GraphPad, La Jolla, CA). For all statistical analyses, p-values <0.05 were considered significant.
Results
PTC HGF cohort characteristics
The clinicopathologic characteristics of the PTC HGF cases are summarized in Table 1, with histologic features shown in Figure 1. The median mitotic count was 9/10 HPF, and 5 (33%) cases had tumor necrosis. Data for the Ki-67 proliferative index were available for 9 (60%) cases of PTC HGF. The median Ki-67 proliferative index was 20%. The morphology of PTC was columnar in 5 (33%) cases, tall cell in 2 (13%) cases, hobnail in 2 (13%) cases, solid in 1 (7%) case, classic in 1 (7%) case, mixed tall cell/hobnail in 3 (20%) cases, and mixed tall cell/columnar in 1 (7%) case. In the 8 cases which had been reviewed as consultations, the original diagnosis was diffuse sclerosing variant in 1 (13%) case, columnar cell variant in 1 (13%) case, and classic type in 6 (75%) cases.

Examples PTC HGF. Most tumors had the morphology of an aggressive PTC subtype such as columnar cell variant (
Clinicopathologic Characteristics of Patients with Papillary Thyroid Carcinoma with High-Grade Features vs. Poorly Differentiated Thyroid Carcinoma
One patient with a tumor arising in a TDC also had TDC resection in addition to total thyroidectomy.
Of 21 (45%) patients with lymph nodes taken at the time of thyroid resection.
Including only patients who were M0 at diagnosis and only 42 (89%) PDTC patients with sufficient clinical follow-up.
Excluding three PDTC patients without long-enough follow-up.
Excluding 10 PDTC and 2 PTC HGF patients without long-enough follow-up.
HPF, high-power fields; ns, not significant; PDTC, poorly differentiated thyroid carcinoma; PTC HGF, papillary thyroid carcinoma with high-grade features; TDC, thyroglossal duct cyst.
PDTC cohort characteristics
The clinicopathologic characteristics of the PDTC cases are also summarized in Table 1. Histologic features of PDTC are shown in Figure 2. A precursor tumor was identified in 40 (85%) cases, including follicular thyroid carcinoma (FTC) in 11 (23%) cases, Hurthle cell carcinoma in 15 (32%) cases, and PTC in 14 (30%) cases, the latter of which included 12 follicular variants, 1 columnar cell variant, and 1 PTC that had areas of tall cell and hobnail morphology, but also had solid areas with a loss of nuclear features of PTC (and was therefore categorized as PDTC). The median mitotic count was 5/10 HPF within the PD component (range: 1–34/10 HPF), and tumor necrosis was present in 21 (45%) cases. Data for the Ki-67 proliferative index were available for 29 (62%) cases of PDTC. The median Ki-67 proliferative index was 15%. Although some cases had convoluted nuclei, all cases (in addition to having solid/trabecular/insular growth) had ≥3 mitoses per 10 HPF or tumor necrosis. Evaluation of extent of invasion demonstrated that 8 (17%) tumors were encapsulated with capsular penetration only, 5 (11%) were encapsulated with focal vascular invasion, 18 (38%) were encapsulated with extensive vascular invasion, and 16 (34%) were widely invasive.
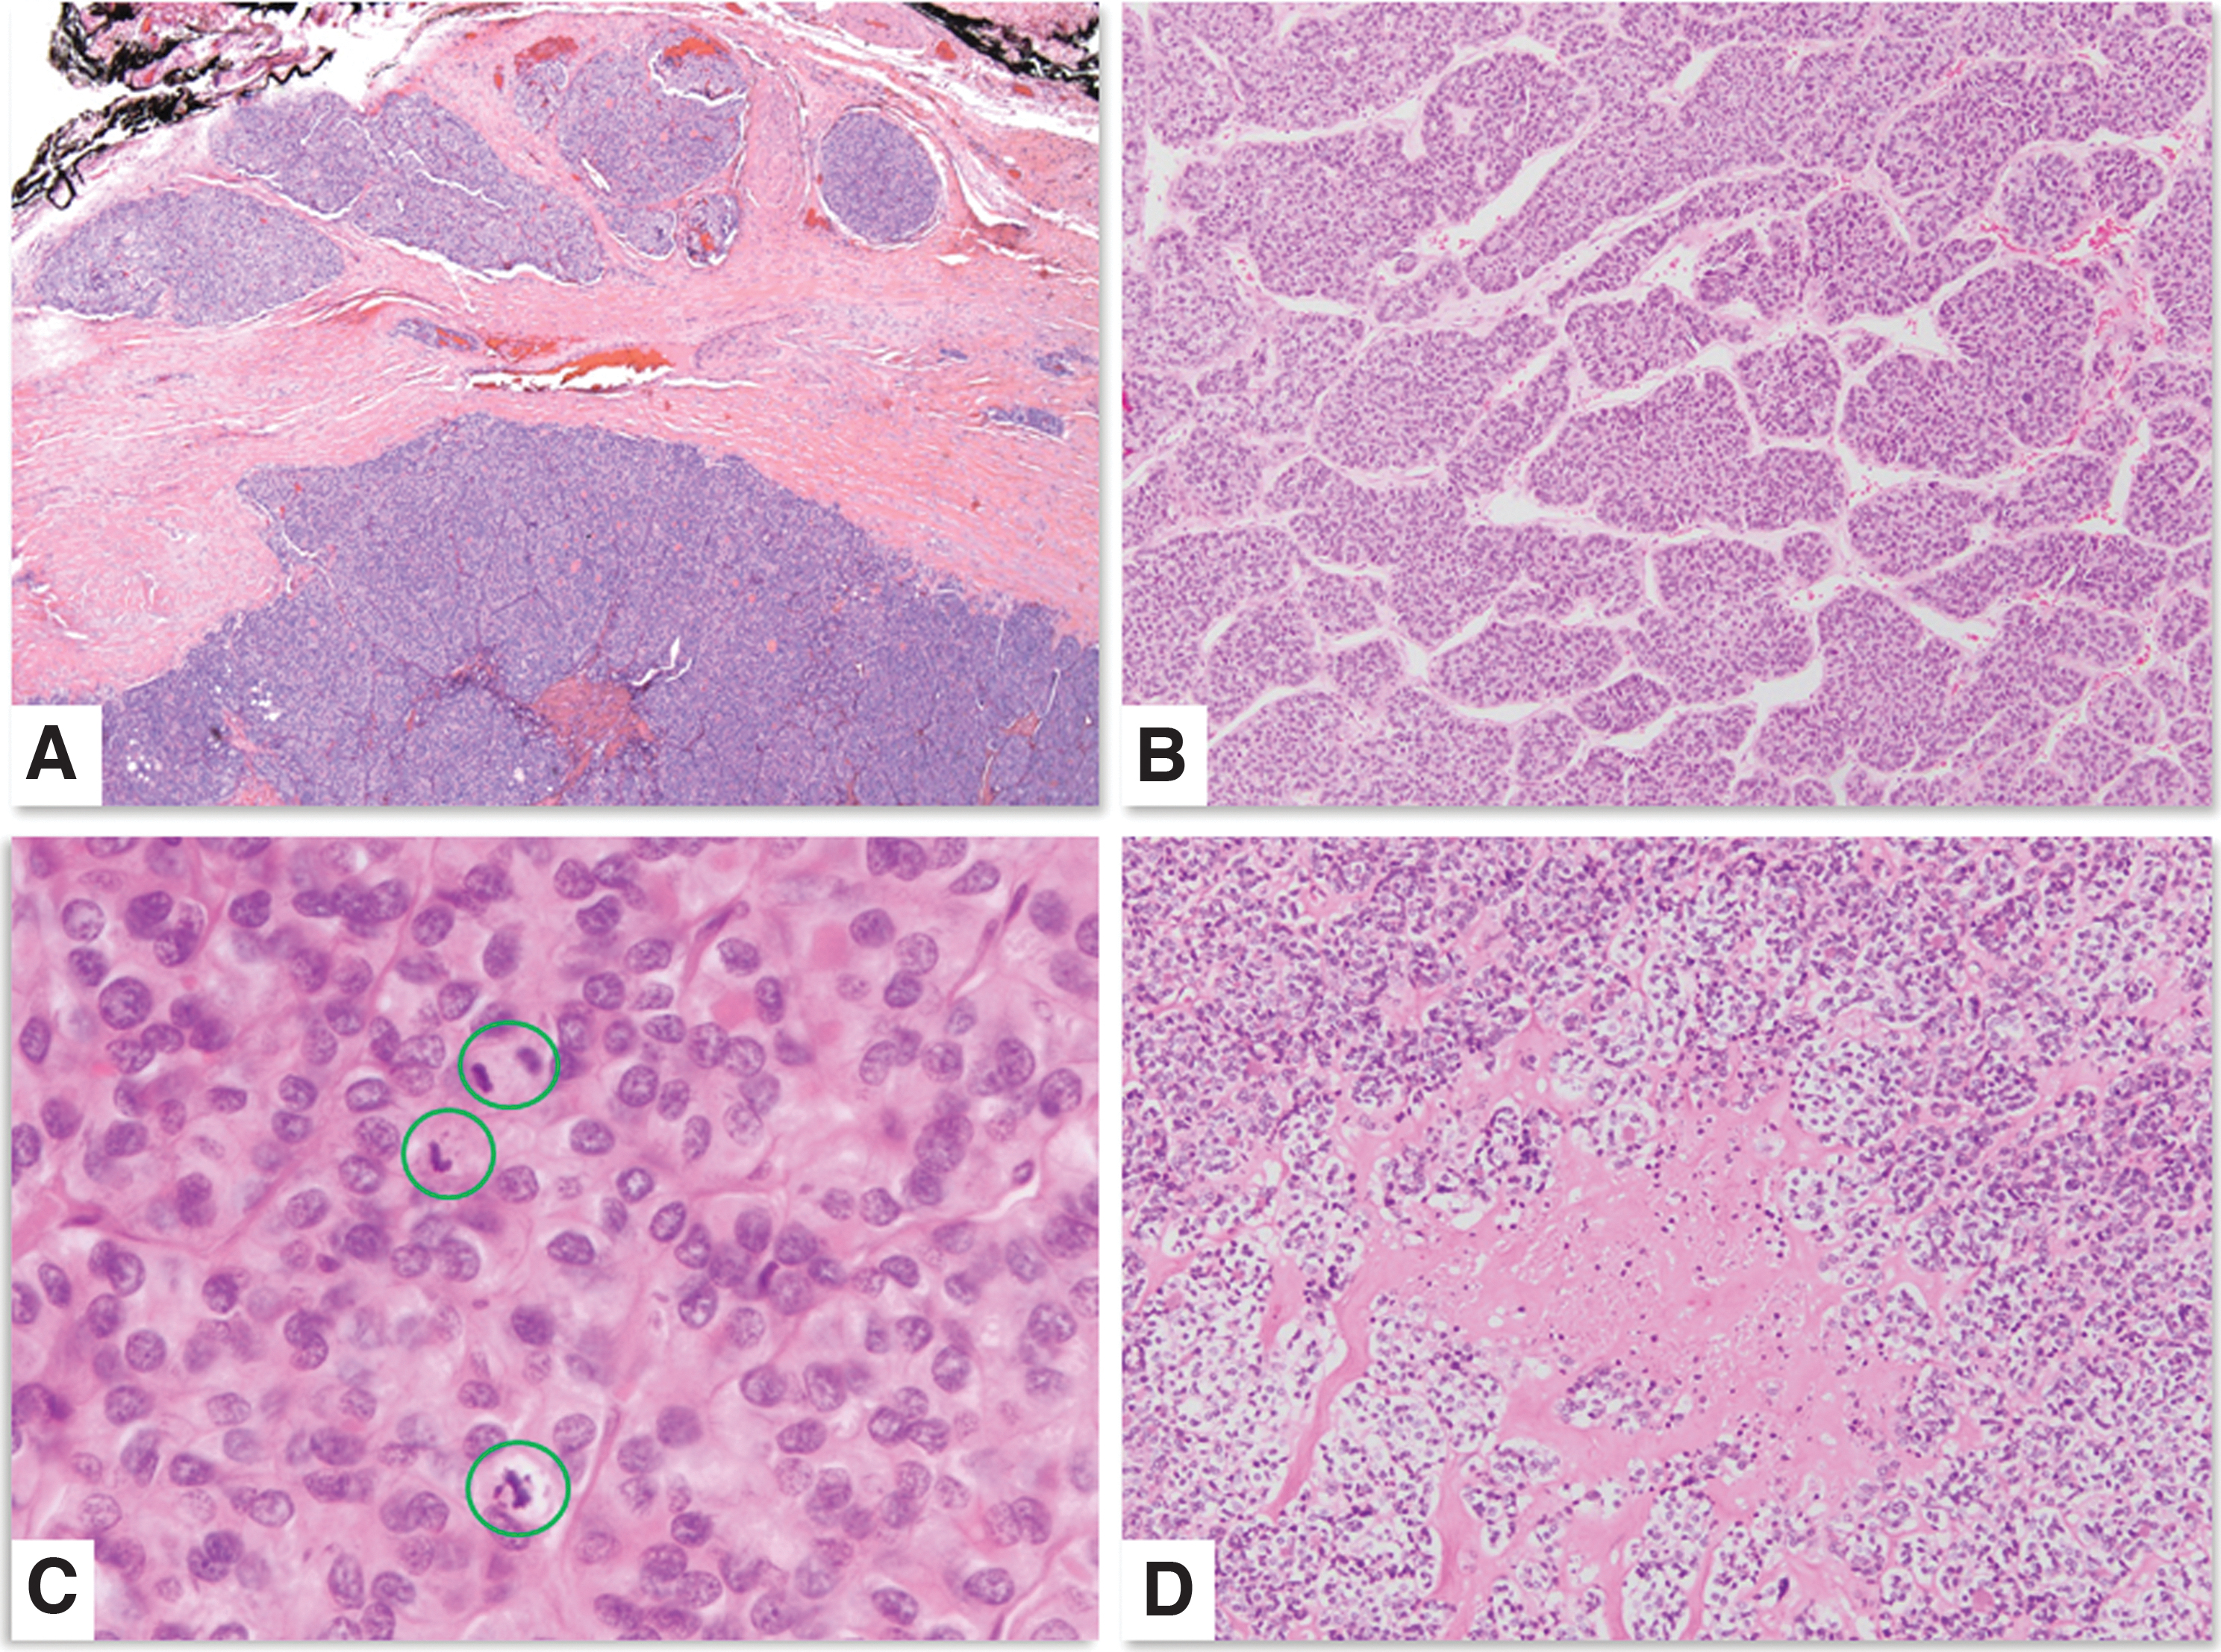
Examples of WHO-defined PDTC. All tumors demonstrated invasive growth (
Comparisons of clinicopathologic characteristics of the PTC HGF and PDTC cohorts are summarized in Table 1. Patients with PTC HGF were older (p = 0.012). There were no differences in male-to-female ratio, tumor size, or presence of distant metastases at diagnosis. Positive resection margin (87% PTC HGF vs. 23% PDTC, p < 0.001), pT4 disease (53% PTC HGF vs. 13% PDTC, p = 0.0027), and lymph node metastases (73% PTC vs. HGF 38% PDTC, p = 0.049) were different between groups. Given the differences in mitotic cutoff used for PTC HGF and PDTC, not surprisingly the median mitotic count was higher in PTC HGF (9 vs. 5, p = 0.0039), although there was no difference in the median Ki-67 proliferative index (p = 0.36).
Clinical outcome of PTC HGF versus PDTC
All patients with PTC HGF had follow-up information available, with 6 (40%) patients having died of disease (median survival 1.5 years, range 0.8–1.8), 7 (47%) alive with disease, and 2 (13%) with no evidence of disease (with a follow-up of 2.1 and 3 years). Of the patients who were alive with disease, 5 had distant metastases and 2 had local recurrences only. Overall, the one-, two-, and five-year DFS for patients who were M0 at diagnosis with long-enough follow-up was 67%, 44%, and 0%, respectively. Forty-two (89%) patients with PDTC had follow-up data. Of these patients, 7 (17%) died of disease, with a median survival of 6.3 years (range: 2.5–10 years). Eleven (26%) patients were alive with distant metastatic disease at last follow-up, and 24 (57%) had no evidence of disease with a median follow-up of 7.3 years. When excluding patients without long-enough follow-up, the one-, two-, and five-year DFS was 88%, 84%, and 67%, respectively, in patients who were M0 at diagnosis. Using Kaplan–Meier analysis, the difference in DFS between patients with PTC HGF and PDTC among those who were M0 at diagnosis was significantly different (p = 0.0017) (Fig. 3A). The DSS was also different for patients with PTC HGF and PDTC (p < 0.001) (Fig. 3B). When comparing only patients with widely invasive (WI) PDTC, which had less disparate rates of pT4 tumors (46% T4 PDTC-WI vs. 53% T4 PTC HGF) and positive resection margins (54% PDTC-WI vs. 87% PTC HGF), although there was no difference in DFS between groups (p = 0.68) (Fig. 4A), the difference in DSS remained significant (p = 0.040) (Fig. 4B).
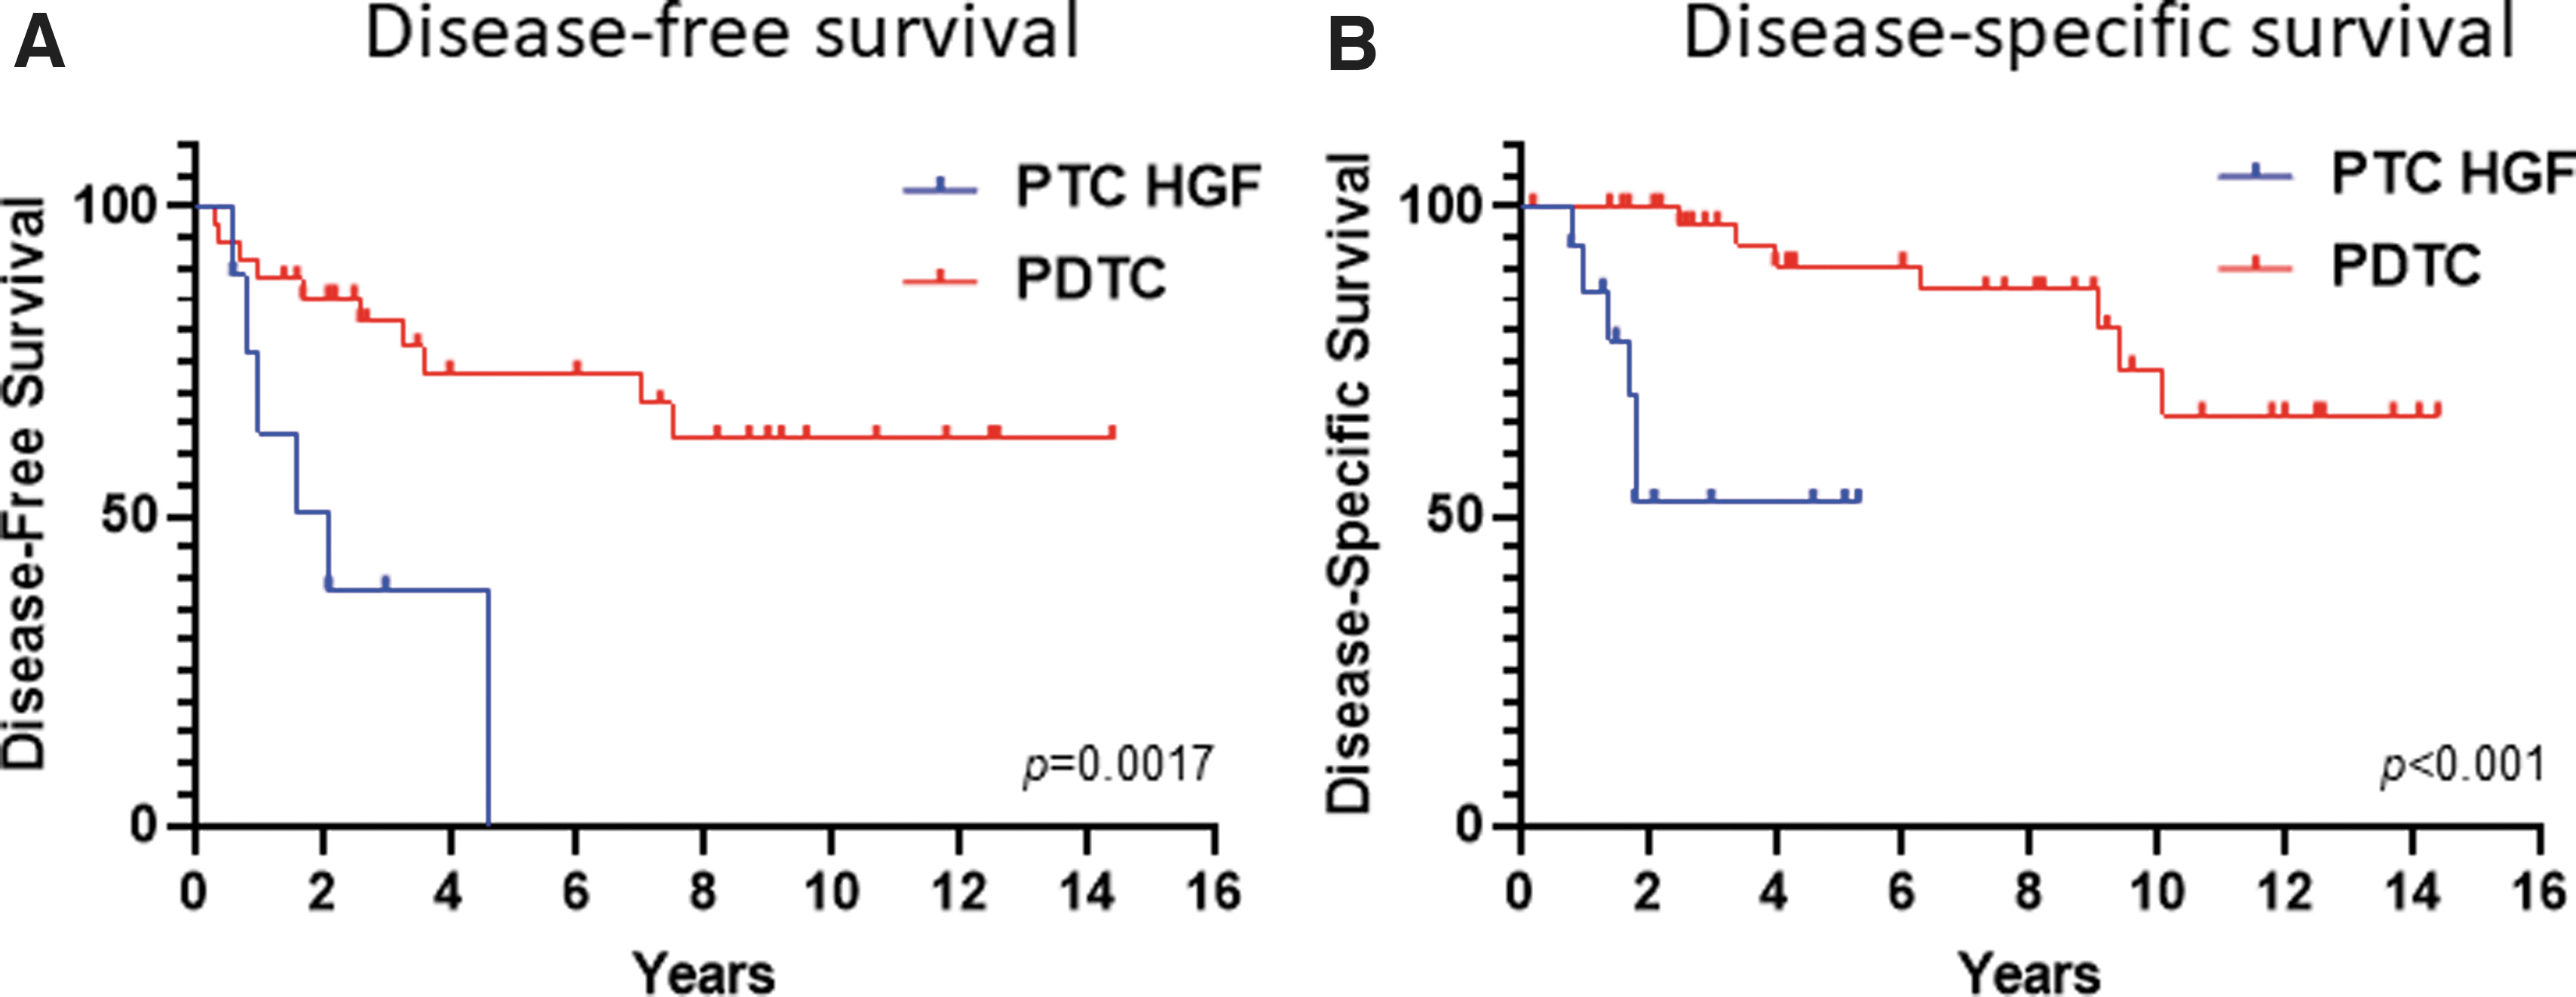
DFS for patients with M0 disease with PTC HGF and PDTC (
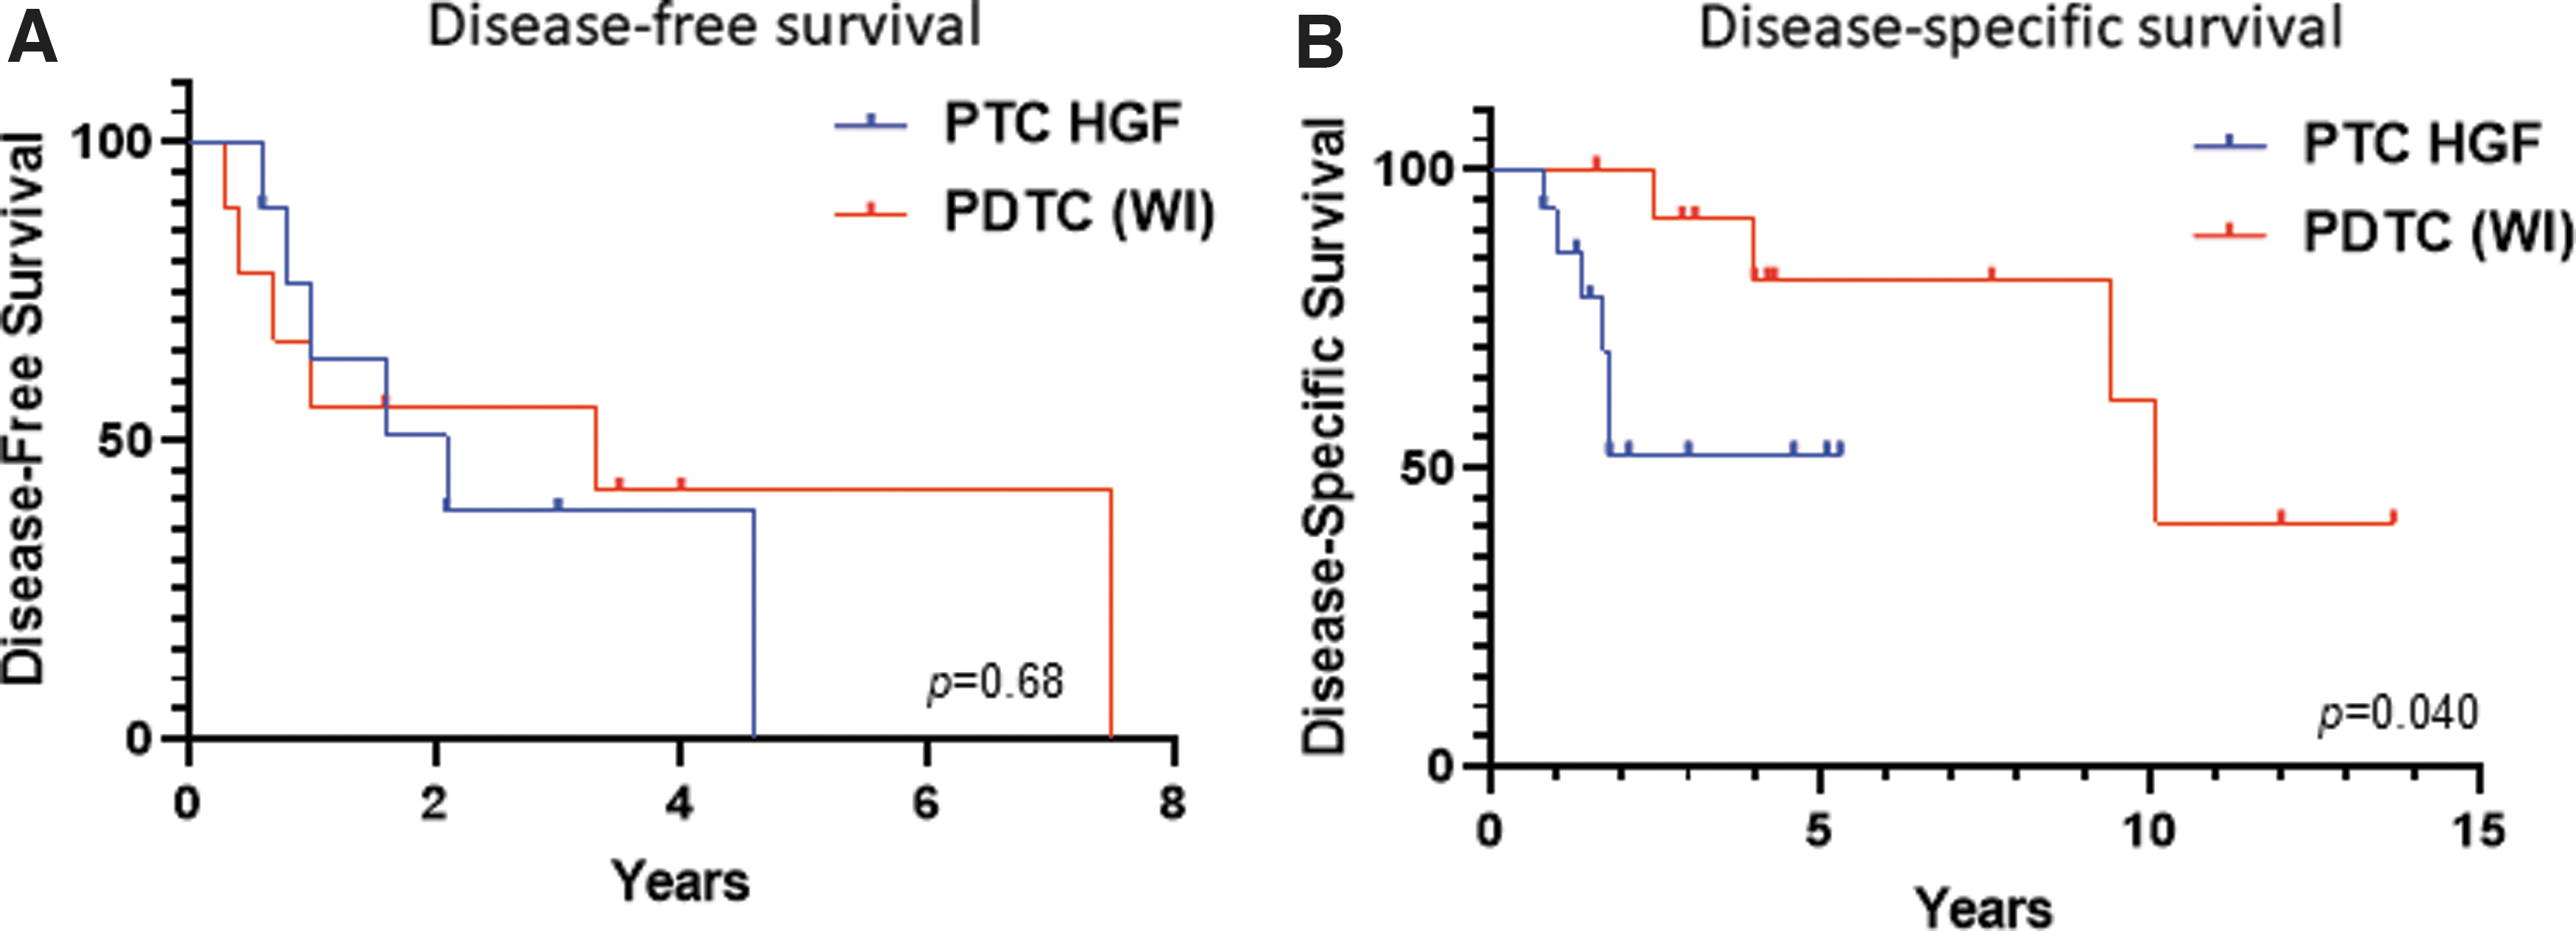
DFS for patients with M0 disease with PTC HGF and widely invasive PDTC (
Molecular characteristics of PTC HGF versus PDTC
Material for NGS was available for 12 (80%) PTC HGF and 33 (70%) PDTC, with detected alterations summarized in Table 2. PTC HGF harbored driver mutations in 11 (92%) cases, including BRAF V600E mutations in 5 (42%) cases, RAS mutations in 2 (17%) cases (including HRAS Q61R and NRAS Q61R ), and gene fusions (including ETV6-NTRK3, AGK-BRAF, and CCDC30-ROS1) in 3 (25%) cases. Secondary mutations in TP53 and TERT were each detected in 4 (33%) cases, while 1q gain was seen in 8 (67%) cases and 22q loss in 5 (33%) cases. Putative driver mutations were found in 13 (39%) PDTC, including BRAF V600E or N486_P490del mutations in 2 (6%) cases, RAS hotspot mutations in 10 (30%) cases (including NRAS Q61R , NRAS Q61K , HRAS G13R , HRAS Q61R , and KRAS Q61R ), and a PAX8-PPARG fusion in 1 (3%) case. For PDTC-sequenced samples that had a precursor tumor, three of six PDTC with an FTC precursor had a RAS mutation and one case had PAX8-PPARG gene fusion, while four of seven PDTC with a follicular variant of PTC precursor had a RAS mutation and one case had BRAF N486_P490del. The one PTC that had areas of tall cell and hobnail morphology but also had solid areas with a loss of nuclear features of PTC had the only BRAF V600E mutation in the PDTC group. Likely pathogenic TP53 mutations were detected in 5 (15%) PDTC cases, while TERT promoter mutations were seen in 10 (30%) cases. TERT mutations co-occurred with RAS mutations in 7 (21%) cases. Recurrent copy number alterations included 1q gain in 5 (15%) PDTC cases and 22q loss in 8 (24%) cases. In addition, multiple whole chromosome losses in combination with allelic fractions suggestive of widespread loss of heterozygosity were detected in 7 (21%) PDTC (including 54% of oncocytic PDTC). The BRAF V600E mutation rate and rate of 1q gain were higher in PTC HGF compared with PDTC (p = 0.003 and p = 0.002, respectively), and there was a trend toward more gene fusions in PTC HGF (p = 0.052).
Molecular Characteristics of Papillary Thyroid Carcinoma with High-Grade Features vs. Poorly Differentiated Thyroid Carcinoma
RAS mutations included: NRAS Q61R , NRAS Q61K , HRAS G13R , HRAS Q61R , and KRAS Q61R .
Discussion
We compared the pathologic, molecular, and clinical features of PTC HGF and WHO-defined PDTC. PTC HGF occurred in older patients and were more likely to demonstrate significant extrathyroidal extension (pT4 disease), positive resection margins, and lymph node metastases compared with PDTC. Outcomes, including DFS and DSS, were also different between these groups. When considering only patients with M0 disease at diagnosis, the five-year DFS was 67% for PDTC and 0% for PTC HGF. However, we had previously demonstrated that our cohort of PDTC is heterogeneous, with a worse outcome seen in patients with widely invasive tumors compared with those with tumors with only capsular invasion or focal (<4 foci) vascular invasion (11). Given this finding, a more limited comparison of PTC HGF was performed with only widely invasive PDTC, which had a similar proportion of pT4 tumors. In this subgroup analysis, although there was no difference in DFS, a difference in DSS was present. It must be acknowledged that most PTC HGF in our cohort had a positive resection margin. Even in the subgroup analysis comparing widely invasive PDTC with PTC HGF, the rate of positive margin was higher in the PTC HGF group (87% PTC HGF vs. 54% PDTC-WI). Thus, we cannot exclude the possibility that incomplete surgical resection contributed to the outcome for the PTC HGF group.
The majority of PTC HGF in our cohort were aggressive PTC subtypes such as hobnail, tall cell, or columnar cell variant. However, for the tumors that we classified as PTC HGF which were reviewed as consultations, 75% of cases had been diagnosed as classic PTC at the outside hospital despite histologic features of an aggressive subtype. Aggressive PTC subtypes such as the hobnail variant or columnar cell variant are rare, and therefore, most pathologists have limited experience diagnosing these tumors. Moreover, not all tumors that have a histologic appearance suggestive of columnar cell variant or hobnail variant pursue an aggressive clinical course. For example, columnar cell variant that as well circumscribed has been shown to pursue an indolent clinical course, and some indolent classic PTC can mimic true hobnail variant of PTC (15,16). Finally, although the tall cell variant is considered an aggressive PTC subtype, the outcome for tall cell variant overall is significantly better than that of PTC HGF. In a multivariate analysis performed by Wang and colleagues (17), the cause-specific death rate for tall cell variant was 8%; whereas 40% of patients with PTC HGF in our cohort had died of disease and 47% were alive with disease at last follow-up. Emphasizing grading (based on mitotic count and necrosis) over histologic subtype could potentially help pathologists identify PTC that are likely to pursue an aggressive clinical course. It would be valuable in future studies to evaluate interobserver reproducibility in identifying PTC HGF and compare this with reproducibility of identifying rare PTC variants. Although we did not utilize Ki-67 proliferative index to define PTC HGF, recently Fuchs and colleagues reported Ki-67 proliferative index as a parameter for grading medullary thyroid carcinoma (18). Evaluating Ki-67 proliferative index could also help identify these aggressive PTC. The median Ki-67 proliferative index was 20% for the PTC HGF cases in our cohort. It has been shown that 95% of differentiated thyroid carcinomas have a Ki-67 index below 5% (19), and thus, a Ki-67 proliferative index above 5% should raise concern that the tumor is an aggressive PTC. Finally, it is important to note that PTC HGF has a propensity to dedifferentiate to ATC and that even a minor ATC component is important to recognize due to the prognostic and treatment implications (20).
We believe it is important to distinguish PTC HGF from WHO-defined PDTC based on molecular differences between these tumors. PTC HGF had a higher BRAF V600E mutation rate (42% of cases) as a driver event compared with PDTC (3% of cases). Conversely, PDTC had a higher rate of RAS mutations (30% of cases), although the difference with PTC HGF (17% of cases) did not reach significance. These findings are not surprising given that the BRAF V600E mutation has been associated with pronounced nuclear features of PTC, and that the tall cell and hobnail variants of PTC have been shown to frequently harbor the BRAF V600E mutation (21 –24). In contrast, RAS mutations are more commonly seen in follicular-patterned tumors without or with only subtle nuclear features of PTC (25 –27). Our findings are consistent with those of an MSKCC study by Landa and colleagues evaluating the genomic landmarks of PDTC (10). In this study they found that 81% of BRAF mutations occurred in PDTC that met only the MSKCC criteria for PDTC (and thus likely mostly represent PTC HGF). In contrast, 92% of RAS mutations were found in PDTC fulfilling the WHO criteria. Both BRAF V600E -mutant PTC and RAS-mutant PTC have activation of the MAPK-signaling pathway; however, BRAF V600E -mutant PTC have comparatively increased MAPK-signaling, which has been linked to decreased thyroid differentiation and decreased radioactive iodine uptake. Thus, separating BRAF-like PTC HGF from more RAS-like WHO-defined PDTC has potential implications for radioactive iodine treatment. In addition, the increasing use of molecular testing and targeted therapy further justifies this split. For example, use of dabrafenib in BRAF-mutant thyroid cancers has been shown to result in durable responses in patients with metastatic disease (28). Finally, we found that relative gain of 1q occurred at a higher rate in PTC HGF than in PDTC (67% and 15%, respectively). Interestingly, Gandolfi and colleagues recently reported that 1q gain was associated with distant metastases in PTC and even predicted a worse survival in PTC with distant metastases (29).
We recognize that our findings should be interpreted with some caution given the small cohort size and origin from a single institution. However, our results indicate that PTC HGF are important to identify based on their aggressive clinical course and that PTC HGF and PDTC should potentially be considered separate entities given their differing molecular profiles. We look forward to additional studies that further explore PTC HGF as a distinct subset of aggressive thyroid tumors.
Footnotes
Authors' Contributions
All authors and coauthors have significantly contributed. K.S.W.: data collection and analysis and writing and review of the article. F.D.: data analysis and review and editing of the article. M.T.: contribution of data and review and editing of the article. J.H.L., E.K.A., E.M., N.L.C., M.A.N., and G.M.D.: contribution to data and review and editing of the article. M.A.: data analysis and review and editing of the article. J.A.B.: study design, data analysis, and writing of the article.
Author Disclosure Statement
Dr. J.L. receives research support to the institution from Novartis, Bayer, Takeda, BMS, and is on the advisory board of Novartis, Bayer, and Genentech. K.S.W., F.D., M.T., E.K.A., E.M., N.L.C., M.A.N., G.M.D., M.A., and J.A.B.: no disclosures or conflict of interest.
Funding Information
There is no funding information to declare.
Supplementary Material
Supplementary Table S1
Supplementary Table S2