
Abstract
Background:
The present study aimed to establish age- and sex-specific reference intervals for serum concentrations of thyrotropin (TSH), free triiodothyronine (fT3), and free thyroxine (fT4) in healthy children and adolescents. Additionally, we investigated the association of TSH, fT3, and fT4 with putative influencing factors, such as sex, body mass index (BMI), and puberty.
Methods:
A total of 9404 blood serum samples from 3140 children and adolescents without thyroid affecting diseases were included in determining TSH, fT3, and fT4 levels and age- and sex-specific reference ranges. To investigate the association of TSH, fT3, and fT4 with age, sex, weight status, and the role of puberty-based changes, the hormone levels and BMI values were converted to standard deviation scores (SDS).
Results:
In general, TSH, fT3, and fT4 were found to be age- and sex-dependent. Puberty was accompanied by decreased TSH, decreased fT3 with a temporary peak in males, and a temporary nadir of fT4 in Tanner stage 3 for both sexes. BMI-SDS was positively associated with TSH-SDS (β = 0.081, p < 0.001); the effect was more pronounced in overweight subjects (β = 0.142, p < 0.01) and insignificantly negative in underweight subjects (β = −0.047, p > 0.05). BMI-SDS was positively associated with fT3-SDS (β = 0.066, p < 0.001) and negatively associated with fT4-SDS (β = −0.135, p < 0.001), with the effect insignificantly less negative in overweight children (β = −0.055, p > 0.05).
Conclusions:
Age- and sex-specific reference intervals are important for the interpretation of measurements of TSH, fT3, and fT4 in children and adolescents. Influencing factors such as BMI and puberty should be taken into consideration when using measurements of TSH and thyroid hormones in the diagnosis, treatment, and monitoring of thyroid diseases. Clinical Trial Registration number: NCT02550236.
Introduction
Effective thyroid function is essential for growth and development in young people. Even minor variations in thyroid hormone homeostasis are associated with sequela in terms of growth, energy expenditure, and metabolic disturbances (1).
Moreover, the thyroid hormones triiodothyronine (T3) and thyroxine (T4) control aspects of brain maturation, such as neuronal and glial cell development, myelination, and synaptogenesis (2). Determining abnormalities in levels of thyrotropin (TSH), free triiodothyronine (fT3), and free thyroxine (fT4) is therefore an invaluable diagnostic tool for identifying thyroid dysfunction and preventing thyroid diseases. However, the interpretation of thyroid hormone levels and the decision whether, and how, a patient with suspected hypo- or hyperthyroidism is to be treated often remain a matter of debate, particularly in the case of young children and adolescents (3,4). This difficulty becomes particularly apparent in the case of subclinical hypothyroidism in children, which is described by Monzani et al. (5) as a “benign and remitting process with a low risk of evolution toward an overt hypothyroidism,” although it is associated with clinical manifestations as menstrual disorders, goiter, short stature, and lower high-density lipoprotein cholesterol levels (6 –8).
Research has indicated that there is a complex inverse relationship between TSH and fT4 levels and that the precise nature of this relationship is specific to the individual (9). fT3, the more active thyroid hormone, gives only indirect information about thyroid status. Laboratory testing for hypo- or hyperthyroidism identifies increased or reduced levels of TSH, fT3, and fT4 with respect to predetermined reference ranges, which may be adjusted for confounding factors such as age—recommended by the European Thyroid Association (10)—and sex. Recent reference range studies for TSH, fT4, and fT3 in children and adolescents are limited insofar as they estimate the relationship between age and thyroid hormone levels based on a low number of subjects in arbitrarily defined subgroups and/or fail to investigate the effect of key pediatric confounders including age, sex, and puberty (11). It is well established that obesity is a serious issue in the development of children and adolescents. However, whether or not weight status has an influence on TSH, fT4, and fT3 levels remains to be clarified. The role of changes in sex hormone concentrations and the effect of puberty also remain unclear or uncertain. As such, published reference ranges are often limited in their practical usefulness.
The aim of this study was to establish comprehensive new pediatric reference ranges for TSH, fT4, and fT3 having adjusted for age, sex, weight status, and puberty, where appropriate, and based on a large number of subjects and samples. To this end, we included 9486 blood samples from 3140 thyroid-healthy pediatric subjects selected from a large cohort study of children and adolescents.
Methods
Study setting
The longitudinal epidemiological LIFE Child study is run by the LIFE Research Center for Civilization Diseases, Leipzig, Germany. The LIFE Child Study aims to collect development data for infants, children, and adolescents and to focus on the causes of civilization diseases (12). Recruitment has been ongoing since 2011. All parents provided written informed consent, as do all participating children older than 12 years. The study was approved by the ethics committee of the University of Leipzig (Reg. No. 264-10-19042010) (13). Data from the LIFE Child study have already been used in numerous studies to establish reference intervals for various biomarkers in the blood of children and adolescents (14 –16). Germany and specifically the region around Leipzig have been described as mildly iodine-deficient areas relative to targets set by the World Health Organization, with urinary iodine values ranging from low to normal (17,18). In addition, our group recently showed that slightly reduced iodine values were not associated with thyroid dysfunction (18).
Participants
The cohort considered in this study included 3229 subjects who made a total of 10,002 visits between June 2011 and May 2019. Participants were invited for examination at the first 3, 6, and 12 months of age, and then once a year until the age of 18 years. The inclusion criteria were the availability of age, sex, and basic anthropometric and medical history information. Subjects suffering from diseases that affect thyroid function—for instance, hypothyroidism, hyperthyroidism, thyroid carcinoma, Hashimoto's thyroiditis, or severe liver disease—were excluded. All inclusion and exclusion criteria and the resulting sample sizes are presented in Figure 1. The final sample comprised 9404 serum samples from 3140 children and adolescents.

Flowchart of inclusion and exclusion criteria for the reference cohort derived from the LIFE Child study subjects. fT3, free triiodothyronine; fT4, free thyroxine; TSH, thyrotropin.
Anthropometric measures and pubertal status
Pubic hair of both sexes, the testicular volume of the boys, and the breast growth of the girls were examined by certified same-sex staff members to determine Tanner stages (TS, age >5 years) representing the pubertal status of adolescents (19,20).
Body mass index (BMI) was calculated using height and weight-squared values as measured. BMI was converted to a standard deviation score (SDS) according to external standards set out by Kromeyer-Hauschild et al. (21). Weight groups were defined, according to current national guidelines (22) and in reference to German reference data, as follows: underweight as BMI lower than the 10th percentile (SDS < −1.28); normal weight as BMI between the 10th and 90th percentiles (SDS = −1.28 to 1.28); overweight as BMI between the 90th and 97th percentiles (SDS >1.28 to 1.88); and obese as BMI higher than the 97th percentile (SDS >1.88).
Laboratory assessment
Subjects were required to fast overnight, and samples of venous blood were taken in the morning before the subjects had eaten (with 90% collected between 07:30 and 10:00, 96% by 11:00, 99% by 12:00, and 100% by 16:00). Samples were processed following standard operating procedures by trained staff from the LIFE-Biobank and sent directly to the Institute of Laboratory Medicine, Leipzig. Parameters of thyroid function (TSH, fT3, and fT4) were measured by electrochemiluminescence assays using a Cobas 601 or 801 module (Roche Diagnostics, Germany). Quality control (QC) data were calculated for 10 QC cycles with 15–110 runs per cycle over a representative range of each January from 2013 to 2016. The mean inter-assay coefficient of variation for the three measured biomarkers ranged from 2.25% to 3.11%; the mean deviation from the target value varied between 3.33% and 4.82%.
QC data for the individual assays are summarized in Supplementary Table S2.
Statistical analysis and calculation of reference intervals
Statistical analyses were performed using R statistical software (version 3.5.1; R Core Team, Vienna, Austria) (23). Age- and sex-specific reference ranges were estimated for the reference cohort (Fig. 1) using an lambda-mu-sigma (LMS) -type method (24) as implemented in the “gamlss” package (25,26). A resampling method from the ChildSDS package was applied to account for multiple measurements per subject (27). Confidence intervals for the percentiles were calculated as the empirical confidence bands during the resampling procedure. Reference ranges were represented through the 2.5th, 50th, and 97.5th percentile curves. The mean levels for thyroid hormones were estimated sex-specifically for individual TS, and significant differences were tested via analysis of covariance adjusted for age- and BMI-SDS. Hierarchical linear regression analyses were performed to determine associations between BMI-SDS and the thyroid hormone parameters. Effects were reported as regression coefficient (β) and the respective p-value (28).
Results
Description of the reference cohort
The age range of the healthy reference cohort was limited to subjects who were older than 2 months and younger than 18 years (mean ± standard deviation = 9.15 ± 4.89 years). Moreover, we included 242 underweight, 2350 normal weight, 203 overweight, and 304 obese children. Thyroid hormone mean values according to age and weight groups are shown in Table 1. The subcohort used to analyze puberty-based changes included 5603 serum samples from 2496 children. As expected, females were significantly younger at TS 1, 2, and 3 (p < 0.001) than males (Table 2).
Number of Serum Samples and Mean Values Including Standard Deviation of the LIFE Child Cohort Sorted Into Age Intervals and Body Mass Index Groups
Age intervals were determined on the basis of the high variability of hormone values during the first year of life (age interval 0–2 years) and the mean age of subjects grouped in each Tanner stage.
BMI, body mass index; fT3, free triiodothyronine; fT4, free thyroxine; NW, normal weight; OW, overweight; SD, standard deviation; TSH, thyrotropin; UW, underweight.
Mean of Hormone Values and Age According to Tanner Stages and Sex
p-Values show the significance of differences in mean age between sexes (n = 5603).
Influence of sex and age on thyroid hormone levels
The sex-dependent 2.5th, 50th, and 97.5th percentiles for TSH, fT3, and fT4 are reported in Figure 2. Age-dependent values for each percentile and the respective mean are reported in Supplementary Tables S1–S3.

Percentiles for TSH, fT3, and fT4 by age and sex. The 2.5th (dashed line), 50th (solid line), and 97.5th (dashed line) percentiles of males and females are shown for TSH (
Thyrotropin
The mean TSH level across the entire age range was 2.59 ± 1.19 μU/mL in females and 2.74 ± 1.29 μU/mL (p gender < 0.001) in males. Generally, TSH values decreased with increasing age (β = −0.05, p < 0.001). The 50th TSH percentiles demonstrated high variability during the first year of life: from 3.13 to 2.92 μU/mL in females and from 3.25 to 3.01 μU/mL in males. TSH data from subjects older than a year reveal a moderate decrease up to the age of 5 years, thereafter they remain relatively stable. The 50th percentile reached a nadir of 1.91 μU/mL at 18 years in females and of 2.15 μU/mL at 16 years in males. Males had slightly but significantly higher values in the 0.5–1 year (p < 0.01) and 13–15 year age groups (p < 0.05) (Supplementary Table S1).
Free triiodothyronine
The mean fT3 levels across the entire age range were 6.44 ± 0.9 pmol/L in females and 6.66 ± 0.76 pmol/L in males (p gender < 0.001) (Fig. 2B). In general, fT3 values decreased with increasing age (β = −0.05, p < 0.001), with the effect stronger in females (β = −0.081) than in males (β = −0.026, p interaction < 0.001). During the first year of life, and specifically at the earliest measurement point around 3 months of age, the 50th percentile of fT3 peaked at 6.86 pmol/L in females and 7.11 pmol/L in males. Beyond the first year of life, the 50th percentile of females' fT3 levels showed a uniform decrease to a nadir of 5.27 pmol/L at 18 years. In contrast, males' values showed a temporary nadir of 6.51 pmol/L, followed by an increase to 6.67 pmol/L at 14 years and an absolute nadir of 6.06 pmol/L at the age of 18 years. Females had significantly higher values than males in the age groups 9–11 (p < 0.01) and 11–12 (p < 0.01) years but lower values between 12 and 18 years (p < 0.001) (Supplementary Table S2).
Free thyroxine
The mean fT4 across the entire age range was 15.95 ± 2.11 pmol/L in females and 16.07 ± 1.99 pmol/L in males (p gender < 0.01) (Fig. 2C). Again, fT4 values decreased with increasing age (β = −0.089, p < 0.001) with the effect stronger in females (β = −0.111) than in males (β = −0.068, p interaction < 0.001). fT4 levels exhibited lower variability over the first year compared with TSH and fT3. The 50th percentile of fT4 in females reached its maximum of 16.61 pmol/L between 5 and 6 years of age, then decreased to a nadir of 14.77 pmol/L at 13 years before rising again to 15.70 pmol/L at 18 years. In contrast, the 50th percentile of fT4 in males reached a maximum of 16.72 pmol/L at the first measuring point at 3 months, decreased to a nadir of 15.10 pmol/L at 14 years, and increased again to 15.80 pmol/L at 18 years. Girls showed significantly higher mean values than boys in the 3–5 year (p < 0.05) and 7–9 year (p < 0.05) bands but lower values in the 10–13 year (p < 0.01) and 15–18 year ranges (p < 0.05) (Supplementary Table S3).
Influence of puberty stages on thyroid hormone levels
Thyrotropin
Values constantly decreased across all TS in both sexes (p < 0.001) with a somewhat more pronounced reduction in females (p < 0.001) compared with males (p < 0.05) (Fig. 3A).
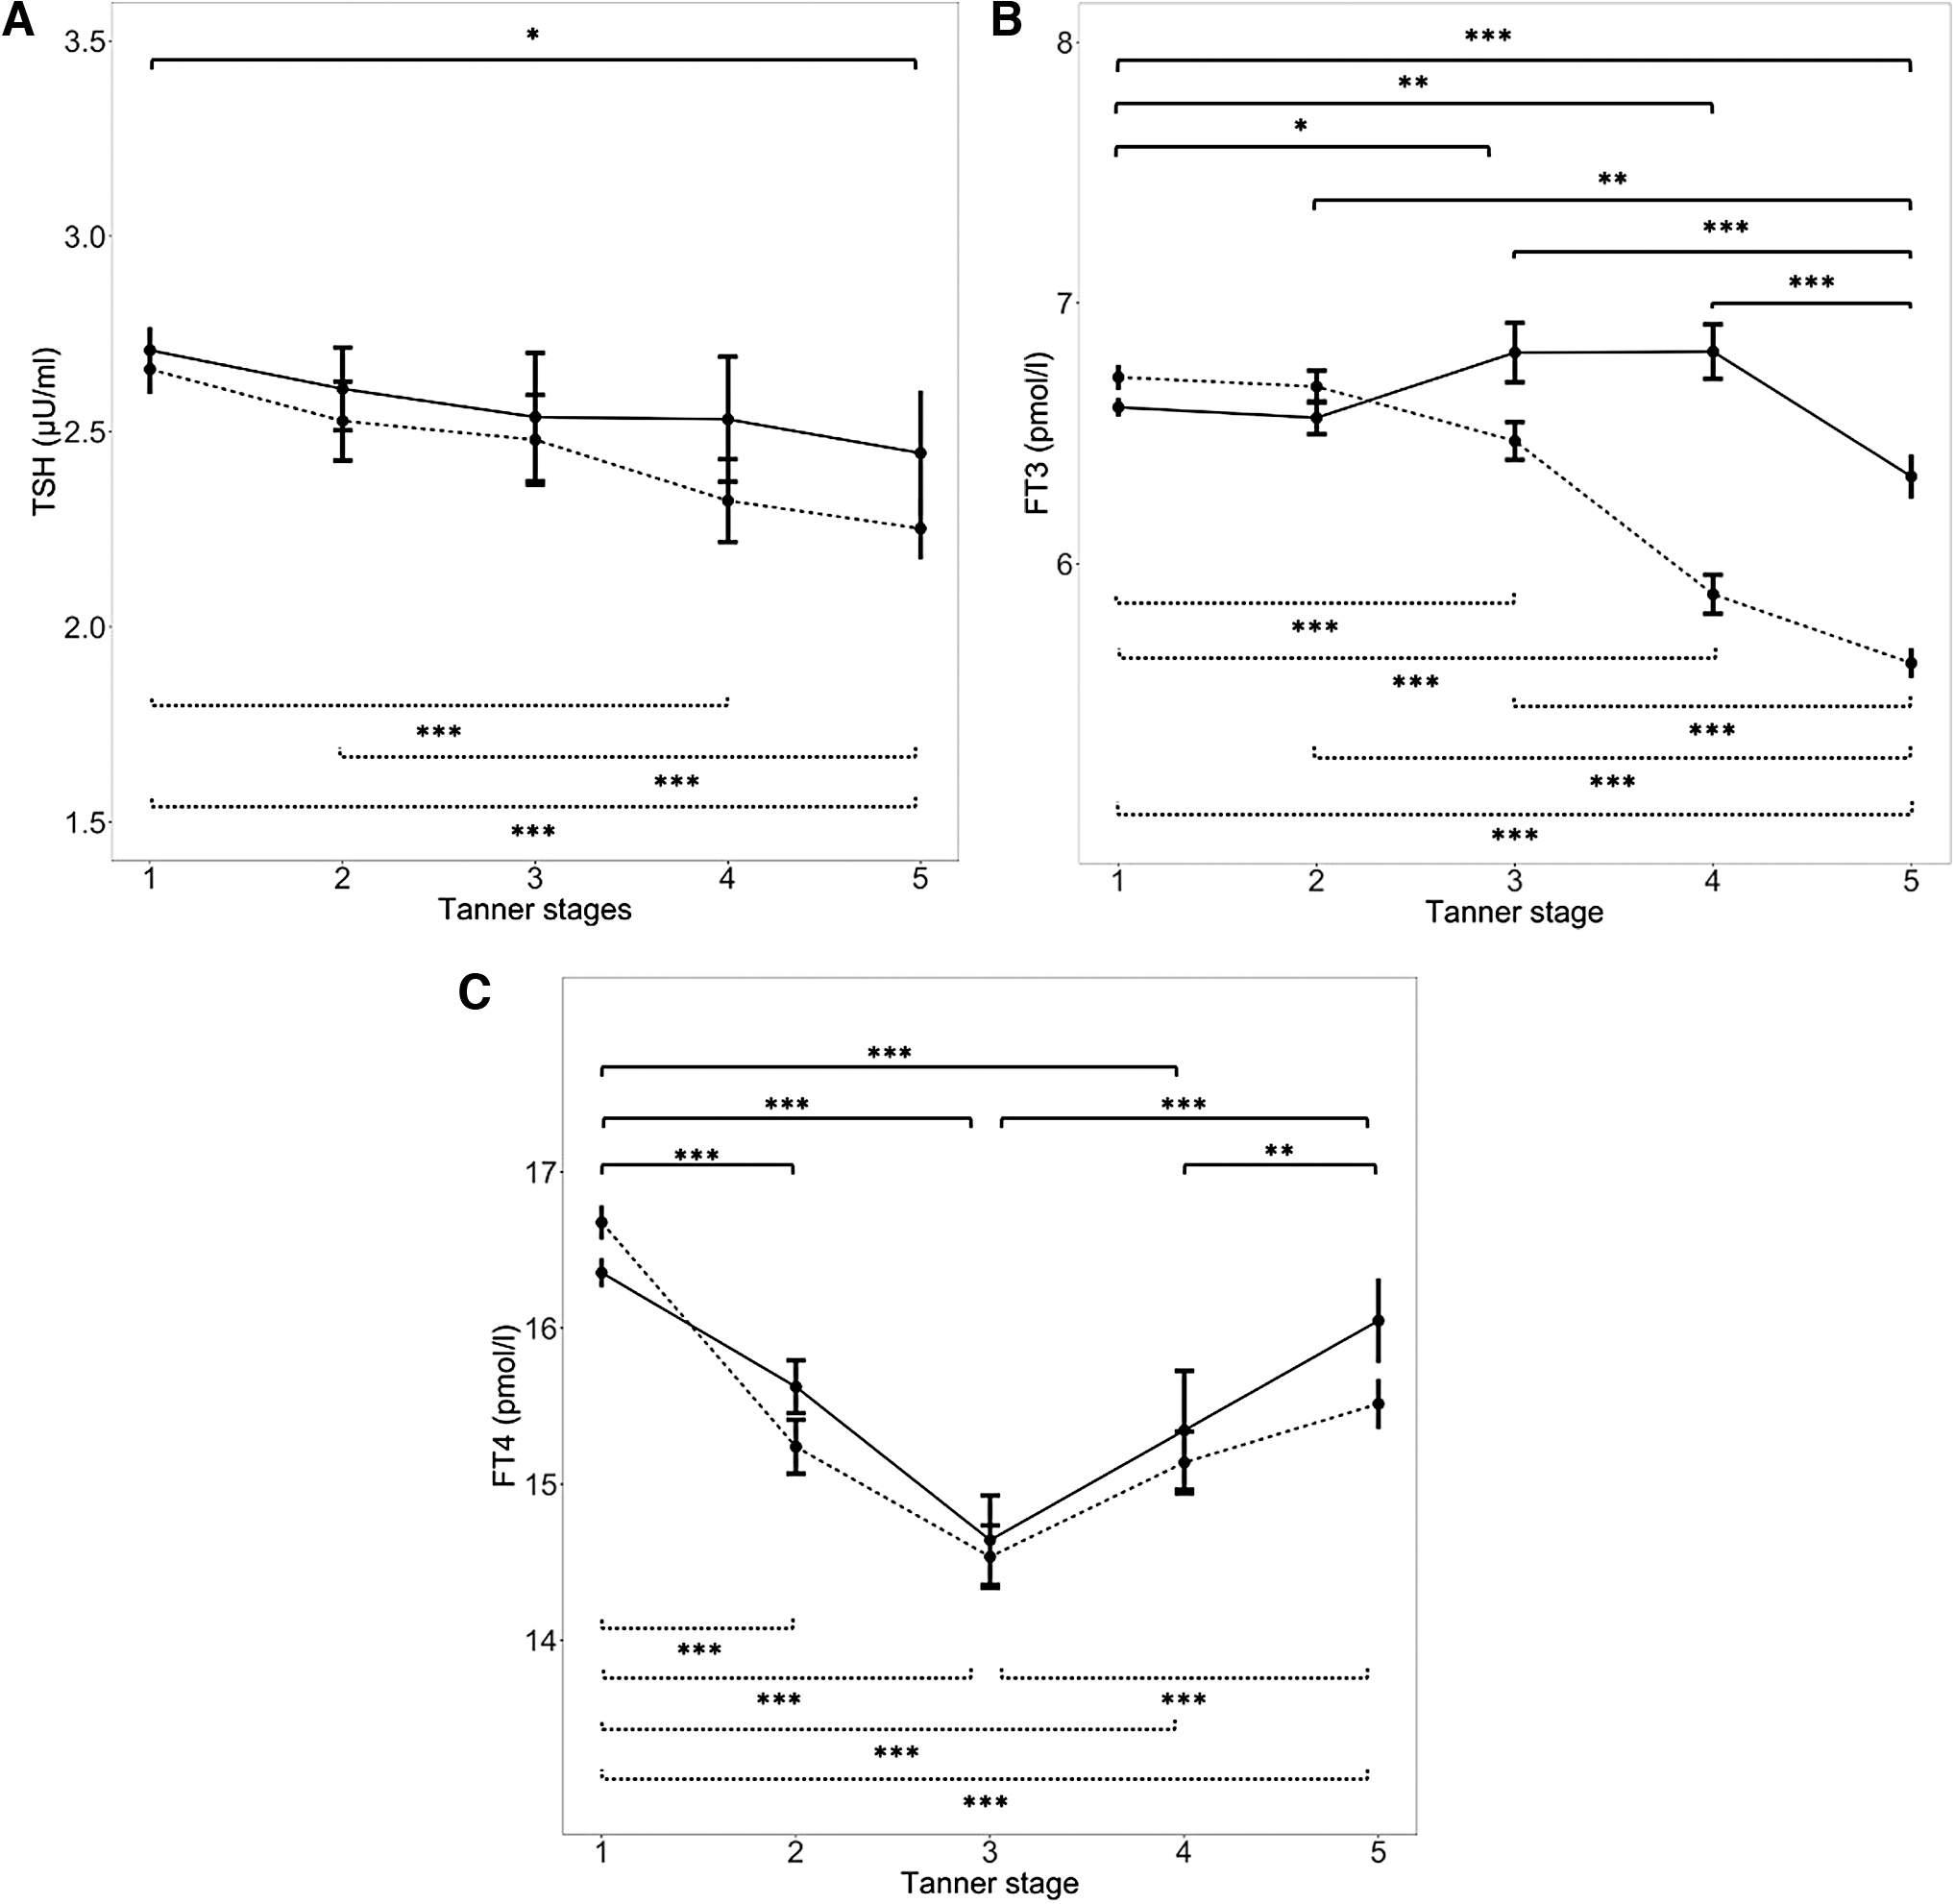
Mean values for TSH, fT3, and fT4 according to puberty and sex. Mean values and the 95% confidence interval of TSH (
Free triiodothyronine
The mean values for males increased significantly until TS 3 (p < 0.05), followed by a significant decrease into postpuberty (p < 0.001) (Fig. 3B). In females, fT3 values decreased across all pubertal stages (p < 0.001), but no significant differences were observed between TS 1 versus 2 and between TS 4 versus 5.
Free thyroxine
The values showed a strong significant decrease until TS 3 in both sexes (p < 0.001), followed by a similar rise by TS 4 on into postpuberty (p < 0.001).
Influence of BMI on TSH and thyroid hormone levels
Analyses have not been adjusted for sex as we did not identify sex as a confounder.
Thyrotropin
There was a positive significant association between BMI-SDS and TSH-SDS (β = 0.081, p < 0.001; Fig. 4A) over the whole study cohort. In addition, we identified significant varying effect sizes for the different weight groups, that is, obese, overweight, normal weight, or underweight (p < 0.05). Overweight children showed a significant positive association (β = 0.215, p < 0.001) that was more than twice as strong as the association in normal weight children (β = 0.063, p < 0.001). Obese children also showed a significant positive relationship (β = 0.193, p < 0.05). In contrast, in underweight study participants, the association was negative but did not reach statistical significance (β = −0.047, p > 0.05).
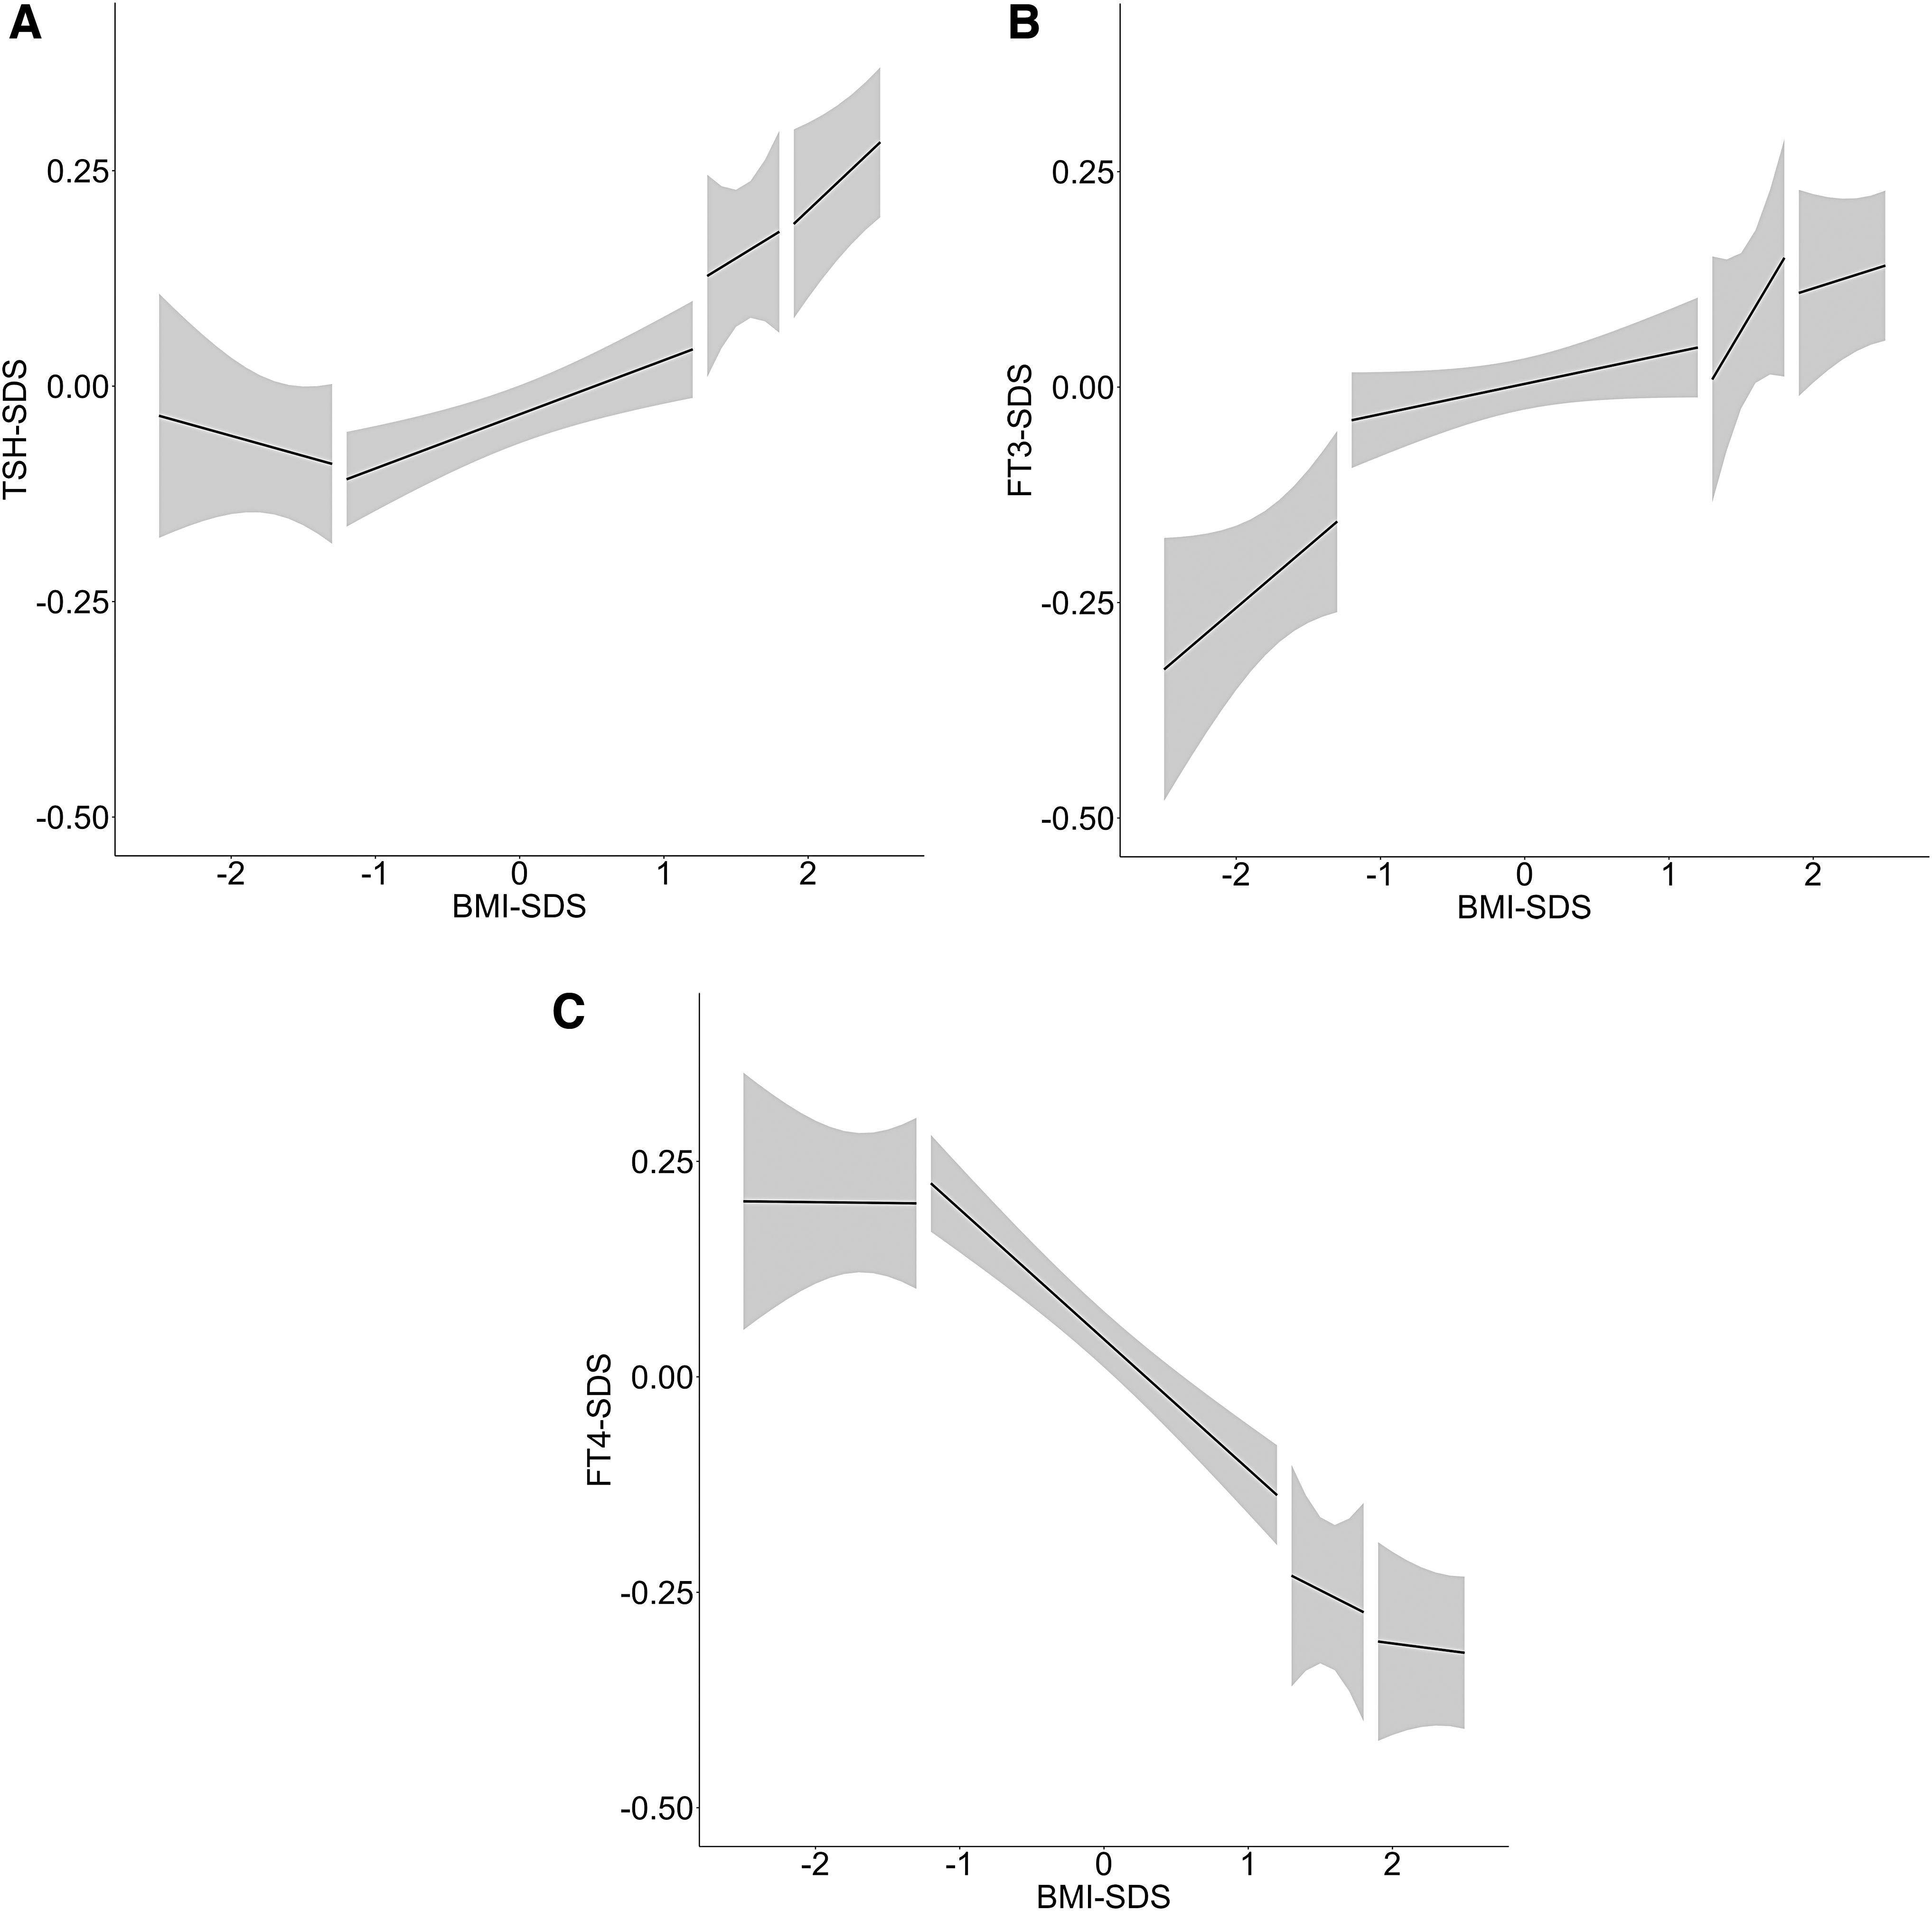
SDS values for TSH, fT3, and fT4 versus BMI-SDS. Age-adjusted SDS values for TSH (
Free triiodothyronine
The association between BMI-SDS and fT3-SDS was significantly positive in the whole cohort (β = 0.066, p < 0.001; Fig. 4B). No significant variation in effect sizes was found between weight groups.
Free thyroxine
BMI-SDS and fT4-SDS demonstrated a significant negative correlation in the study cohort as a whole (β = −0.135, p < 0.001; Fig. 4C). The effect was not significantly stronger in normal weight children (β = −0.151, p < 0.001) compared with overweight children (β = −0.092, p > 0.05) and obese children (β = −0.063, p > 0.05).
Discussion
We established age- and sex-dependent reference ranges for TSH and thyroid hormones in a large sample of healthy children and adolescents aged 0.25–18 years. Our findings suggest that thyroid hormone levels were not only significantly associated with age and sex but also with TS and BMI.
The majority of the published TSH and thyroid hormone reference range research has studied limited age ranges in early or later childhood (11,29 –31) or has presented references for predefined age intervals (32 –36). Additionally, previous studies have often included only a limited number of subjects (less than 50) in each sex and age group (34,37), which is below the recommended number of 120 (38). Studies encompassing the entire pediatric age range, as ours does, are rare and are based on smaller samples (33,36,39).
Two previous studies have included a comparably high number of study participants but have methodical differences. The German Health Interview and Examination Survey for Children and Adolescents (KiGGS) study was a multicenter epidemiological study but had a restricted age range (3–18 years) (30). The study by Ehrenkranz et al. used data from the Intermountain Healthcare Enterprise Data Warehouse. This study only included serum samples with TSH between 0.4 and 10 μIU/mL and presented one reference interval for all participants from 1 to 20 years in age (40).
One notable result from our sample was the strong variability of TSH values during the first three years of life, which was more pronounced in males than in females. As reported in earlier studies, directly after birth, TSH values increase up to a peak of 60–80 μIU/mL, followed by a decrease within the first 3–5 days of age (41,42). Incomplete maturation of the hypothalamic–pituitary–thyroid axis (HPT axis) postpartum has been proposed as an explanation of this initial peak in TSH values, with earlier neuronal maturation in females (43) explaining the less distinct decrease of TSH values compared with males and the significant sex differences in mean values between 0.5 and 1 year in age.
Our data indicate that the variance in values over the first year of life is prominent for TSH but less evident for fT3 and fT4, a finding that has also been described in previous studies (39). Kratzsch et al. reported that fT4 values were widely scattered over the first 3 months postpartum, but that they converged earlier than TSH and fT3 values, at 3 months, and remained fairly constant afterward (39).
Chaler et al. agreed in reporting steady values for TSH and fT4 in the 50th percentiles, but differed in stating lower values for TSH and higher values for fT4 in the 97.5th percentiles (36). Such discrepancies may be due to the different genetic backgrounds of their South American cohort, the absence of sex specification, or the exclusion of outliers (36). Our results are in line with the KiGGS study in showing a gradual decrease of TSH over the whole age range. They also indicate similar tendencies for fT3 and fT4 as the KiGGS data, especially over puberty. The results reported by a recent longitudinal study including children between 14 and 16 years were consistent with ours in terms of rising fT4 values and higher fT3 values in males (44).
The question of whether or not TSH, fT3, and fT4 values are age-dependent during childhood and adolescence has been a matter of debate. The overwhelming majority of existing studies support our findings (36,37,39) of age-dependency, but contradictory results have also been reported. The discrepancy in these cases may be due to lower numbers of investigated subjects and/or restricted age ranges (29). As such, the diagnostically relevant 2.5th and 97.5th percentiles of TSH and fT3 appear to be more age-influenced than the same percentiles for fT4.
Sex-specific differences of TSH were noticeable at the beginning and the end of the pediatric age range. The distinct higher values of the 97.5 percentile in the first 4 years of life among males, and the significant higher mean values among males between 0.5 and 1 year of age may be explained by a sex-specific neurological maturation, as mentioned above and suggested in earlier research (43). After a convergence of the mean and the 97.5 percentile values in both sexes from the age of 4 years onward, slightly but statistically significantly higher mean values were found in males in the 13–15 year age range.
Although individual TS are associated with a sex-specific increase in estradiol or testosterone levels, our TSH values revealed a significant but minor puberty-based reduction of this hormone. As suggested before, the increase of estrogen in females could exert a suppressive action on TSH directly or indirectly, either on the hypothalamic or on the pituitary level, to lower the set point of the HPT axis (45). A comparable influence of testosterone on the HPT axis has not been proved so far. Thus, we hypothesize that the effect of increased gonadal steroids on the HPT axis during puberty is only restricted and/or consistent with the overall age-dependent decrease of TSH percentiles (Supplementary Table S1), which would run contrary to the “thyroidarche” model of a HPT axis maturation during puberty (46).
The increase as well as the steadiness of fT3 values in males and females, respectively, up to TS 3 followed by a downswing, are in apparent contrast to the pattern of fT4 values in both sexes (Fig. 3B, C). This could point to puberty-dependent changes in deiodinase activity as an adaption to the higher metabolic demands. Sex steroids may have a positive influence on the fT4 conversion, as has been described in research with transexual people, where the administration of testosterone but not estrogen was shown to increase the ratio of T3 to T4 (47). In adults, the effect of growth hormone (GH) in increasing serum fT3 and decreasing serum fT4 is associated with increased deiodinase type 2 expression in vitro (48). Assuming this effect also occurs in vivo, pubertal elevated GH may induce deiodinase type 2 activity, which would support our results (49). Sex-specific differences in fT3 mean and 97.5th percentile values became apparent between 10 and 18 years, where a shift was detected from higher values in females (9–12 years) to higher values in males (12–18 years) (Supplementary Table S2A, B). We speculate that this is due to the younger mean age of females in TS 2 and 3 (Table 2).
When it comes to the potential sex association of thyroid hormones during childhood, the existing research findings are contradictory. Numerous studies have reported no, or limited, sex difference and have thus proposed sex nonspecific reference intervals (36,37,39). Other studies, with lower numbers of samples, only observed sex influenced only certain hormones, such as fT3 (34). The KiGGS study also reported sex differences for all thyroid hormones especially during puberty (30). Studies focusing on puberty-based changes in thyroid hormones are rare. Marwaha et al., who combined TS 2, 3, and 4 in a single “pubertal” phase, also reported an absence of puberty-based effects in TSH, a rise in fT3, and a corresponding fall of fT4. However, our results reveal puberty-based differences on the basis that we differentiated between TS and included a greater number of participants (49).
Our results indicate that the TSH values of children and adolescents were significantly dependent on BMI. We suspect that even within the group of overweight children, TSH levels rose with increasing weight. We also observed the opposite trend in underweight children. Our results demonstrate a nonlinear relationship between TSH-SDS and BMI-SDS.
A similar, but less pronounced, effect was found for fT4, with an insignificant weaker relationship in children with high BMI compared with the rest of the cohort. The relationship between fT3 and BMI-SDS did not vary depending on the children's weight. This may be explained by a weight-adapted conversion of fT4 to fT3.
That the interactions between the weight groups were not found to be significant is probably due to the low number of underweight and overweight subjects. The dynamic relationships revealed in our analysis between TSH-SDS and BMI-SDS, and between fT4-SDS and BMI-SDS, appear to be a new finding. A significant effect on levels of TSH and fT4, in particular, could lead to diagnostic errors, in which case these relationships would be of clinical consequence (Table 1). Accordingly, children's weight should therefore be taken into account when interpreting TSH and fT4 serum levels.
Previous studies looking at these relationships present contradictory results, with some researchers finding no correlation between BMI and TSH (38), and others finding no correlation between fT4 and BMI-SDS (50,51). This is likely to be due to lower numbers of serum samples and/or the use of non-age-adjusted BMI-SDS values. The results of Marwaha et al. support our findings insofar as they indicate consistent relationships between TSH, fT3, and fT4 and weight (52).
A longitudinal study using genetic analysis described interactions between fT3, fT4, and BMI that are consistent with our findings and also suggested that a greater degree of adiposity can lead to elevated fT3 levels but does not influence fT4 levels (53).
Previous studies that found no BMI effect investigated a restricted age range (29,31) and/or included fewer young people (29,39,50). To the best of our knowledge, we present the first study using reference values derived from a broad reference cohort to measure the effect of BMI on thyroid hormone levels using SDS values.
Regulative interactions between BMI and thyroid function appear to be mediated by the adipokine leptin. Leptin may stimulate TSH release via TSH-releasing hormone gene expression (50,54). Increased TSH release stimulates deiodinase (Type 1) (55), leading to a higher conversion of fT4 to fT3. This hypothesis would explain the positive correlation of TSH and fT3 with BMI-SDS and the inverse relationship of fT4 and BMI-SDS in the present study. The dynamic relationship between BMI-SDS with TSH-SDS and to some extent between fT4-SDS and BMI-SDS could be explained by an alteration to the effect of leptin on TSH and fT4 in different BMI groups.
The limitations of this study include: the clustered data for the first year of life when the study subjects had measurements at around 3, 6, and 12 months in age; a low number of implausible data points, which could not be explained despite a detailed reexamination of the subjects' medical history; and the absence of a complete medication history.
In conclusion, our findings suggest that age, sex, puberty, and BMI are influencing and diagnostically relevant factors for the thyroid parameters TSH, fT3, and fT4 during infancy, early childhood, and adolescence.
Footnotes
Acknowledgments
We gratefully recognize the essential contribution of all participating families and the LIFE Child team. The excellent work by laboratory assistants of the ILM Leipzig was much appreciated.
Author Disclosure Statement
The authors have nothing to disclose.
Funding Information
This study was carried out in close collaboration with LIFE, with funding from the European Regional Development Fund of the European Union and the excellence initiative of the Saxony Ministry of Science and Art, Saxony, Germany. The authors are grateful to Roche for an unrestricted research grant to finance the measurements of fT3, fT4, and TSH within this project.
Supplementary Material
Supplementary Table S1
Supplementary Table S2
Supplementary Table S3
Supplementary Table S4