
Abstract
Background:
Combination therapy with lenvatinib plus programmed death-1 (PD-1) immune checkpoint blockades (ICBs) is under investigation in many solid tumors, including thyroid cancer. Lenvatinib is known to reduce angiogenesis and may overturn the immunosuppressive effects of vascular endothelial growth factor in the tumor microenvironment. Previous studies investigating the effects of VEGF receptor inhibition on the immune response were performed in rapidly growing tumor models where immune equilibrium is not established before treatment. We hypothesize that physiologically relevant preclinical models are necessary to define mechanisms of resistance to immune-targeted combination therapies.
Methods:
We utilized the TPO-CreER/BrafV600E /wt/Trp53Δex2–10/Δex2–10 inducible transgenic model of advanced thyroid cancer to investigate lenvatinib treatment in the context of an anti-PD-1 ICB. Following tumor establishment, 3.5 months postinduction, mice were treated with high- (10 mg/kg) or low-dose (2 mg/kg) lenvatinib, anti-PD-1, or combination of lenvatinib with anti-PD-1. Tumor volume and lung metastases were assessed in each group. Immune infiltrate was characterized by flow cytometry and immunohistochemistry, and TCRß sequencing was performed to further investigate the T cell response.
Results:
Both low- and high-dose lenvatinib reduced tumor volume, while anti-PD-1 had no effect, alone or in combination. Although both low- and high-dose lenvatinib reduced vascular density, low-dose lenvatinib was superior in controlling tumor size. Lung metastases and survival were not improved with therapy despite the effects of lenvatinib on primary tumor size. Low-dose lenvatinib treatment led to a subtle reduction in the dominant Ly6G+CD11b+ myeloid cell population and was associated with increased CD4+ T cell infiltrate and enrichment in 4–1BB+ and granzyme B+ CD4+ T cells and FoxP3+ regulatory T cells. Polyclonal T cell expansion was evident in the majority of mice, suggesting that a tumor-specific T cell response was generated.
Conclusions:
The effects of lenvatinib on the immune response were most pronounced in mice treated with low-dose lenvatinib, suggesting that dose should be considered in clinical application. While the immune-modulating potential of lenvatinib is encouraging, alterations in the immune milieu and T cell activation status were insufficient to sustain durable tumor regression, even with added anti-PD-1. Additional studies are necessary to develop more effective combination approaches in low-mutation burden tumors, such as thyroid cancer.
Introduction
Vascular endothelial growth factor (VEGF) is well characterized for its immunosuppressive effects in the tumor microenvironment, including recruitment of immature dendritic cells, tumor-associated macrophages, and myeloid-derived suppressor cells and inhibition of T cell trafficking, proliferation, and effector function (1 –3). Much research has focused on targeting VEGF and/or VEGF receptors (VEGFRs) to reverse immune suppression. This rationale has led to the development of multiple clinical trials targeting VEGF/VEGFRs in concert with immune checkpoint blockades (ICBs) (1). Bevacizumab (anti-VEGF) plus atezolizumab (anti-PD-L1) has been approved by the Food and Drug Administration (FDA) for hepatocellular carcinoma and renal cell carcinoma with only a modest survival advantage over sorafenib (6.8 vs. 4.3 months) or sunitinib (11.2 vs. 7.7 months), respectively (4,5).
Lenvatinib, a multikinase inhibitor that targets VEGFR1/2/3, in addition to FGFR, PDGFRB, KIT, and RET (6 –8), plus pembrolizumab (anti-PD-1), has moved into phase III trials in multiple solid tumors. This combination generated a response in 40% of patients with endometrial cancer, including three complete responses (9). These results were an improvement over single-agent therapy with lenvatinib (14% overall response rate [ORR]) or pembrolizumab (13% ORR in microsatellite stable disease), leading to FDA approval. However, median progression-free survival was only modestly improved (5.4 vs. 7.4 months). Response rates in hepatocellular carcinoma were improved from 18.8% with lenvatinib to 36% with lenvatinib plus pembrolizumab and median overall survival was increased from 13.6 to 22 months, respectively (4,10).
Lenvatinib plus anti-programmed death-1 (PD-1) is currently under investigation in differentiated thyroid cancer (DTC; NCT02973997) and anaplastic thyroid cancer (ATC; NCT04171622), where ICB therapy has generated relatively low response rates (9–24%) (11,12). In a small cohort of ATC and poorly DTC (PDTC) patients, lenvatinib plus pembrolizumab achieved complete responses in 4/6 patients with ATC and partial responses in 2/2 patients with PDTC (13).
While much excitement has been generated for combination lenvatinib plus pembrolizumab therapy, additional studies are necessary to optimize this combination approach. Preclinical models are necessary to define the mechanism(s) of response to combination therapy and develop strategies to overcome resistance. Syngeneic orthotopic and flank models have been used to define the effects of VEGF-targeted therapies on the immune response alone and in the context of ICBs (3,14 –16). While some mechanistic data can be gleaned from these studies, the therapeutic effects on the immune system are unrealistic in these models as they occur during a heightened primary response phase to a rapidly growing tumor.
In the present study, we characterized the immune response and treatment effects in the TPO-CreER/BrafV600E /wt/Trp53Δex2–10/Δex2–10 (TBP) transgenic mouse, where thyroid tumors are established over 3.5 months before treatment (17). These tumors initiate as DTC, progress to ATC, and metastasize to the lung. Median survival in this model is 6 months after induction, allowing sufficient time to determine the treatment effects in an established tumor microenvironment (17).
Materials and Methods
Mouse model
All animals were housed in a pathogen-free animal facility and experiments were conducted in accordance with Institutional Animal Care and Use Committee (IACUC) approval. Tumor induction in TBP animals at 6–8 weeks was performed by tamoxifen administration (0.1 mg/g in corn oil, intraperitoneal [i.p.] daily for 2 days). Thyroid hormone (levothyroxine; 5 mg/L in 0.75% ethanol) was given in drinking water following tumor induction to suppress thyrotropin (see Supplementary Data S1 for additional details).
Results
Lenvatinib reduces tumor size, but does not improve survival
To investigate the efficacy of lenvatinib alone and in combination with anti-PD-1 blockade, TBP mice were treated with vehicle and IgG (control), anti-PD-1, lenvatinib, or a combination of lenvatinib plus anti-PD-1 (Fig. 1A). Lenvatinib was tested at both high (10 mg/kg) and low (2 mg/kg) concentrations. Average tumor size in control mice ranged from 50 to 1000 mm3. A statistically significant reduction in average tumor volume was achieved with lenvatinib alone, and low-dose lenvatinib was superior to high-dose treatment. Anti-PD-1 single-agent therapy had no effect on tumor size and did not enhance the antitumor effect of lenvatinib at either dose (Fig. 1B, C).

Therapeutic efficacy of lenvatinib at low or high dose and in combination with anti-PD-1 in the TBP preclinical model.
Despite initial control of tumor outgrowth, low-dose lenvatinib, alone or in combination with anti-PD-1, had no effect on survival (Fig. 1D). Furthermore, the incidence of lung metastases was not reduced with treatment. Metastases displayed DTC histology, suggesting that these metastatic events occurred early in tumor progression (Fig. 1E). As expected, vascular density was reduced effectively with high-dose lenvatinib and to a lesser degree with low-dose lenvatinib (Fig. 2A).
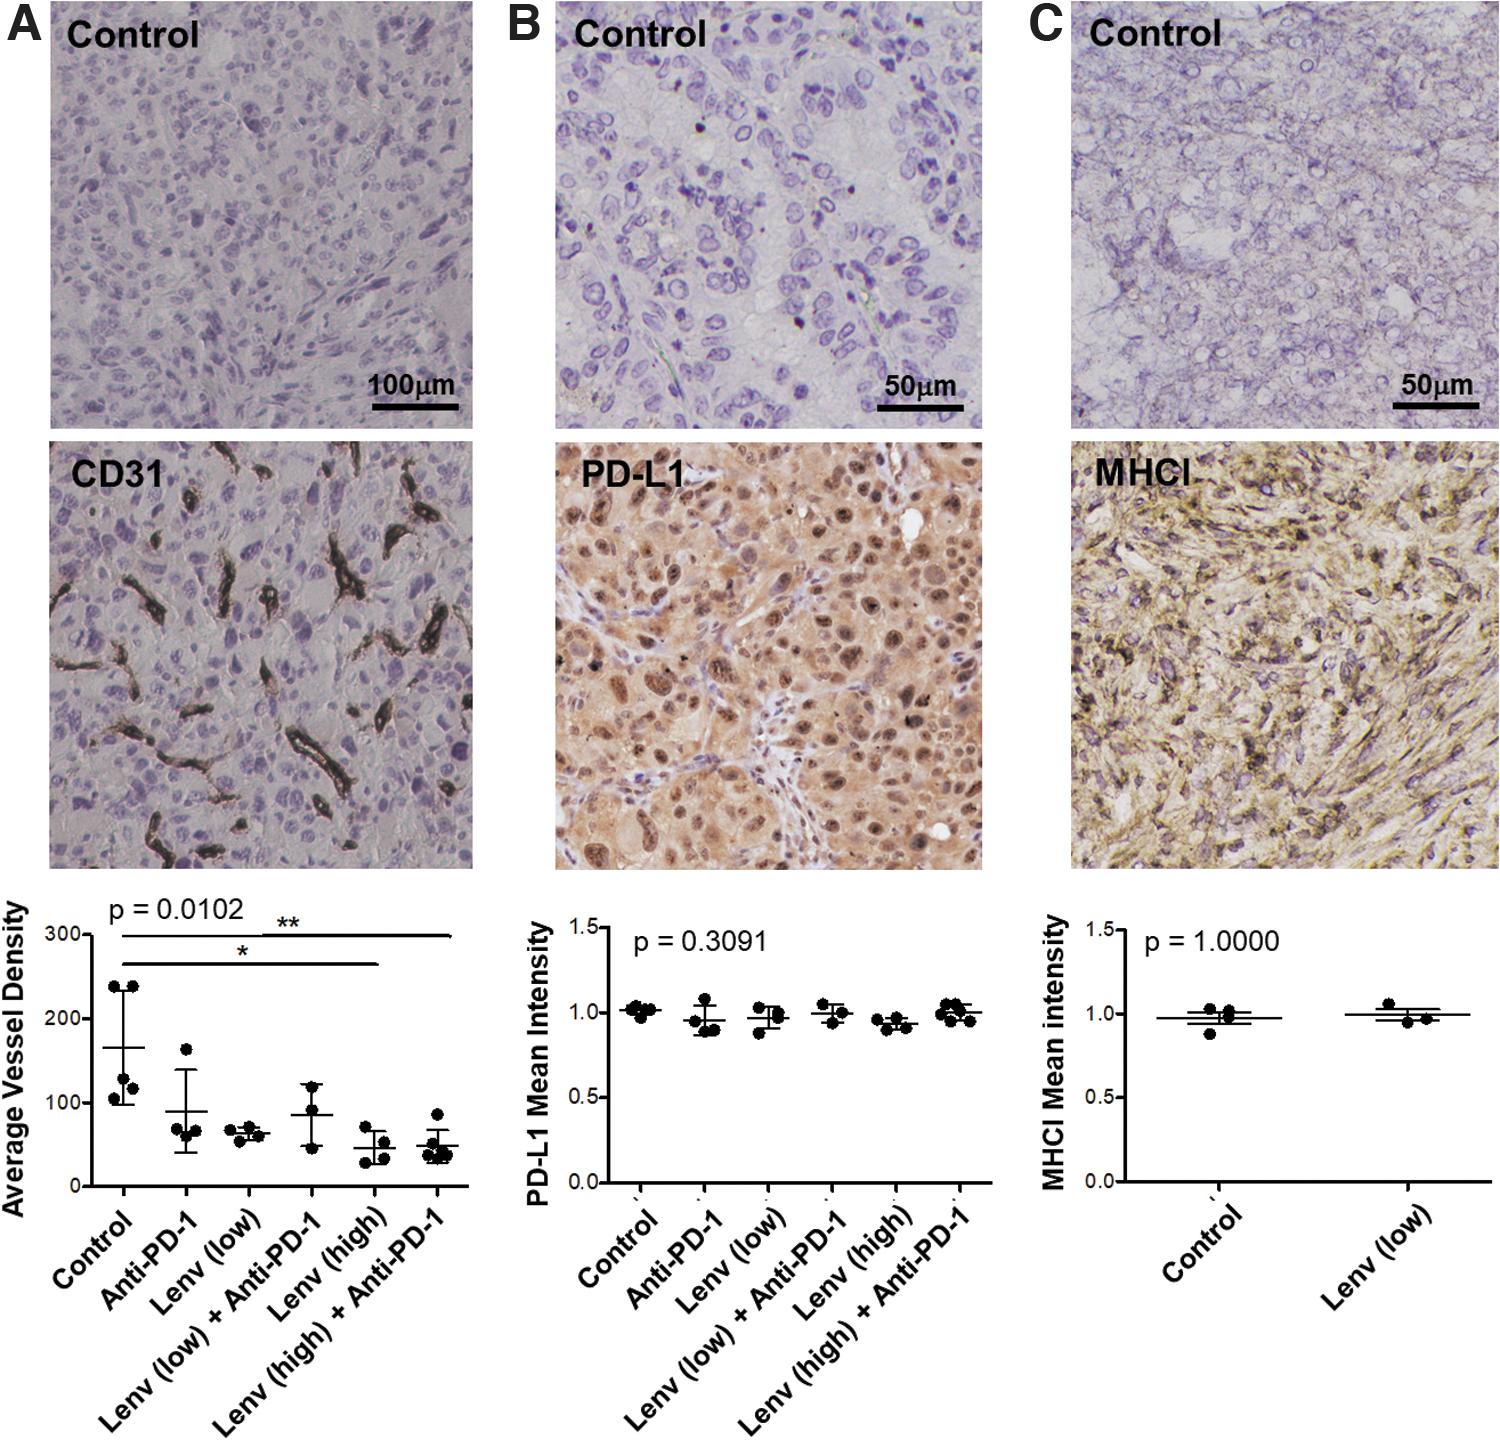
CD31, MHCI, and PD-L1 expression by IHC. Tumor tissues were stained for CD31 as a marker of endothelial cells and scored for vascular density
MHCI and PD-L1 expression in TBP tumors
To determine the potential for the PD-1/PD-L1 axis in the TBP model, we assessed expression of PD-L1, the primary ligand for PD-1, in TBP tumors using immunohistochemistry (Fig. 2B). PD-L1 was expressed at similar levels by all tumors and expression was not affected by treatment. To investigate the potential immunogenicity of TBP tumors, we assessed expression of MHC class I molecules (MHCI). MHCI staining was evident in TBP tumors and expression was not altered with lenvatinib treatment (Fig. 2C).
Effects of lenvatinib, anti-PD-1, and combination therapy on immune infiltration
We next investigated the immunomodulatory activity of anti-PD-1, lenvatinib, and combination treatment on immune infiltrate. As shown in Figure 3A, CD45+ leukocytes were elevated on average in control mice compared with pretreatment tumors; however, the frequency of infiltrate was highly variable. Immune infiltrate was reduced in mice treated with lenvatinib alone or in combination with anti-PD-1, although these changes did not reach statistical significance. In contrast, anti-PD-1 alone had no effect on immune infiltrate. In pretreatment tumors, T cells constituted 21.5 ± 12.6% (mean ± standard deviation [SD]) [5% confidence interval] of CD45+ leukocytes (Fig. 3B), while natural killer (NK) and B cells were rare (<5%). Myeloid cells were dominant in pretreatment mice (35.8 ± 24.0%; range: 13.2–73.6), with high frequencies of CD11b+Ly6G+ cells (48.5 ± 23.9% Fig. 3B). Leukocyte infiltrate in control mice was similarly dominated by Ly6G+ myeloid cells, while Ly6C+ putative monocytes were sparse.
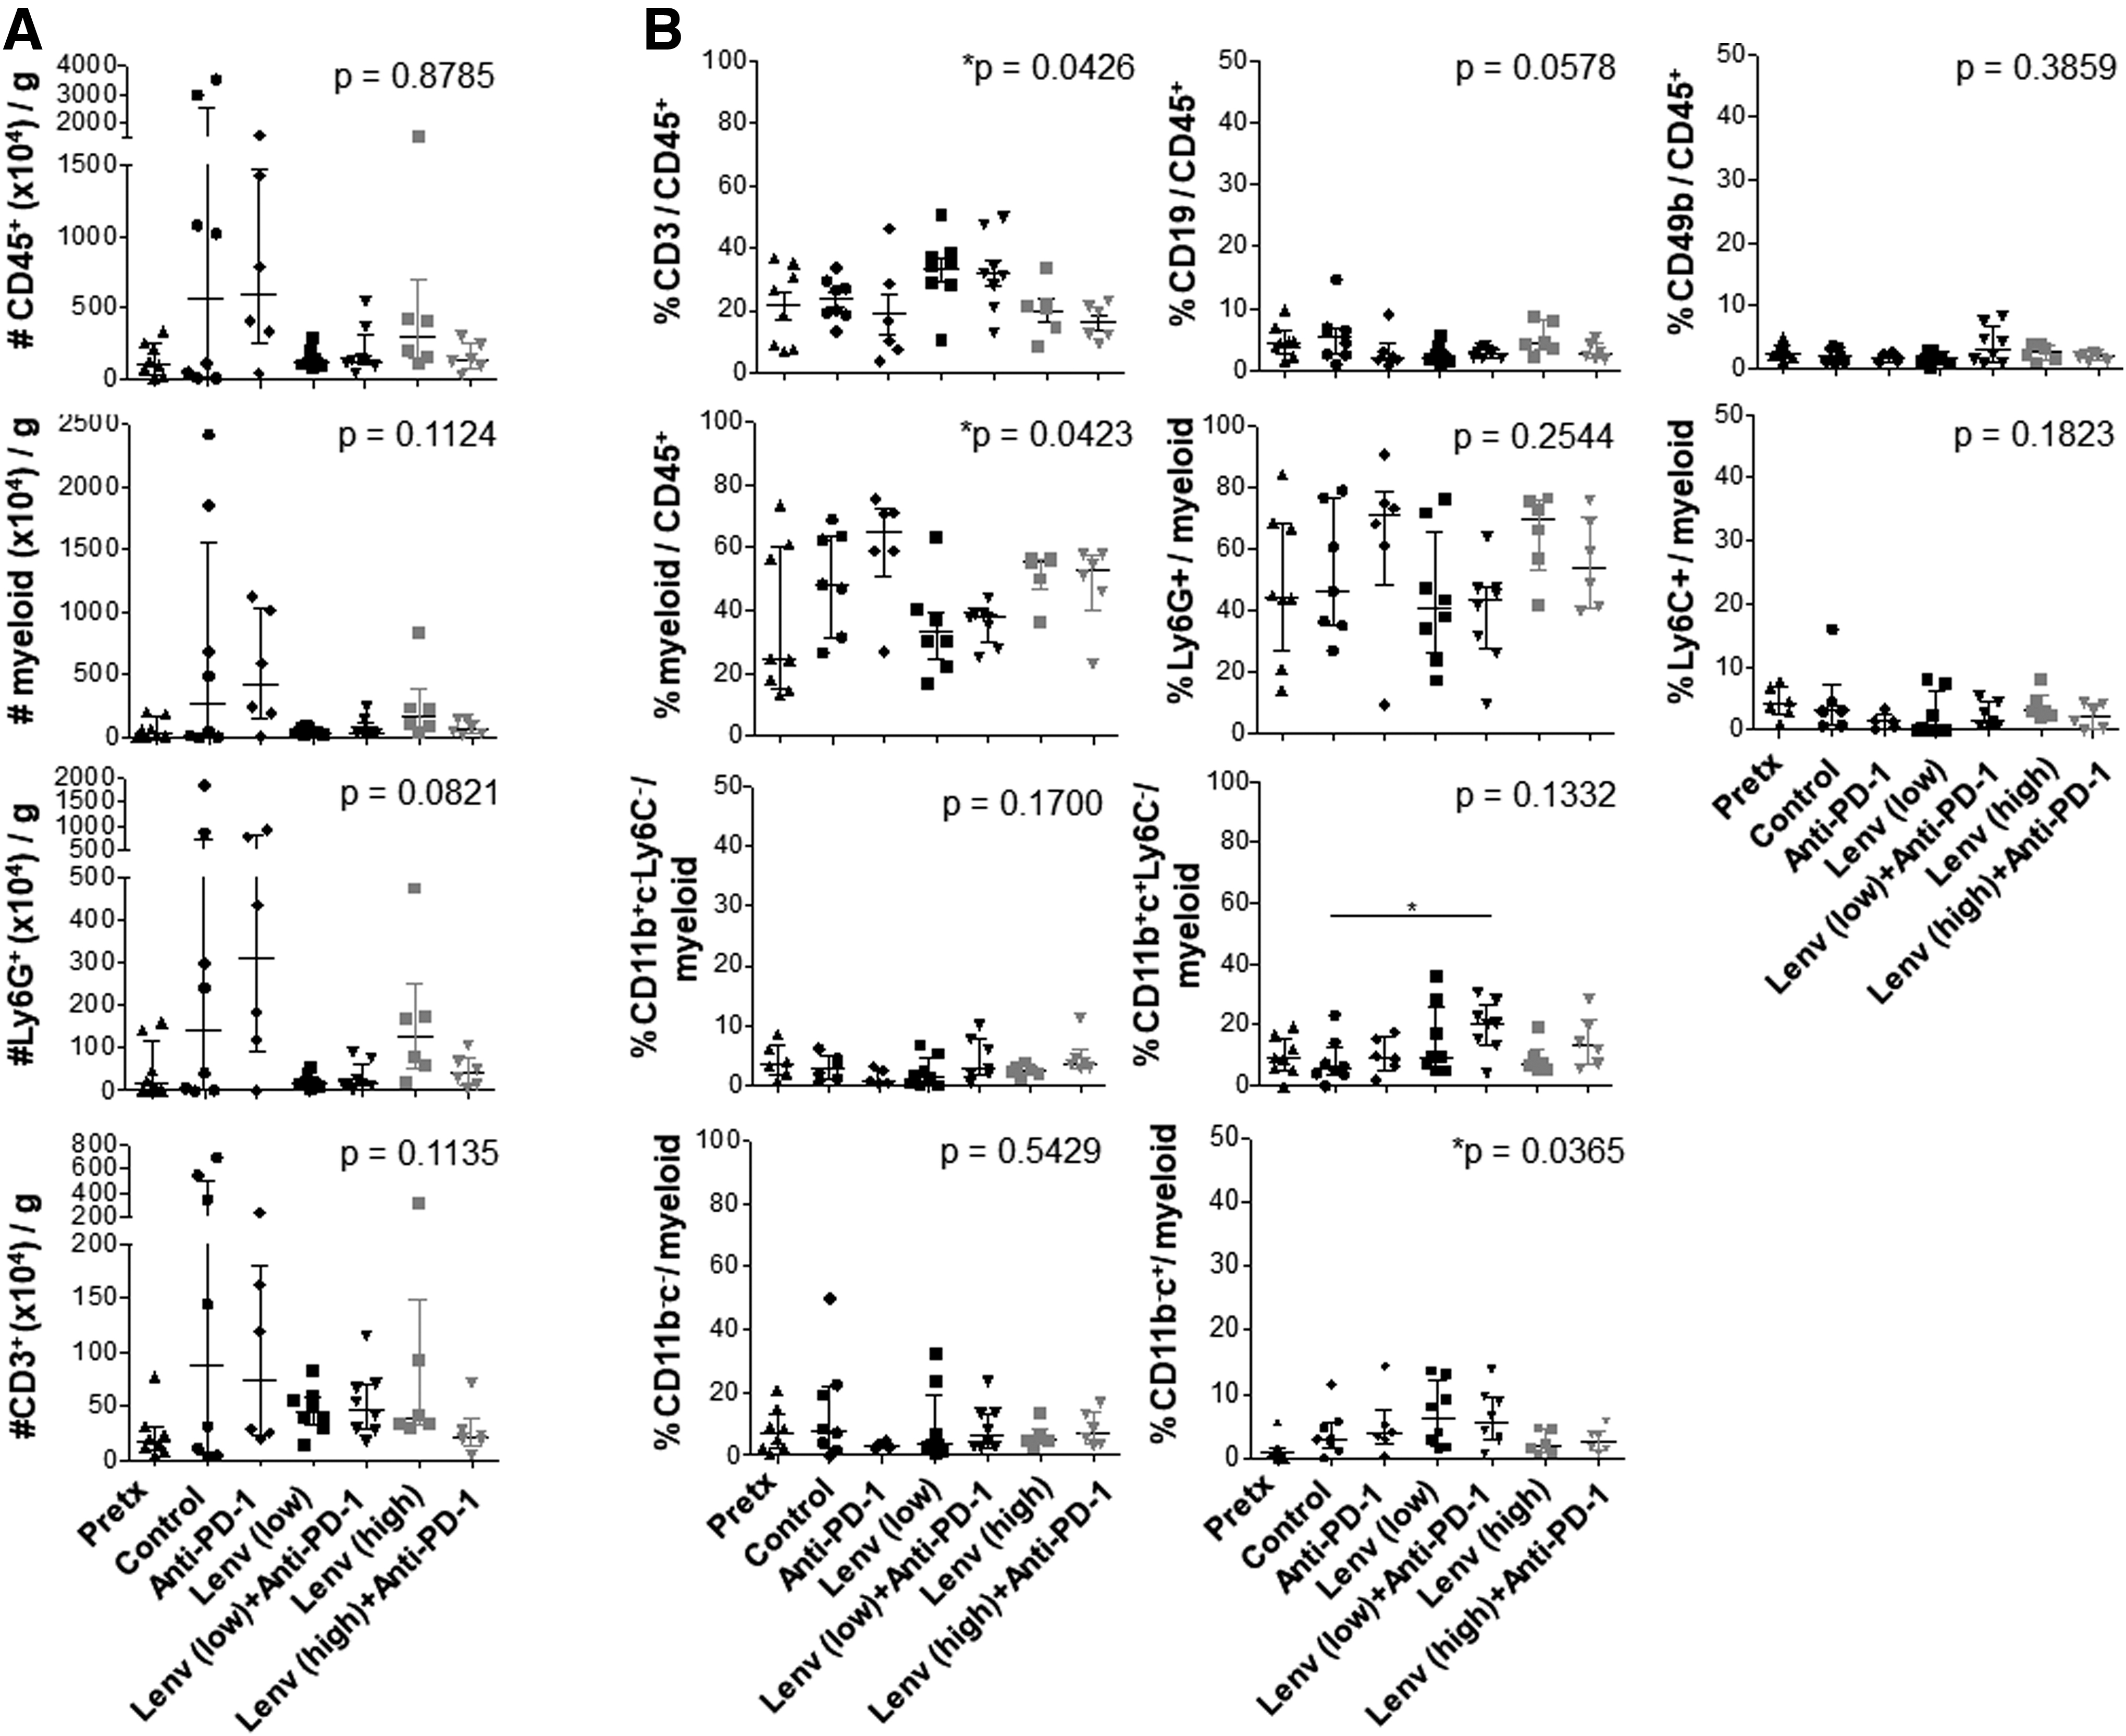
Treatment effects of lenvatinib, anti-PD-1, and combination therapy on leukocyte frequencies in TBP thyroid tumors. Thyroid tumors were harvested pretreatment or after 6 weeks of treatment with vehicle control, anti-PD-1, lenvatinib at 2 mg/kg (low) or 10 mg/kg (high), or combination therapy at both low and high doses of lenvatinib. Cell number per gram of tumor
Myeloid and T cell frequencies were not altered by anti-PD-1 alone, high-dose lenvatinib, or combination therapy. Low-dose lenvatinib treatment resulted in a slight increase in total CD3+ T cells (Fig. 3B). Total myeloid cells (49.7 ± 16.33 vs. 34.6 ± 14.0%) and the Ly6G+ subset (51.6 ± 20.8 vs. 43.96 ± 21.0%) were subtly reduced in frequency following low-dose lenvatinib treatment compared with control mice (Fig. 3B). These changes did not reach statistical significance. CD11b+CD11c+Ly6C− (putative conventional dendritic; cDC) cells were subtly increased following treatment with low-dose lenvatinib plus anti-PD-1.
CD4+ T cells are enriched following low-dose lenvatinib treatment and show signs of activation
To further investigate the T cell response, we characterized both the frequency and phenotype of CD4+ T cells, CD4+FoxP3+CD25+ regulatory T cells (Tregs), and CD8+ T cells (Fig. 4). T cell subsets were stained for markers of differentiation (i.e., CD127, CD27, and T-bet) and activation (i.e., granzyme B, CD25, 4–1BB, PD-1, and Tim-3). CD4+ T cells (FoxP3-) were commonly found at a higher frequency than CD8+ T cells, expressed CD127, and showed marked downregulation of CD27 (Fig. 4A, B). Tregs were present at low frequencies and were similar to non-Treg CD4+ cells in expression of these differentiation markers. CD4+ T cells and Tregs were subtly increased in frequency with low-dose lenvatinib treatment.
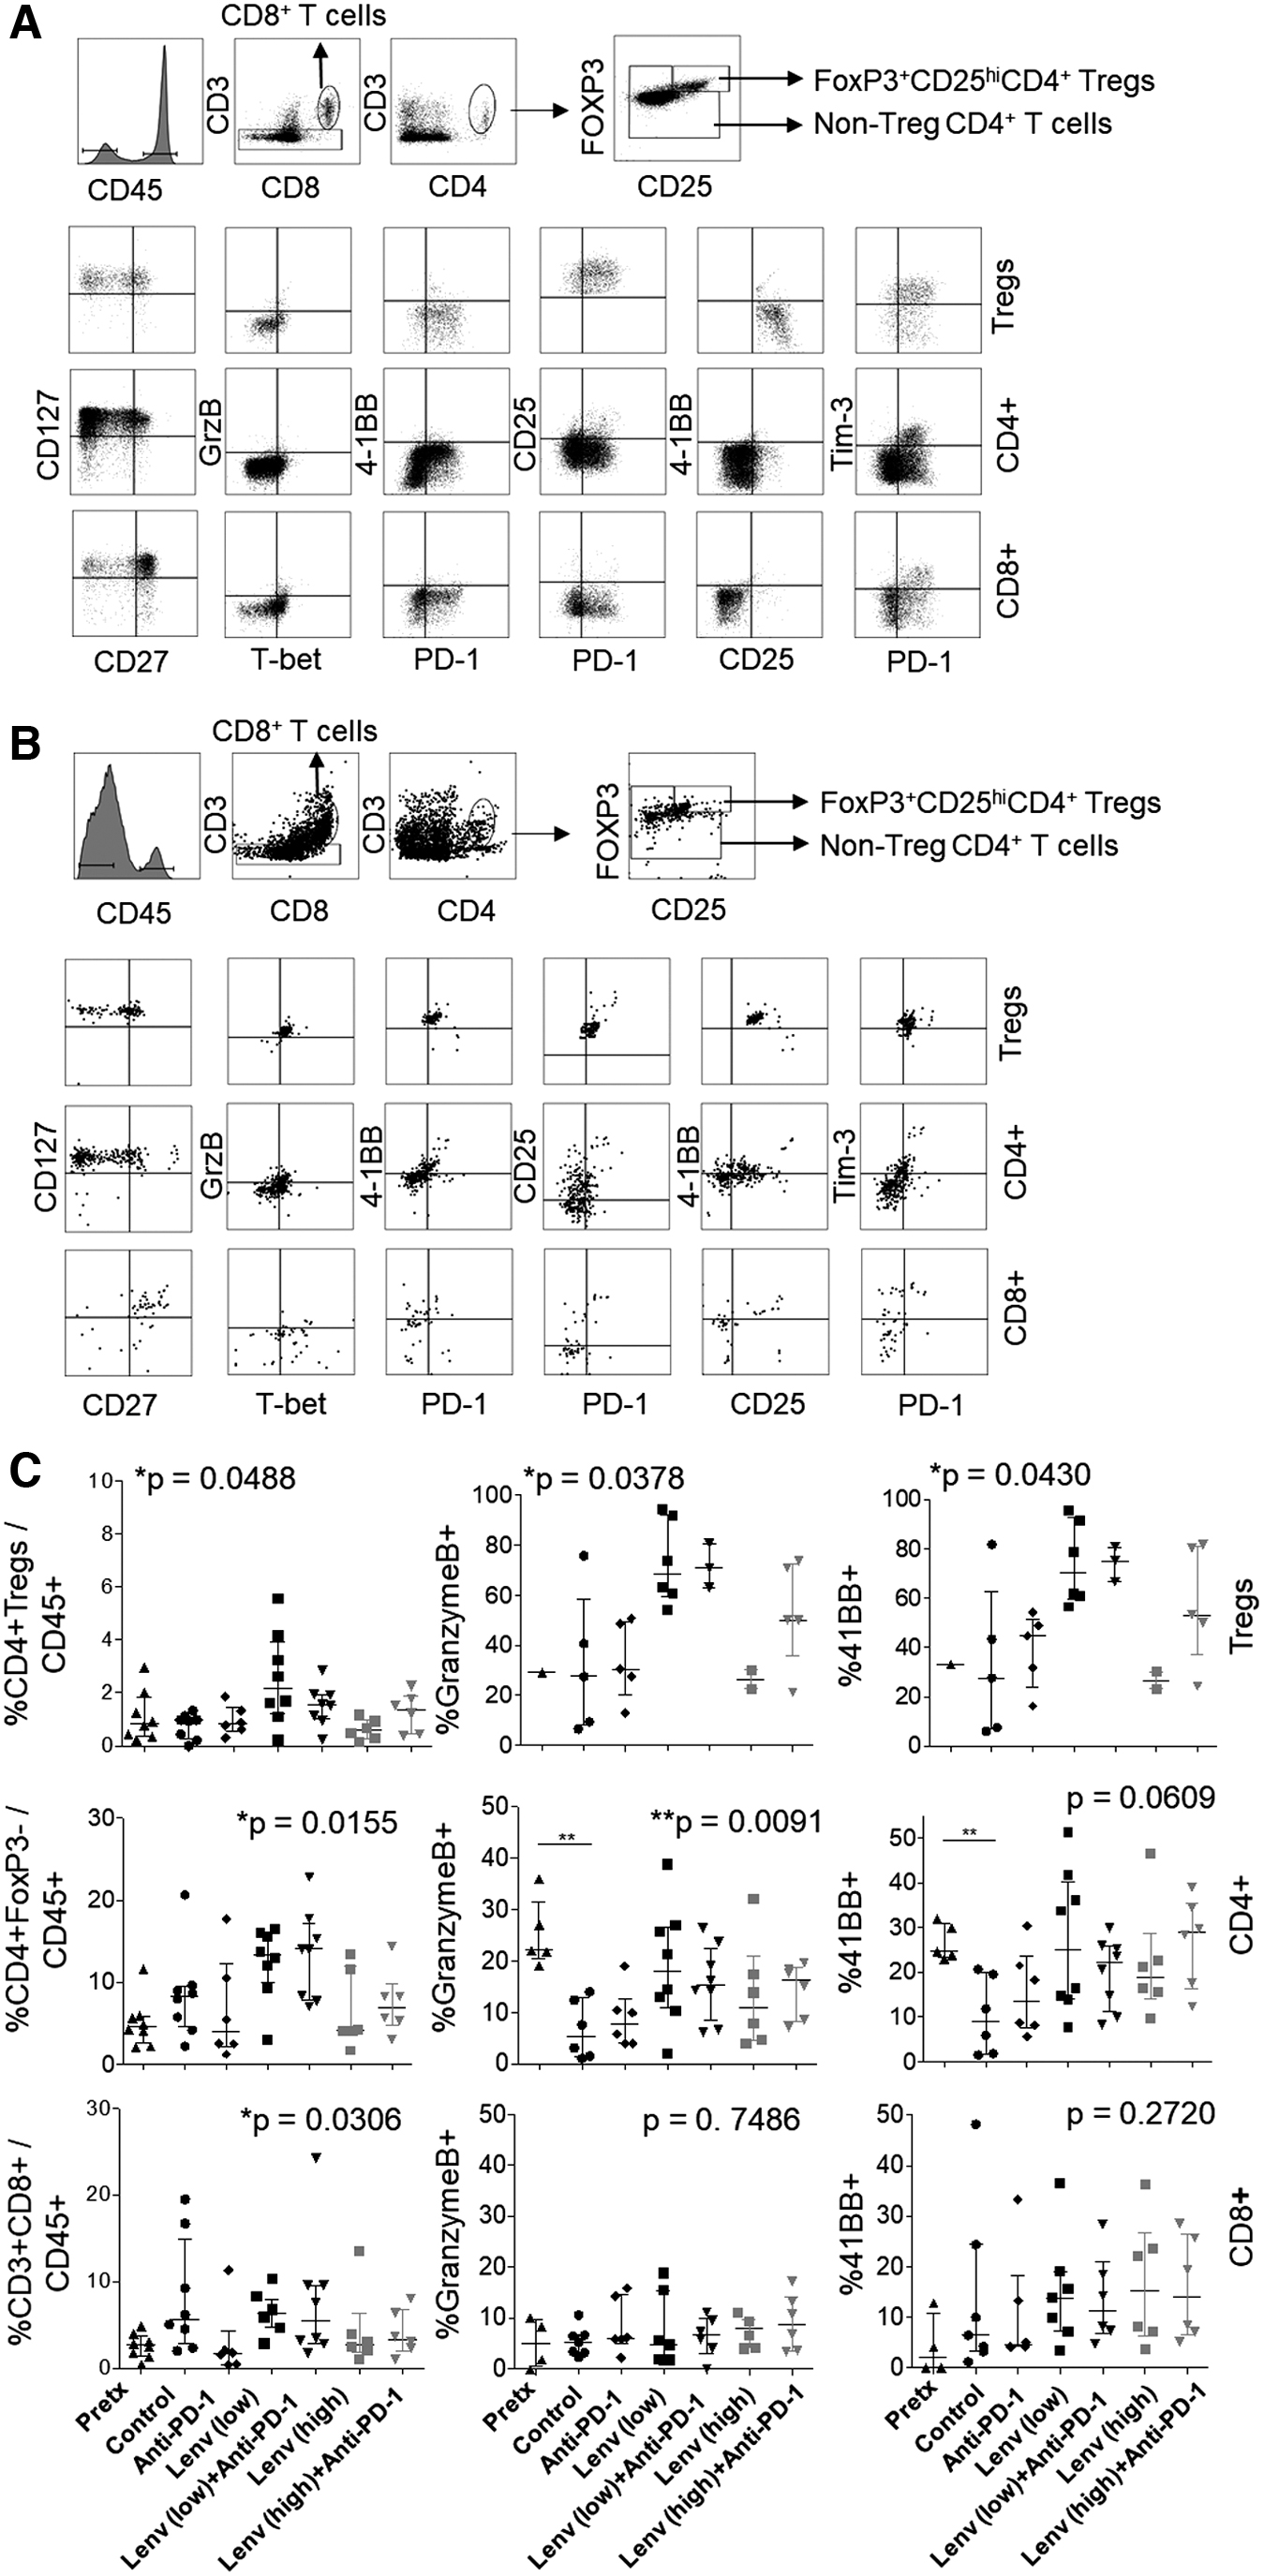
T cell subset frequency and phenotype following therapy. Single-cell suspensions from digested tumor were analyzed by flow cytometry for T cell subsets in control
Of note, 4–1BB and granzyme B were expressed by 20–25% of CD4+ T cells at pretreatment, but reduced in frequency in control mice 6 weeks later. Frequencies of granzyme B+ and 4–1BB+ cells were enriched in both Treg and CD4+ T cell subsets following treatment with low-dose lenvatinib (Fig. 4C). Higher frequencies of Tregs expressing granzyme B and 4–1BB were moderately associated with reduced tumor size (Supplementary Fig. S3). PD-1 and Tim-3 were expressed, on average, by 80% and 20% of CD4+ Tregs and non-Tregs in control mice, respectively. Expression of these immune checkpoints was not altered with treatment (Supplementary Fig. S4A, B).
CD8+ T cell frequency and activation are not increased by lenvatinib or combination therapy
Tumor-infiltrating CD8+ T cells were largely CD27+CD127+, suggesting a resting memory phenotype (Fig. 4). CD8+ T cell frequency and differentiation state, as assessed by expression of CD27, CD127, and T-bet, were not significantly affected by treatment (data not shown). Granzyme B expression was low, while 4–1BB levels were highly variable. Expression of these activation markers was not statistically different between treatment groups (Fig. 4C). PD-1 and Tim-3 expression was variable in control mice, ranging from 1% to 50%. While a trend toward increased expression of PD-1 and Tim-3 was observed in mice treated with high-dose combination therapy, this change was not statistically significant (Supplementary Fig. S4C). Increased CD8+ T cell frequency was moderately correlated with reduced tumor size, irrespective of the treatment group (Supplementary Fig. S3A).
Myeloid cell phenotype is not significantly altered by lenvatinib or combination therapy
To further investigate the phenotype of myeloid cell infiltrate, we assessed expression of PD-L1 and absence of MHCII as markers of immunosuppression. Conversely, coexpression of MHCII and CD80 was considered a sign of immune activation. Ly6G+CD11b+ cells expressed PD-L1, in contrast to the Ly6G+ population in the spleen, lacked MHCII, and expressed CD80 (Fig. 5 and Supplementary Fig. S2B). Ly6G+CD11b+ cells were largely PD-L1+ and MHCII− in pretreatment tumors, while PD-L1 expression was more variable in control-treated mice at 5 months postinduction. Treatment with anti-PD-1, lenvatinib, or combination regimens had no effect on the phenotype of these cells (Fig. 5B). Of note, Ly6G+CD11b+ cell frequency displayed a weak positive correlation with tumor size (Supplementary Fig. S3B).
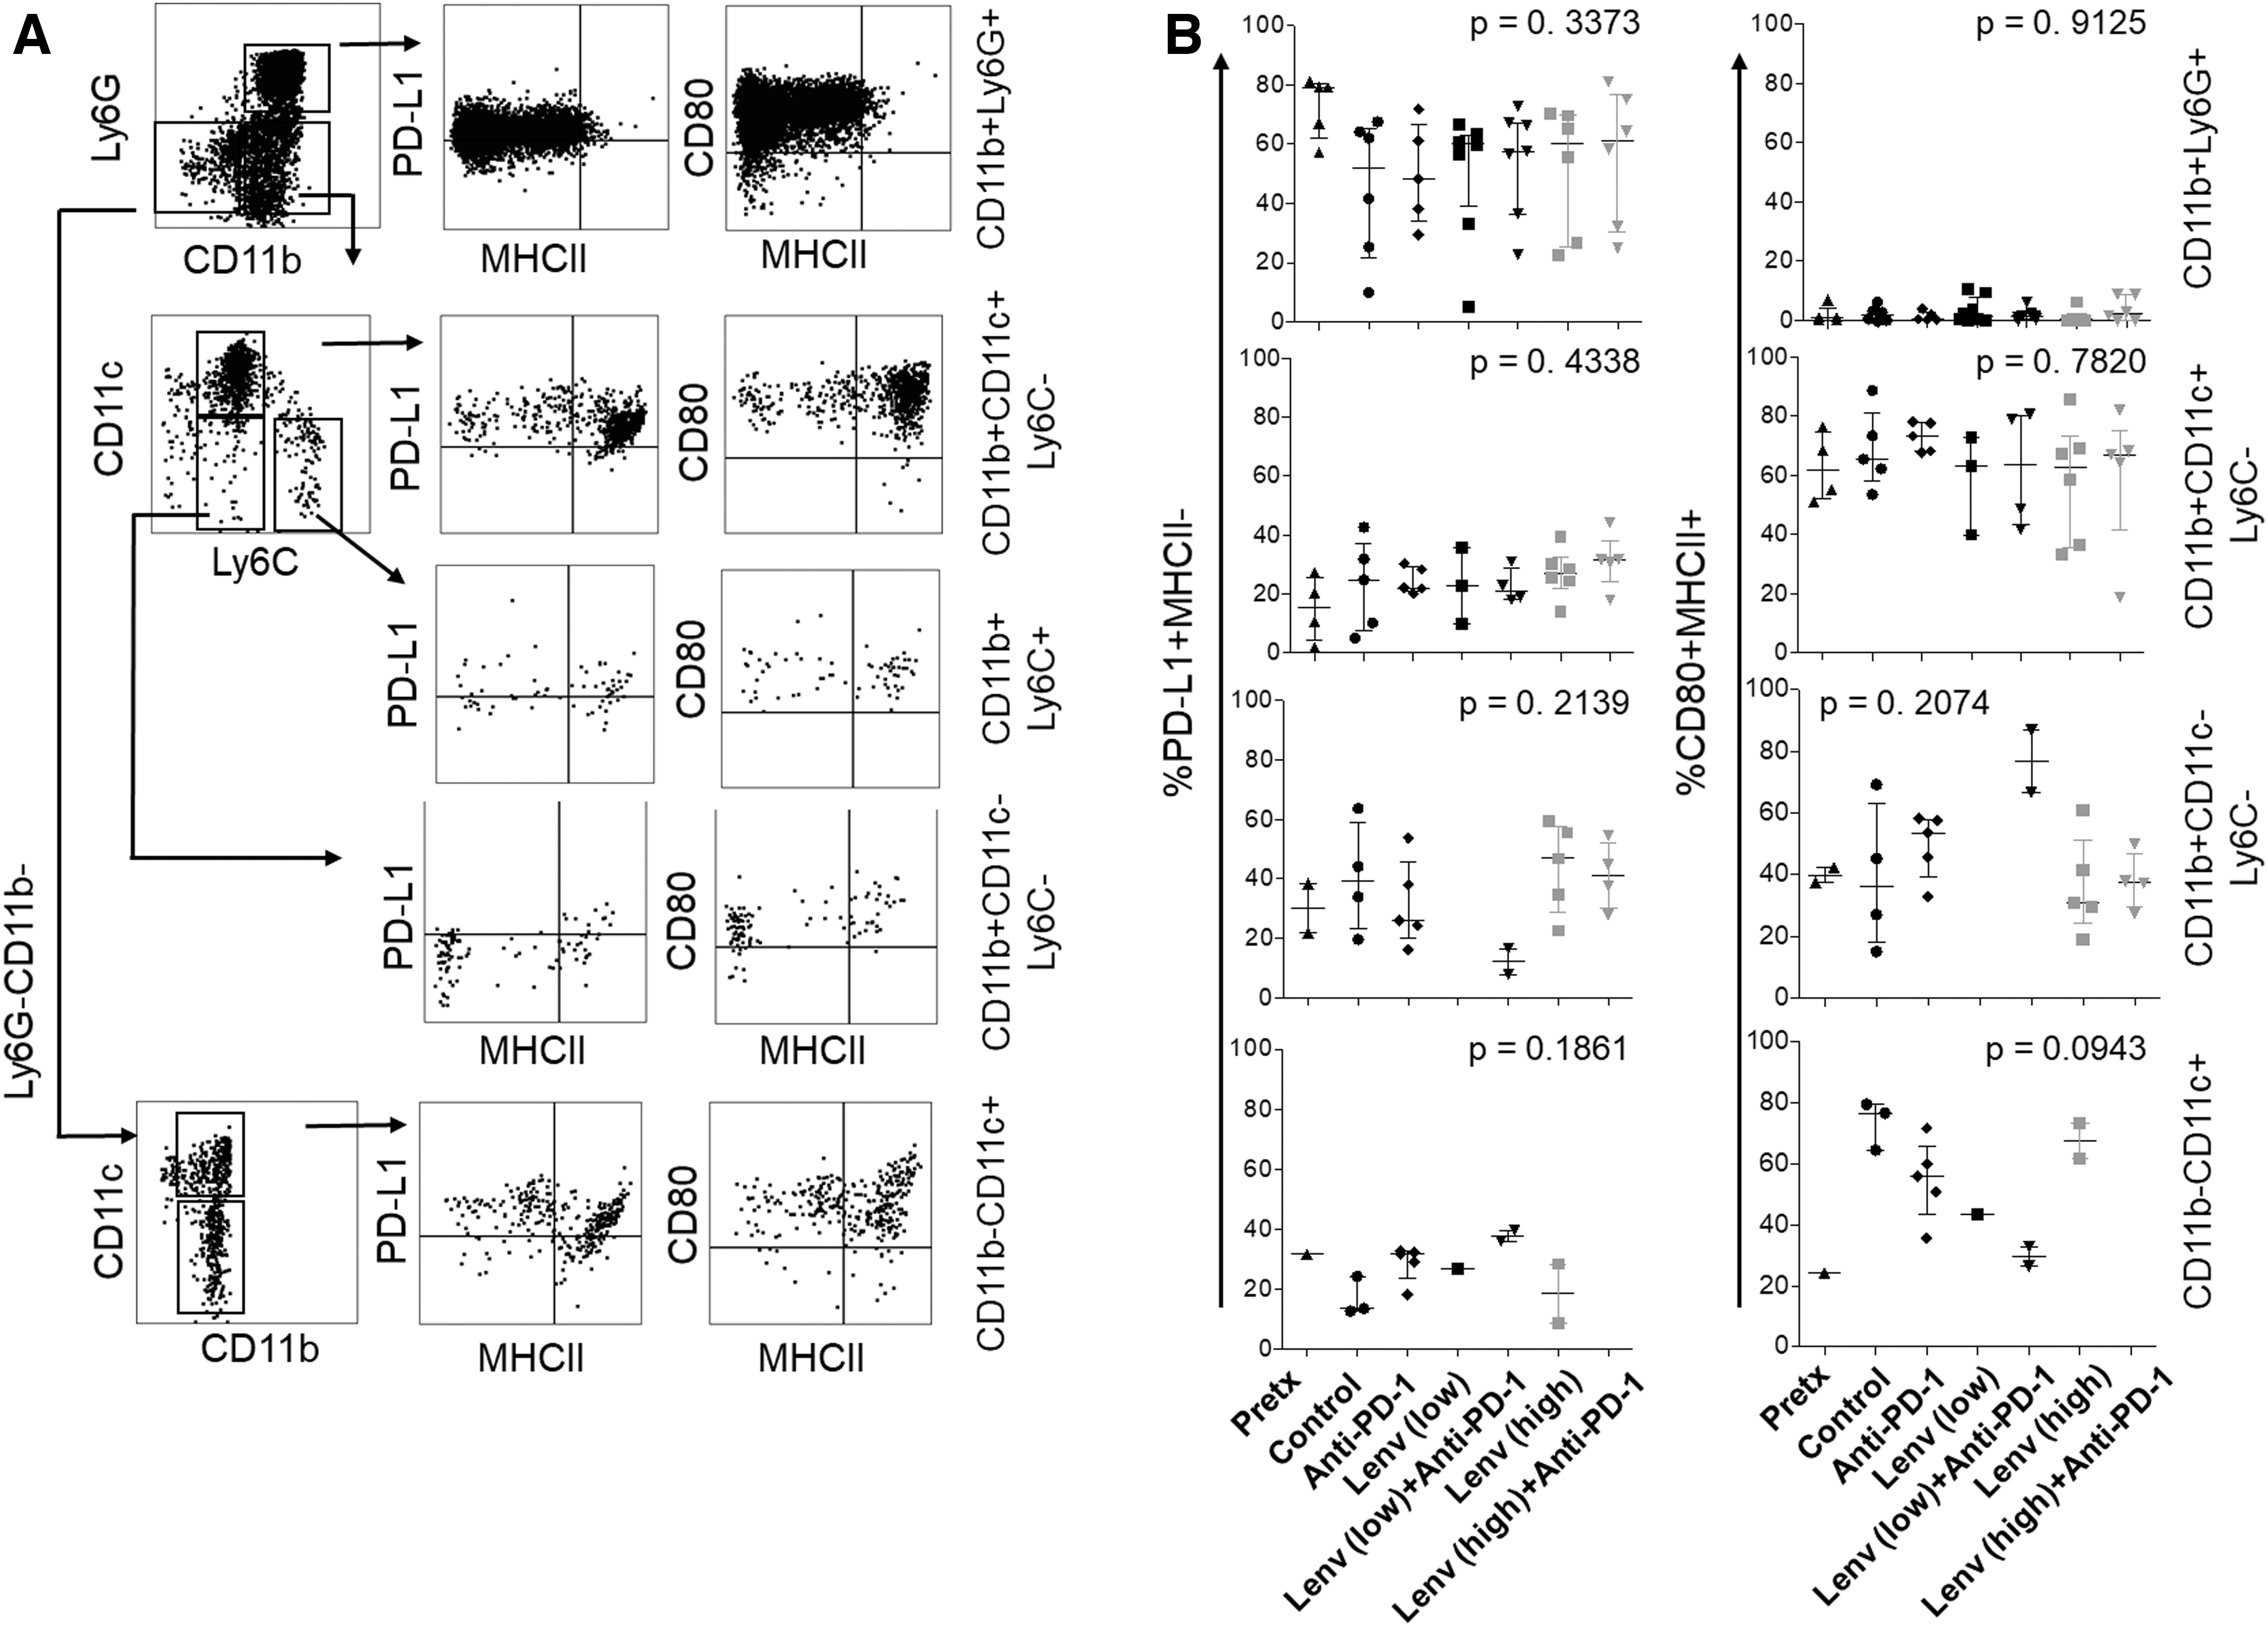
Flow cytometry analysis of myeloid subsets in the TBP preclinical model. Myeloid subsets were gated after exclusion of B and NK cell lineages
CD11b+CD11c+ cDC and CD11b−CD11c+ putative plasmacytoid DC (pDC) cells were largely MHCII+CD80+ in control tumors; however, these cells also expressed PD-L1 (Fig. 5A, B). The cDC phenotype was not altered by treatment (Fig. 5). The pDC cell number was reduced in mice treated with lenvatinib or combination therapy, allowing phenotypic analyses in only up to two tumors per group. The remaining CD11b+CD11c−Ly6C− population, likely containing macrophage infiltrate, showed variable expression of PD-L1, CD80, and MHCII and was nearly absent in mice treated with low-dose lenvatinib (Fig. 5B). When present at sufficient frequency for analysis (i.e., low-dose lenvatinib plus anti-PD-1), these cells were largely MHCII+CD80+ with low PD-L1 expression.
To further assess the macrophage infiltrate, we quantified F4/80 expression in tumors by immunohistochemistry (Supplementary Fig. S5). F4/80+ cells constituted 20% of the tumor area in control mice. The frequencies of these cells were highly variable in mice treated with lenvatinib or combination therapy. A subset of tumors displayed enhanced (>30%) F4/80+ cell frequency. Of note, Ly6G+ cells commonly expressed F4/80, thus complicating interpretation of these data (Supplementary Fig. S5C). Additional studies are necessary to better define the role of macrophages and dendritic cells in this model.
TCR sequencing studies reveal evidence of clonal T cell expansion in a subset of mice
To further investigate the T cell response, we harvested tumors for TCRß CDR3 sequencing following treatment with vehicle or low-dose lenvatinib. The number of productive TCR rearrangements, a measure of T cell frequency, ranged from 1.1 × 10³ to 6.9 × 10³ in 11 of 13 mice (Fig. 6A). The frequency of productive rearrangements was significantly higher in a subset of lenvatinib-treated mice (870 and 874), but did not correlate with reduced tumor volume (Fig. 6B). Moderate polyclonal expansion was evident in 9/13 tumors, with Simpson clonality scores ranging from 0.06 to 0.16 (Fig. 6C). Three tumors (858, 870, and 874) displayed a highly diverse infiltrate, while a single clone constituted 44% of the T cell infiltrate in one vehicle-treated mouse (176; Fig. 6C, E).
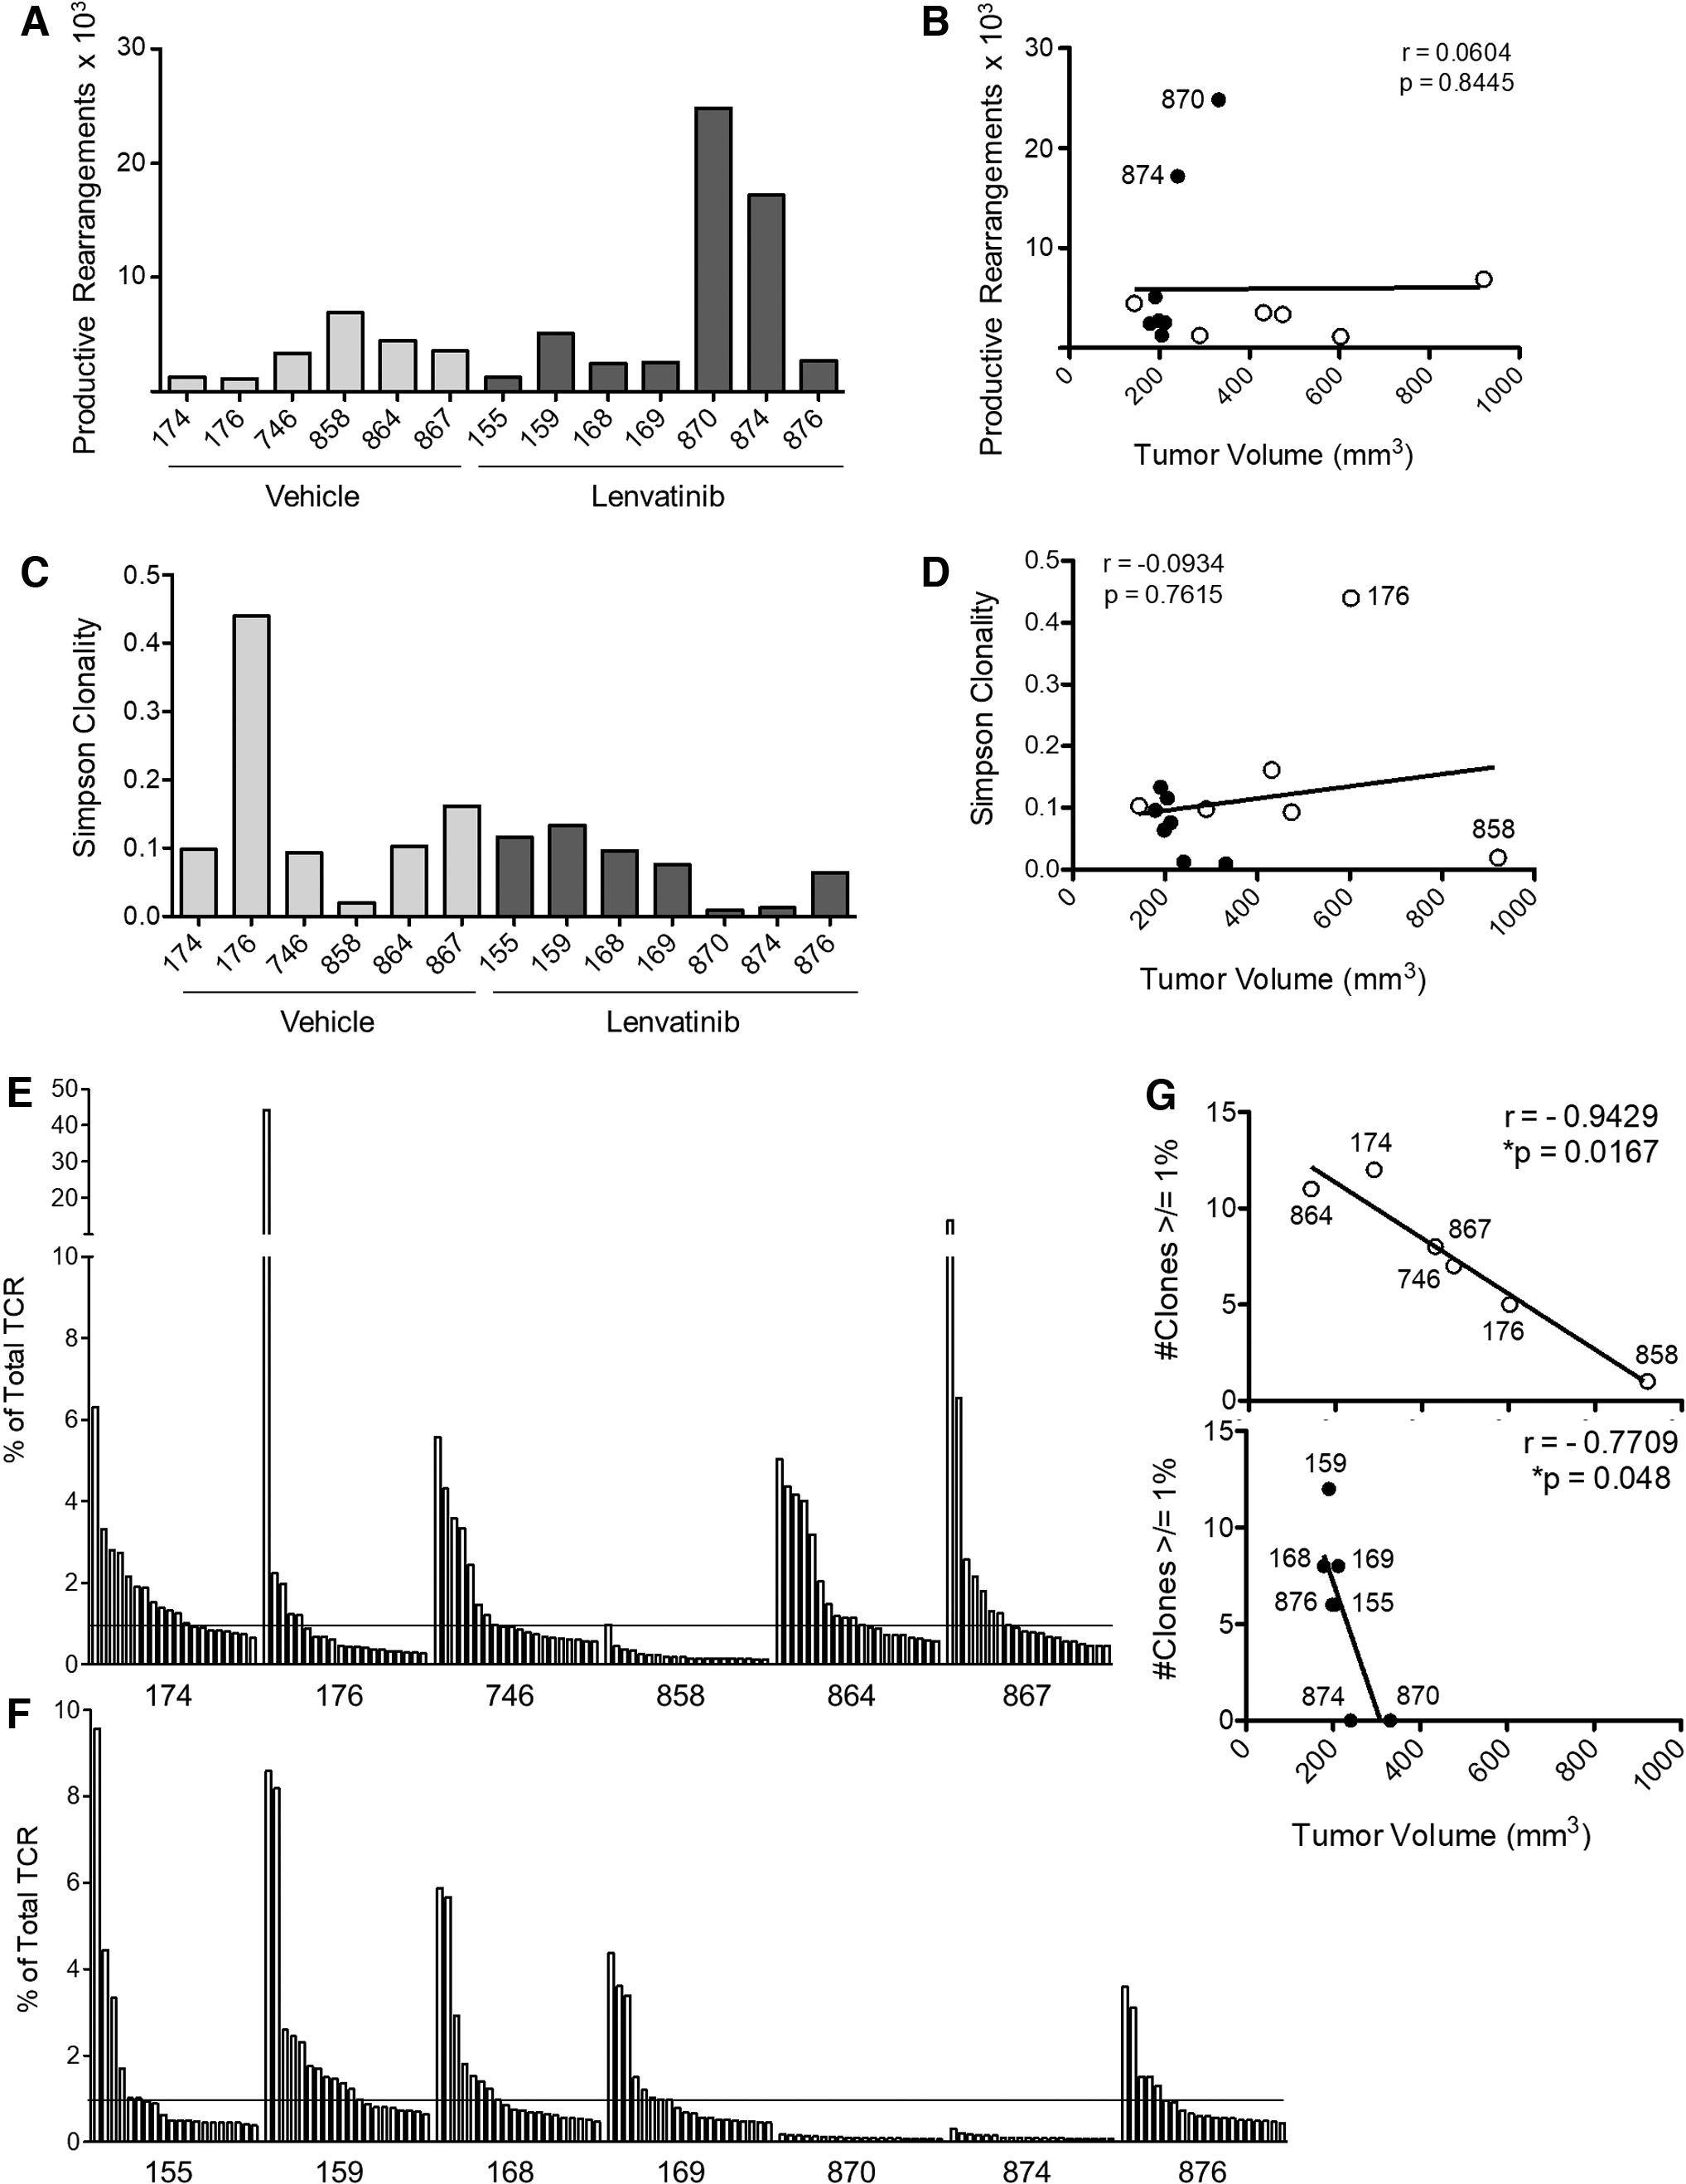
TCRß CDR3 sequencing analysis of tumor-infiltrating T cells. Tumors were harvested from TBP mice after 6 weeks of treatment with vehicle or lenvatinib (2 mg/kg). DNA was isolated for TCRß sequencing. The frequency of productive TCRß rearrangements is shown for each mouse
Of note, the two largest tumors (858 and 176) in the control group had either a highly diverse infiltrate or high clonality (clonality score = 0.0195 or 0.44, respectively). Tumor size was inversely correlated with the number of clones that constituted 1% or more of total productive TCR rearrangements (Fig. 6E–G), suggesting that a polyclonal T cell response is important in slowing tumor progression. This correlation was most evident in vehicle-treated mice where tumor size is highly variable. The dominant TCR sequences in each mouse were rarely expressed in other mice and, when shared, were expressed at low frequencies (Supplementary Table S2). Global motif analysis was performed to further assess TCRß sequence similarities between mice (Supplementary Table S3). This analysis did not reveal preferential use of specific motifs across mice or within treatment groups.
Discussion
Combination lenvatinib plus anti-PD-1 treatment has been previously studied in rapidly growing flank models where tumors establish in 7–10 days (16). Tumor volume was reduced by 50% with anti-PD-1, 60% with lenvatinib, and 90% with combination treatment. CD8+ T cells appeared to be activated in control tumors, with 20% expressing granzyme B, and were required for the treatment effect. Activated CD8+ T cells were further enriched with single-agent or combination treatment to 30–45%. Macrophages were reduced by 50% with lenvatinib treatment. Ly6G+CD11b+ cells constituted only 5% of the leukocyte infiltrate in control mice and were slightly elevated with lenvatinib treatment (12% with lenvatinib).
Lenvatinib alone and in combination with anti-PD-1 or anti-PD-L1 was also studied in a syngeneic orthotopic model of ATC (14). In this model, a BRAFV600E/wt/p53−/− mutant cell line, derived from the TBP mice used in the present study, was injected into the thyroid of syngeneic mice. Tumors grew rapidly, leading to death within 14 days. Treatment with lenvatinib at a nonphysiologically high dose (30 mg/kg = 146 mg in humans by surface area conversion) (18) was initiated 1 week after tumor cell injection. Median survival was increased by 5 days with lenvatinib alone and by 9 or 14.5 days with combined anti-PDL1 or anti-PD1, respectively, while anti-PD-1 alone had no effect. Similar to the flank models described above, CD8+ and granzyme B+ T cells were evident in control tumors and were increased with treatment. F4/80+CD206+ M2-like macrophages and Ly6G+CD11b+ cells constituted ∼5% or less of the infiltrate in control tumors and were increased in response to lenvatinib and combination therapy (7–12% and 8–16%, respectively). Depletion of Ly6G+ cells (anti-GR-1) during lenvatinib treatment led to a subtle reduction in tumor size compared with lenvatinib or anti-GR-1 alone.
In contrast to previous reports, Ly6G+CD11b+ cells constituted 27% (mean ± 15% SD) of the CD45+ immune infiltrate in control TBP mice. We observed a subtle reduction rather than an increase in this population with 2 mg/kg lenvatinib. CD8+ T cells in the established TBP tumors were largely resting memory cells that show minimal evidence of activation. CD8+ T cell frequency and activation status were not significantly enhanced by lenvatinib treatment. CD4+ T cells were most affected by lenvatinib treatment, with both classical CD4+ T cells and Tregs showing signs of activation (24,25). 4–1BB costimulatory signaling has been associated with enhanced proliferation and survival, cytokine production, and development of cytolytic properties in both CD4+ and CD8+ T cells (26,27). CD4+ T cells with cytotoxic activity have been documented and are characterized by their ability to secrete granzyme B to kill target cells in an MHC class II-restricted manner (25). Granzyme B and 4–1BB expression by Tregs may be indicative of decreased suppressive activity (24). Despite invigoration of the CD4+ T cell response and reduced Ly6G+CD11b+ infiltrate, lenvatinib therapy alone or in combination with anti-PD-1 was insufficient to mediate long-term tumor regression.
In contrast to previous studies, anti-PD-1 did not enhance the effects of lenvatinib in the TBP model. We hypothesize that the impressive response to combination therapy in previous studies was due to administration of the ICB at early stages (7–10 days from implantation) of immune–tumor interactions. The immunoediting theory of tumor–immune interaction during tumor development and progression defines three stages of tumor–immune interaction (28). During the early elimination stage, the immune system successfully recognizes and eliminates the majority of cells within a developing tumor. Remaining tumor cells may survive at low levels during the equilibrium stage, but eventually evade the ensuing T cell response through loss of tumor antigens and/or deficiencies in antigen processing and presentation. In the established tumor, the immune microenvironment is highly immunosuppressive, the T cell response is dysfunctional, and antigen-specific T cells may be sparse or absent. We suggest that rapid orthotopic and flank tumor models are representative of the elimination phase of immunoediting. We would expect that the T cells in these models would be highly responsive to anti-PD-1 ICBs, which would rescue these cells from activation-induced cell death and early stages of T cell exhaustion (29).
Increased CD8+ T cell frequency was associated with smaller tumor volume in TBP mice, suggesting that a tumor-specific response is generated in a subset of mice. The lack of a robust CD8+ T cell response in this model may be due, in part, to poor antigen presentation. While our analysis of MHCI by immunohistochemistry showed evidence of protein expression, membrane localization was difficult to discern. Of interest, TCRß sequencing data revealed that monoclonal expansion was observed (44% of total TCR) in one vehicle-treated mouse. This impressive response was ineffective at controlling tumor progression as the mouse was sacrificed with a large tumor (603 mm3) after only 2 weeks on the therapy protocol. We hypothesize that antigenic shift or a defect in antigen processing and/or presentation contributed to immune evasion in this tumor.
The inefficiency of anti-PD-1 therapy in the current study may be explained, in part, by late-stage T cell exhaustion and/or a low frequency of tumor-specific CD8+ T cells. Although TCRß sequence analysis revealed that moderate polyclonal T cell expansion was associated with reduced tumor size in TBP mice, additional studies are necessary to determine the specificity of tumor-infiltrating T cells. Furthermore, Ly6G+CD11b+, putative polymorphonuclear myeloid-derived suppressor cells (30,31), likely pose a significant barrier to a productive immune response. Additional therapeutic strategies to boost the inherent T cell response and/or reduce Ly6G+ infiltrate may improve response in this model.
Previous studies have shown that low-dose anti-VEGF therapy normalized vasculature and reversed immune suppression, whereas higher doses led to vessel pruning, hypoxia, and increased immune suppression (15). Our studies suggest that low-dose lenvatinib is superior to higher dose in controlling tumor growth, supporting CD4+ T cell activation, and altering the myeloid milieu. Thus, the dose of the antiangiogenic may be an important consideration in combination approaches with immune-modulating therapies. A retrospective analysis of the response rate and duration in patients receiving low- and high-dose antiangiogenics in combination with anti-PD-1 may support a prospective investigation.
Despite growing enthusiasm for combination antiangiogenic plus ICB therapies, response rates and durability of response are only subtly improved over single-agent approaches. Our studies underscore the importance of model selection in defining the mechanisms of immune-modulating therapies. Previous studies in nonphysiological flank and orthotopic tumor models may have overestimated the efficacy of lenvatinib plus anti-PD-1 therapy. Inducible, slow-growing tumor models, such as the TBP mouse, better represent the tumor–immune milieu found in most patients with advanced cancer and can be used to advance current therapeutic strategies.
Footnotes
Acknowledgments
Quantitative PCR analyses were performed by the Endocrine-PCR Core. Flow cytometry studies were performed with the University of Colorado Cancer Center Flow Cytometry Shared Resource. Tissue preparation for histology and immunohistochemistry studies was performed with the University of Colorado Pathology Shared Resource.
Authors' Contributions
B.C.B. contributed to data generation and article review; E.S.B., J.D.C., A.M., M.L.L., S.B.S., and D.J.O. contributed to data generation; E.A.D. contributed to article review; and J.D.F. contributed to data generation and article preparation and is a coinvestigator in a clinical trial with Merck and Eisai.
Author Disclosure Statement
B.R.H. and J.D.F. are leading a clinical trial with Merck and Eisai to investigate the efficacy of lenvatinib with pembrolizumab in progressive thyroid cancer. The authors have no other relevant conflicts of interest to report.
Funding Information
This work was supported by the São Paulo Research Foundation (FAPESP) (to B.C.B. and E.A.D.) (process no. 2018/16189-9); Memorial Sloan Kettering Cancer Center P50 CA172012-04 (to B.R.H. and J.D.F.); and Mary Ross Kern and Jerome H. Kern Endowment in Endocrine Neoplasm Research (to B.R.H.).
Supplementary Material
Supplementary Table S1
Supplementary Table S2
Supplementary Table S3
Supplementary Figure S1
Supplementary Figure S2
Supplementary Figure S3
Supplementary Figure S4
Supplementary Figure S5
Supplementary Data S1