
Abstract
Background:
There are conflicting data regarding the association of thyroid function with incident diabetes. We prospectively investigated thyrotropin (TSH), free thyroxine (fT4), free triiodothyronine (fT3), and its conversion ratio (fT3:fT4) with the risk of developing diabetes in euthyroid subjects and those with subclinical thyroid dysfunction. Our hypothesis is that this relationship is a U-shaped curve since both subclinical thyroid diseases may be associated with diabetes.
Methods:
ELSA-Brasil is a highly admixed cohort study of 35–74 years old at baseline (2008–2010). Levels of TSH, fT4, fT3, and fT3:fT4 ratio were evaluated at baseline and incident diabetes was estimated over an 8.2-year follow-up (2017–2019). Diabetes was identified based on medical diagnosis, prescriptions, and laboratory tests. The risk of diabetes was evaluated according to quintiles of TSH, fT4, fT3, and fT3:fT4 ratio using Poisson regression with robust variance presented as relative risk (RR) with confidence interval [CI] of 95% after multivariable adjustment for sociodemographic and cardiovascular risk factors (reference third quintile), and as continuous variables.
Results:
We included 7948 participants (mean age, 50.2 [standard deviation 8.6] years; 54.4% female): 7177 euthyroid, 726 with subclinical hypothyroidism, and 45 with subclinical hyperthyroidism. Incidence of diabetes was 14.8%. No association was found for TSH, fT4, fT3, and fT3:fT4 ratio quintiles with incident diabetes. Using continuous variables, the increase of 1-unit (1-U) of fT4 decreased the risk of diabetes (RR 0.94 [CI 0.91–0.99]), while the increase of 1-U of the fT3:fT4 ratio increased the diabetes risk (RR 1.37 [CI 1.15–1.63]). The increase of 1-U of fT3 was associated with an increased risk of diabetes, but without significance after multivariable adjustment. In body mass index-stratified analysis, people with overweight or obesity presented a modest significantly higher risk of diabetes in the lowest quintile of fT4 (RR 1.04 [CI 1.01–1.07]) and an inverse association with incident diabetes in the first quintile of fT3:fT4 ratio (RR, 0.95 [CI 0.93–0.98]). The analyses using continuous variables presented similar findings.
Conclusion:
These findings suggest that fT4 and fT3 levels and the conversion rate might be additional risk factors associated with incident diabetes, especially in the presence of overweight or obesity. However, they need to be confirmed in future studies. (
Background
Thyroid dysfunction and type 2 diabetes are prevalent endocrine disorders. The high frequency of thyroid dysfunction in people with diabetes and of diabetes in those with thyroid dysfunction suggests that both diseases share underlying mechanisms (1,2). Besides, diabetes is characterized by hyperglycemia from impaired insulin secretion and/or insulin resistance, and thyroid hormones (TH) influence insulin and glucose homeostasis (1). Subclinical hyperthyroidism has been associated with increased hepatic gluconeogenesis (3), increased glucose response after an oral glucose tolerance test (4), insulin degradation (5), and resistance (4,6). On the other hand, subclinical hypothyroidism is associated with decreased use of peripheral glucose (7), higher glucose levels (8), decreased glucose oxidation/glycogen synthesis (9), and insulin resistance as well (10,11).
Few studies explored prospectively the relationship between thyrotropin (TSH) and TH with incident diabetes. The Rotterdam study showed an association between higher TSH and lower free thyroxine (fT4) levels with incident diabetes (12), but these findings were not confirmed in another study in the country (13). Two large cohort studies in Korea did not find an increased risk of diabetes (14,15), but they reported that higher increases of TSH and TH levels during the follow-up were associated with increased risk of diabetes (14,15). Finally, a large Chinese study found a significant association between the highest TSH quartile and metabolic syndrome, but not with diabetes (16).
In clinical practice, thyroid function is determined by TSH and fT4 levels. Free triiodothyronine (fT3) is less used, mostly to identify hyperthyroidism with fT4 in the normal range. fT3:fT4 ratio is not used in clinical practice, but has been used in studies to estimate deiodinase activity. There is scarce information about fT3:fT4 ratio and the risk of diabetes (17). As obesity leads to an increased conversion rate, the hypothesis of a positive association between fT3:fT4 ratio and incident diabetes seems reasonable.
This study investigated the prospective association of TSH, TH, and fT3:fT4 ratio with the risk of developing diabetes using data from the Brazilian Longitudinal Study of Adult Health (ELSA-Brasil), a highly admixed sample of European, African-American, and native Brazilian descendants, who were not evaluated in previous studies. We hypothesized that the relationship of TSH and TH with incident diabetes is a U-shaped curve with both low and high levels associated with diabetes.
Methods
Design and study population
ELSA-Brasil is a prospective cohort study with 15,105 civil servants 35–74 years of age from six Brazilian cities. More detailed information about the study can be found elsewhere (18 –21).
Baseline (2008–2010) and follow-up (2012–2014; 2017–2019) assessments had a broad set of questionnaires, clinical variables, and laboratory tests performed by trained staff, following standardized protocols and under rigorous supervision (18 –21). The study was approved by the ethics board of all institutions, and all participants provided signed informed consent.
Thyroid function and diabetes
Venous blood samples were drawn after an overnight fast from 6.30 am to 9.00 am. TSH (normal range: 0.4–4.0 mIU/L), fT4 (0.93–1.7 ng/dL), and fT3 (0.20–0.44 ng/dL) were determined by a third-generation immunoenzymatic assay (Roche Diagnostic, Manheim, Germany). The analysis included euthyroid participants (TSH levels 0.4–4.0 mIU/L and no use of levothyroxine/anti-thyroid drugs) and participants with subclinical hyperthyroidism (TSH levels <0.4 mIU/L and fT4 levels 0.93–1.7 ng/dL) and subclinical hypothyroidism (TSH >4.0 mIU/L with fT4 0.93–1.7 ng/dL). Participants with overt thyroid diseases were excluded (22). We excluded participants using medication that alters thyroid function (amiodarone, carbamazepine, carbidopa, furosemide, haloperidol, heparin, levodopa, lithium, metoclopramide, phenytoin, propranolol, primidone, rifampicin, steroids, and valproic acid) and those with diabetes at baseline from the analysis (Fig. 1).
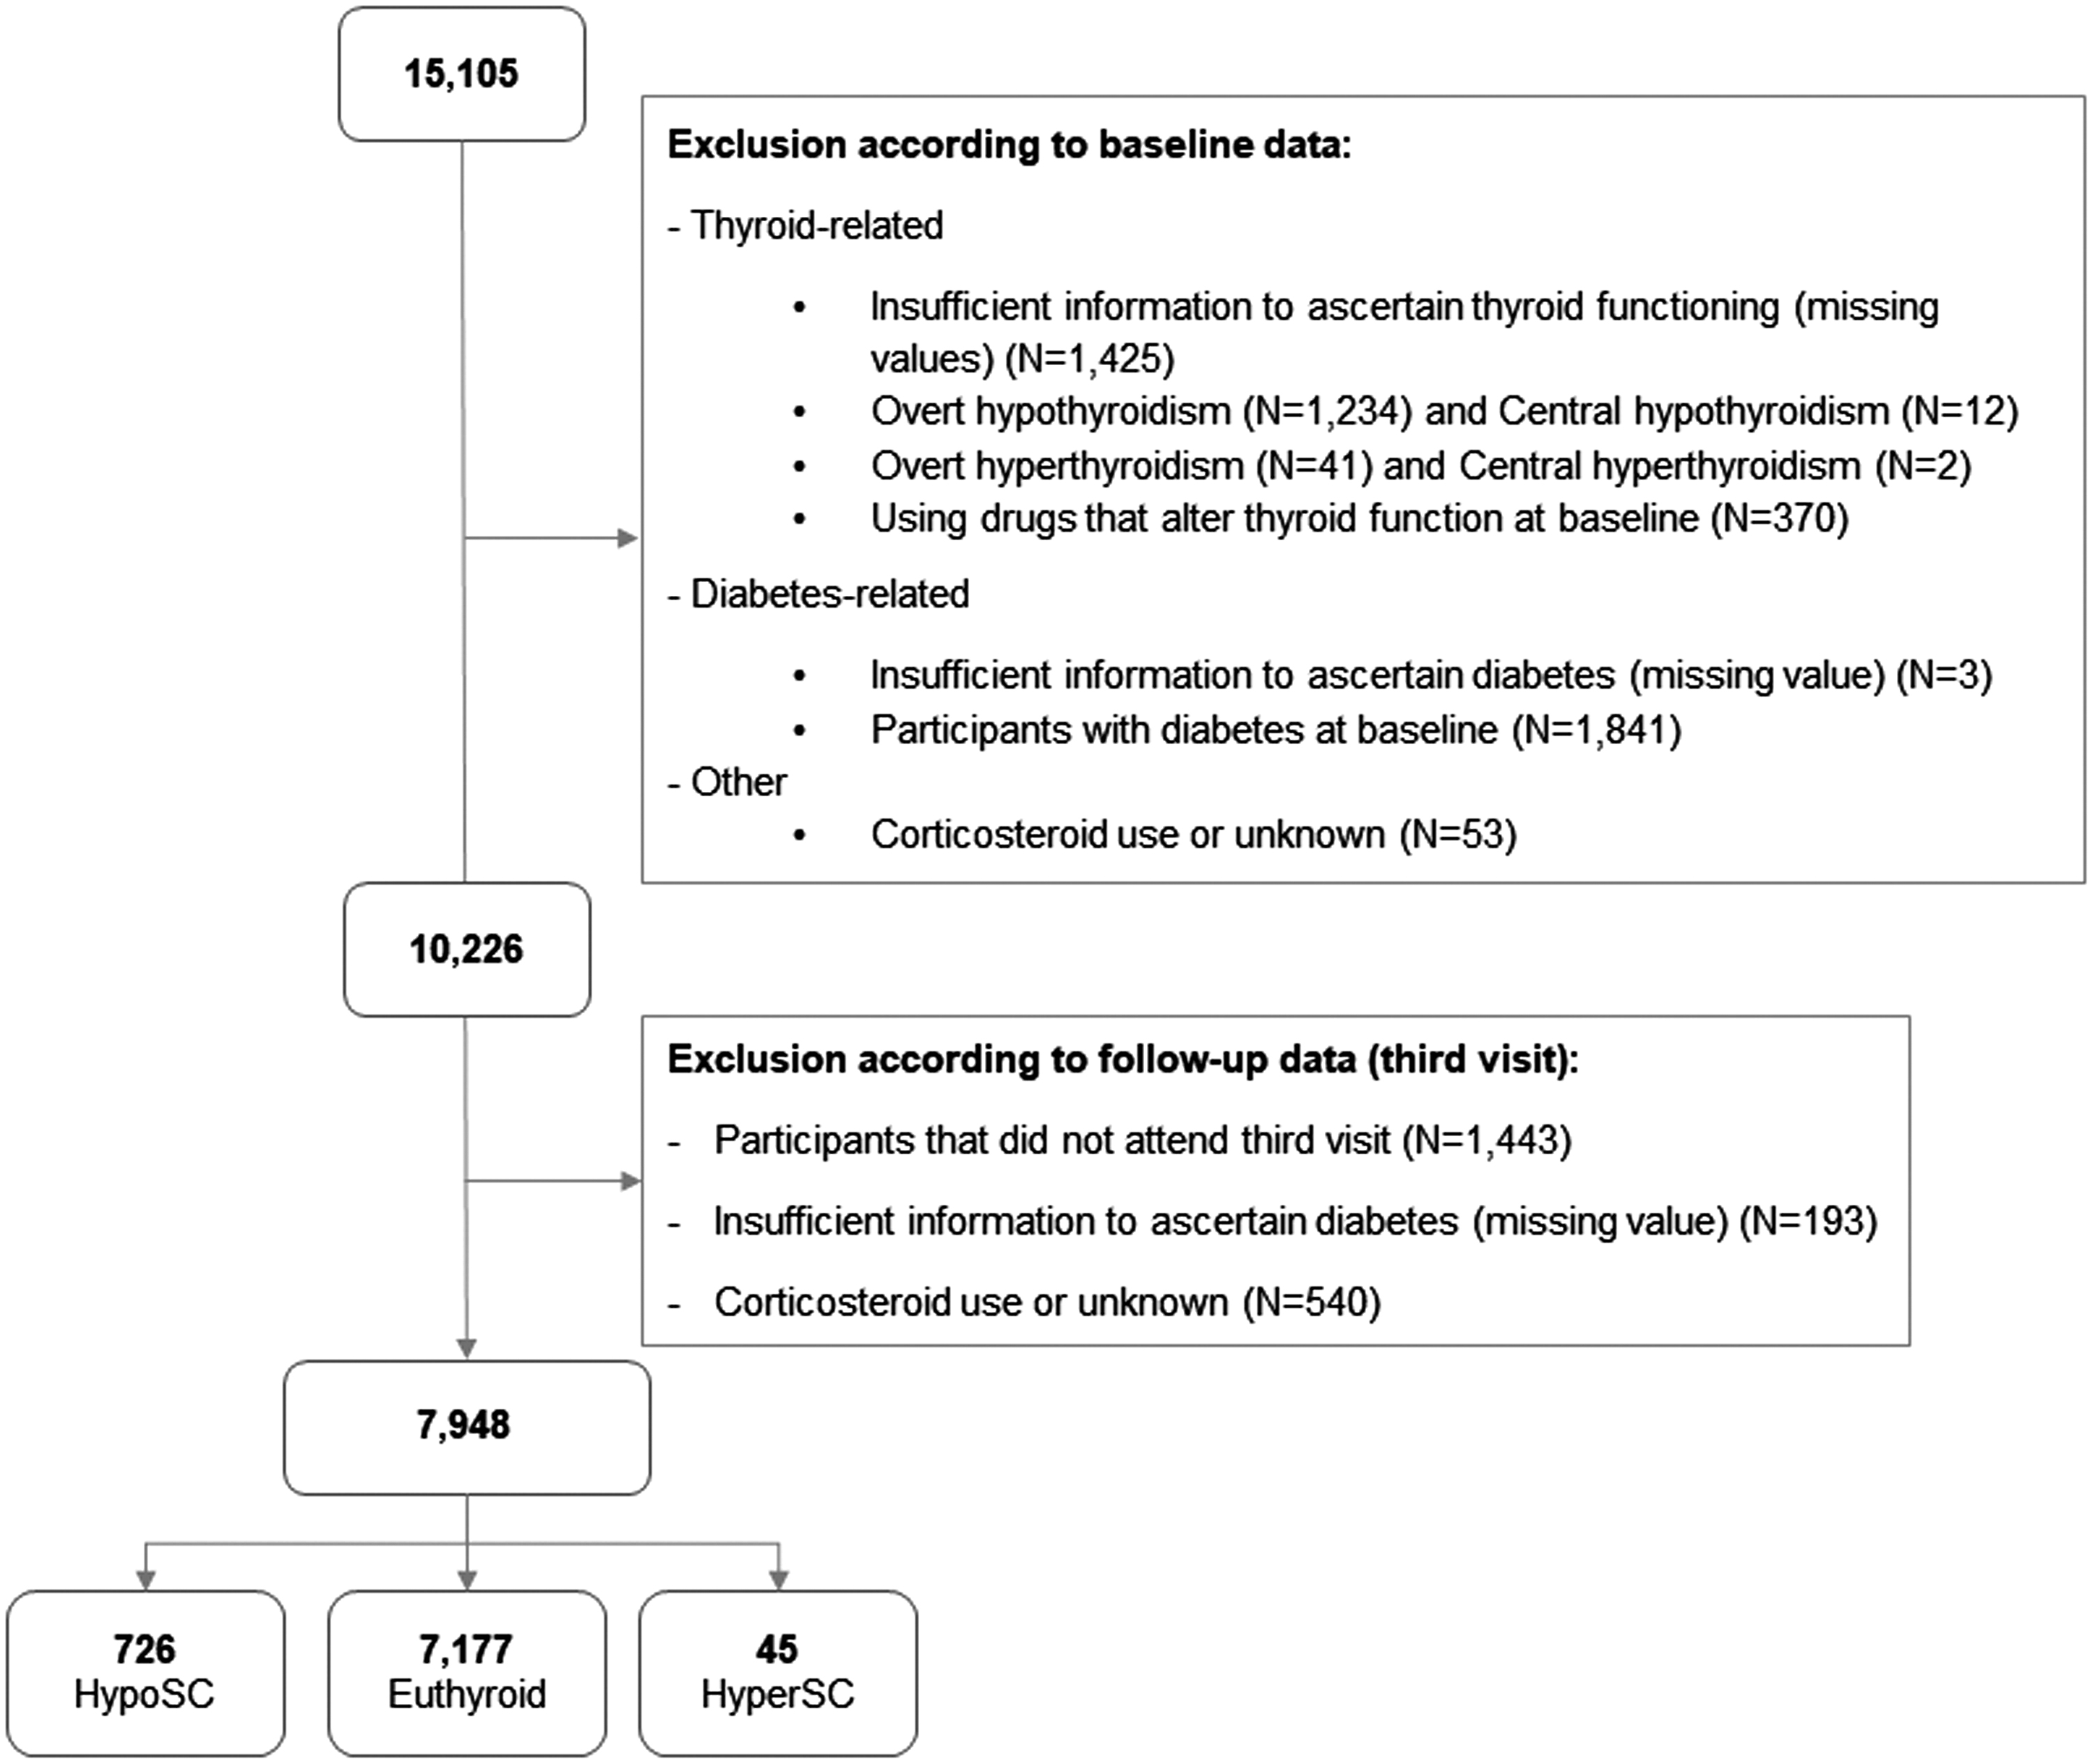
Study sample flowchart. HyperSC, subclinical hyperthyroidism; HypoSC, subclinical hypothyroidism.
The definition of diabetes included a self-reported medical diagnosis of diabetes, use of drugs to treat diabetes, fasting plasma glucose levels ≥7.0 mmol/L, 2-h glucose levels ≥11.1 mmol/L, or HbA1c ≥6.5%. Prediabetes was defined according to the ADA (23).
Other baseline variables
Questionnaires addressed age, educational attainment (less than high school, high school, complete College, or higher), average monthly family income in US$ (<1245, 1245–3319, ≥3320; US$ = R$ 2), self-reported race (white, mixed, black, Asian, and indigenous); private health insurance plan (yes/no), and smoking and alcohol status (never, past, or current). Physical activity at leisure was assessed by the International Physical Activity Questionnaire and categorized as inactive, insufficiently active, and active (19,24,25). All participants informed medication use in the last two weeks before the interview.
Body mass index (BMI) and waist circumference were measured using standard techniques (21). Hypertension was identified by systolic blood pressure ≥140 mmHg or diastolic blood pressure ≥90 mmHg (both measured at the research center), or reported use of medication to treat hypertension (21,26).
Dyslipidemia was defined as the use of lipid-lowering medication or low-density lipoprotein (LDL)-cholesterol ≥130 mg/dL. Total cholesterol, high-density lipoprotein (HDL)-cholesterol, and triglycerides (glycerol phosphate peroxidase) were measured by enzymatic colorimetric assay (Siemens, Deerfield, USA); LDL-cholesterol was calculated using Friedewald equation, except if triglycerides >400 mg/dL, when an enzymatic colorimetric assay (ADVIA 1200; Siemens) was used.
Insulin concentrations were measured with an immunoenzymatic assay (Siemens). We used Homeostasis Model Assessment as surrogates for insulin resistance (HOMA-IR) and pancreatic β-cell functional capacity (HOMA-β) (27,28).
Statistical analysis
Categorical variables are described as absolute numbers (proportions) and compared by the chi-square test. Continuous variables are presented as mean (standard deviations [SD]), after testing for normality (Kolmogorov-Smirnov goodness-of-fit test), and compared by one-way ANOVA.
The risk of developing diabetes and prediabetes was assessed by Poisson regression models with robust variance using quintiles of TSH, TH, and fT3:fT4 ratio shown as relative risks (RR) with 95% confidence interval (CI), using the third quintile as the reference, or as continuous variables. RR are presented as crude, adjusted by age and sex (Model 1) and with multivariable adjustment (Model 1 plus self-reported race, education, BMI, smoking, alcohol intake, dyslipidemia, and physical activity - Model 2).
The main analysis was conducted using baseline and 8.2-year follow-up data. A sensitivity analysis was performed using the incidence of diabetes at the 4-year follow-up confirmed at the 8.2-year follow-up. We also performed a post hoc secondary analysis according to BMI categorized as <25 and ≥25 kg/m2 (overweight/obese).
All analyses were performed using the software R version 3.5.3 (R Core Team, Vienna, Austria). A p-value <0.05 was considered statistically significant.
Results
The baseline characteristics of 7948 participants (7177 [90.3%] euthyroid; 726 [9.1%] with subclinical hypothyroidism; and 45 [0.6%] subclinical hyperthyroidism) are shown in Table 1. The mean age of participants was 50.2 (SD 8.6) years, 54.4% female, being mostly white (53.6%). The most frequent cardiovascular risk factors were dyslipidemia (43.1%) and hypertension (28%). Additional description of participants' baseline characteristics by thyroid status (Supplementary Table S1) and according to quintiles of TH and fT3:fT4 ratio is shown in Supplementary Tables S2–S4.
General Baseline Characteristics According to Quintiles of Baseline Thyrotropin of the Euthyroid Participants or with Subclinical Thyroid Dysfunction
Mean (standard deviation).
HOMA-IR, Homeostasis Model Assessment as surrogates for insulin resistance; TSH, thyrotropin.
After a mean follow-up of 8.2 (SD 0.53) years, the incidence of diabetes was 14.8%. Participants who developed diabetes were slightly older, less educated, or physically active at baseline compared to those who did not develop diabetes (Table 2).
Characteristics of Participants Who Developed vs. Not Developed Diabetes After 4 Years of Follow-Up
fT3, free triiodothyronine; fT4, free thyroxine.
Using the third quintile as reference, no association was found for TSH, TH, and fT3:fT4 ratio with the risk of developing diabetes after multivariable adjustment. However, the increase in 1-unit (1-U) of fT4 decreased the risk of diabetes (RR 0.94 [CI 0.91–0.99]), while the increase of 1-U of the fT3:fT4 ratio increased risk (RR 1.37 [CI 1.15–1.63] of diabetes (Table 3). The sensitivity analysis considering participants with diabetes at the 4-year follow-up confirmed in the 8.2-year follow-up was nonsignificant (Supplementary Table S5).
Diabetes Incidence According to the Baseline Quintiles of TSH, fT4, fT3, and Conversion Ratio (fT3:fT4) of Euthyroid or with Subclinical Thyroid Disorder Using the Third Quintile as the Reference
Bold is statistically significant p < 0.05.
Multivariable adjustment by age, sex, race, educational level, body mass index, smoking, alcohol consumption, physical activity, and dyslipidemia.
RR, relative risk.
Participants with overweight or obesity showed a significantly higher risk of diabetes in the lowest quintile of fT4 (RR 1.04 [CI 1.01–1.07]) using the third quintile as reference. In addition, in the same subset of participants, low fT3:fT4 ratio presented a modest inverse association (RR 0.96 [CI 0.93–0.98]) compared to those within the normal-weight range using the same reference. In the analyses stratified by BMI, participants with overweight or obese presented both an inverse association for diabetes for a 1-U increase of fT4 and an increased risk for diabetes at each 1-U increase of fT3:fT4 ratio (Table 4).
Incident Diabetes According to the Quintiles of TSH, fT4, fT3, and fT3:fT4 Ratio at Baseline, Stratified by Body Mass Index Category
Multivariable adjustment age, sex, race, educational level, smoking, alcohol consumption, physical activity, and dyslipidemia.
Incidence of prediabetes after the 8.2-year follow-up was 1657 (53.6%) cases. No association was found between TSH, TH, and fT3:fT4 ratio with the incidence of prediabetes (Supplementary Table S6). Analyses stratified by sex (Supplementary Table S7) showed no association.
Discussion
In this prospective study, 14.8% of participants euthyroid or with subclinical thyroid dysfunction, and without diabetes at baseline, developed diabetes over an 8.2-year follow-up. We did not confirm our hypothesis that the relationship of TSH and TH with incident diabetes presents a U-shaped curve (reference in the third quintile), but using fT4 and fT3:fT4 ratio as continuous variables, we found a slight inverse association for diabetes and an increased risk of diabetes with the increase in each unit of fT4 and the conversion ratio, respectively.
A sensitivity analysis performed among participants with overweight or obese showed an association of low fT4 levels (first quintile) with a modest incidence of diabetes; and low levels of fT3:fT4 ratio were associated with a modest inverse association for diabetes. Our results using continuous variables are in line with the findings in quintiles: each 1-U increase in fT4 was associated with a modest inverse association with the risk of diabetes, and a 1-U increase in the conversion ratio increases the risk of diabetes. Both results using quintiles and continuous variables highlight the effect of BMI on the association of TH with incident diabetes.
Our most important finding is the influence of BMI in the relationship between TH and incident diabetes observed when considering TSH, TH, and the conversion ratio examined as quintiles and as continuous variables. Obesity is a risk factor for diabetes associated with insulin resistance and impaired insulin secretion (29 –33). Thyroid functioning plays a key role in energy metabolism and weight balance. Thyroid dysfunction is associated with excess body fat, although this relationship is not fully understood (34 –36)—hypothyroidism is associated with increased body weight (29,36 –38), and weight loss seems to reduce TSH and fT3 (36,39,40). Due to the relationship of obesity with endocrine abnormalities, a stronger relationship between TH and incident diabetes among overweight/obese people looks reasonable (35,36,41,42), corroborating our findings.
Moreover, the weight gain may also change TH levels trying to increase energy expenditure, preventing more weight gain (36,41,43). Other mechanisms may be involved in the association between fT4 and diabetes beyond obesity. A recent study of Gu et al. (44) reported that low free TH levels within the reference range were significantly associated with high glucose levels and insulin resistance. Particularly, low-normal fT4 levels were associated with metabolic syndrome and insulin resistance (42,45). Moreover, low levels of TH were associated with a decrease in peripheral insulin sensitivity and glucose intolerance. These findings suggest that other mechanisms beyond overweight/obesity may explain the possible association of low fT4 and diabetes (46). We could assume that these mechanisms may overlap with the insulin resistance associated with overweight/obesity, which would help explaining our findings of low fT4 levels among those with weight excess.
The fT3:fT4 ratio reflects deiodinase activity. fT4 must be converted to fT3, which has a higher affinity to TH receptors and is considered the biologically active TH. Moreover, this peripheral process of conversion produces around 80% of T3 in the body. Thus, the fT3:fT4 ratio is very important in maintaining circulating T3 and offering it to tissues (47). Higher deiodinase activity with higher peripheral conversion of fT4 into fT3 was reported as a strategy to mitigate changes caused by weight gain (36,41,43).
Our analysis considering fT4 and the fT3:fT4 ratio as continuous variables presented complementary results compared to the analysis in quintiles. The use of TH as continuous variables increased our power to detect small, but significant linear associations among TH and risk of diabetes. In addition, the analysis presented in quintiles was used to explore whether the associations followed a nonlinear pattern (U-shape or J-shape), although quintile analyses alone cannot formally detect a statistically significant departure from nonlinearity.
Only one cross-sectional study has assessed fT3:fT4 ratio as a risk factor for incident diabetes (17), in 15,296 Chinese participants reporting a lower risk of diabetes at higher conversion rates, contrasting with our findings. Compensatory hormonal feedbacks in different moments related to the degree of obesity as well as differences in the population sample and study design may also contribute to these different findings.
Considering the association of high TSH levels with increased risk of diabetes (12,14,15) and the plausible pathophysiologic basis for the association of overactive (7 –11) and underactive thyroid function (3 –6) with diabetes, we hypothesized that our results would show a U-shaped curve for this hormone; however, we did not confirm it and found no association of TSH and diabetes incidence. A recent meta-analysis of 12 prospective studies found a J-shaped curve with high, but not low TSH levels being associated with an increased risk of diabetes (48), different from our results.
Taking into consideration all results together, an association between TSH levels and incident diabetes is very unlikely. Although TSH is very sensitive to TH variation, it has been recently proposed that serum TSH alone may not be the most reliable marker of thyroid function for other outcomes like cardiovascular disease. TH has shown a stronger association compared to TSH (49,50). This could be more outstanding in obese patients as higher and lower TH levels and increased peripheral conversion were observed in many studies (35,41,43,50), including ours.
Considering the entire study population, our results for TSH levels and their relationship with diabetes risk are different from other previous observational studies that showed positive (12,14 –16) or inverse associations (17). However, differing from them, in this analysis, we included not only euthyroid participants but also participants with subclinical thyroid dysfunction. Three studies reported an association of high-normal TSH levels and the risk of diabetes using the first quintile as the reference in euthyroid participants. A prospective study of 8452 participants found an association between high TSH levels and diabetes incidence (12).
A retrospective cohort in Korea (15) of 6235 individuals reported that the highest tertile of TSH was associated with an increased risk of incident diabetes compared to the first tertile. Another retrospective cohort of 17,061 subjects in Korea (14) reported that each increase of 1 μIU/mL in TSH levels was associated with a hazard ratio of 1.13 [CI 1.07–1.20] for increased risk of diabetes. On the other hand, our findings are in line with two other large prospective studies (13,15) that did not find any association of TSH levels with incident diabetes (13).
Our findings on TH are in line with other studies, but with the advantage of including subclinical thyroid dysfunction as well. The Korean study showed that the highest tertile of TH change was protective against diabetes during 25,692 person-years (15). Data from the Rotterdam study (12) for fT4 were similar to the Korean study and our findings.
Differences regarding study population and design across studies such as ethnicity in the samples of Asian (14 –17) and European (12,13), cross-sectional (16,17) or prospective design (12 –15), age strata (>60 years or not), and sex distributions of the samples (13 –17) may partially explain the discrepancies and the high degree of heterogeneity among results.
Our findings have some strengths. The large sample size, prospective design, and the availability of robust data with many variables that could be considered in the multivariable adjustment corroborated to study the intricate relationship between thyroid function and diabetes. We also included two different approaches considering TSH, TH, and the conversion rate both in quintiles (U-shape association) and as continuous variables obtaining complementary results. Besides, a highly admixed sample, including a large proportion of those characterizing themselves as being non-white, is another strength that differs our study from the previous ones performed with Europeans (12,13) and Asians (14 –17).
In addition, ELSA-Brasil data were collected under strict quality control and standardized protocols providing reliable estimates (51). Although having a slightly higher number of women, the sample includes a large number of men. The diagnosis of incident diabetes was very robust and based on different combinations of previous medical history, use of medication, oral glucose tolerance test, and HbA1c, although a second test to confirm diabetes was not done in each one of the visits. We have information on fT3 and fT3:fT4 ratio, which allowed us to have a more comprehensive evaluation of thyroid function. Although our results showed modest associations, the health impact may be higher than expected since the number of people with diabetes and obesity is rising worldwide, especially in low- and middle-income countries like Brazil (52 –54).
The analysis has also some limitations. TSH and TH were determined only once in each visit. These results did not include participants with overt thyroid diseases because of the high frequency of treatment, which limits the potential for detection of stronger associations. Another limitation is that some participants have the diagnosis of incident diabetes based only on metformin use, which may also be prescribed for prediabetes. It is also important to highlight that the main focus of the analysis is to explore TSH, TH, and fT3:fT4 ratio as risk factors for incident diabetes; hence, no conclusion about the use of fT3 or the fT3:fT4 ratio in the diagnosis or screening of diabetes in euthyroid or individuals with subclinical thyroid diseases can be inferred based solely on these findings.
Conclusion
Our findings showed a modest linear association with higher fT4 levels being protective for diabetes, while a high conversion rate is associated with increased risk of diabetes considering the entire sample. However, our most important result is a modest association of fT4 with incident diabetes and the low conversion rate being protective for diabetes in overweight and obese participants. These findings were also confirmed by an analysis considering TH and the conversion ratio as continuous variables. Thus, TH levels and the conversion rate might represent additional risk factors for incident diabetes, especially among the population with overweight and obese. The findings from this secondary analysis need to be confirmed in future studies.
Footnotes
Authors' Contributions
M.G.B.: conception and design of the work, analysis and interpretation of data, and article writing. B.A.P., C.C.P.S.J., A.C.G., I.S.S., P.F.S.T., J.A.S., S.M.B., B.B.D., and M.I.S.: interpretation of data and revising the article. P.A.L.: funding, data collection, revising and interpretation of data, and revising the article. I.M.B.: funding, data collection, conception and design of the work, interpretation of data, article writing, and final review.
Acknowledgments
The authors thank the ELSA-Brasil participants, staff, and collaborators.
Other
This study formed part of the doctoral thesis of MGB, presented at the Faculdade de Medicina da Universidade de São Paulo (FMUSP), São Paulo (SP), Brazil, in 2021.
Author Disclosure Statement
No competing financial interests exist.
Funding Information
The ELSA-Brasil baseline study and the 4-year follow-up was supported by the Brazilian Ministry of Health (Science and Technology Department) and the Brazilian Ministry of Science and Technology (Financiadora de Estudos e Projetos and CNPq National Research Council) (grants of baseline: 01 06 0010.00 RS, 01 06 0212.00 BA, 01 06 0300.00 ES, 01 06 0278.00 MG, 01 06 0115.00 SP, 01 06 0071.00 RJ; and grants of 4-year follow-up 01 10 0643-03 RS, 01 10 0742-00 BA, 01 12 0284-00 ES, 01 10 0746-00 MG, 01 10 0773-00 SP, and 01 11 0093-01 RJ); and by the FAPESP—Fundação de Amparo à Pesquisa do Estado de São Paulo (2015/17213-2). A.C.G., I.S.S., S.M.B., B.B.D., M.I.S., P.A.L., and I.M.B. are recipients of a scholarship of National Research Council (CNPq).
Supplementary Material
Supplementary Table S1
Supplementary Table S2
Supplementary Table S3
Supplementary Table S4
Supplementary Table S5
Supplementary Table S6
Supplementary Table S7