




Abstract
Background:
Thyroid cancer incidence has significantly increased in the United States over the past few decades. Recent studies have suggested a change in thyroid cancer incidence trends following 2013. The main objective of this study was to update the data on thyroid cancer incidence and mortality trends in the United States.
Methods:
Thyroid cancer incidence and incidence-based mortality trends were evaluated using the Surveillance, Epidemiology, and End Results-18 cancer registry. Cases of thyroid cancer diagnosed in 2000–2018 and thyroid cancer deaths during 2000–2018 were included. Annual percent change (APC) was calculated using joinpoint regression analysis.
Results:
Among 197,070 patients, female (75.6%) and white (81.0%) patients comprised the majority of cases. Papillary thyroid carcinoma (PTC) was the most common histology (89.1%). Incidence rates increased during 2000–2009 (APC 6.80, 95% confidence interval [CI 6.46 to 7.13]) and 2009–2014 (APC 2.58 [CI 1.71 to 3.47]) and then decreased during 2014–2018 (APC −2.33 [CI −3.15 to −1.51]). The incidence trends for PTC overall, localized disease, and tumors ≤1.0 cm mirrored the overall thyroid cancer trends, while incidence rates for regional disease stabilized during 2015–2018 (APC −1.65 [CI −4.09 to 0.84]). The incidence of distant disease decreased during 2015–2018 (APC −17.86 [CI −26.47 to −8.25]). The incidence of tumors ≤1.0 cm decreased (APC −5.83 [CI −7.24 to −4.40]), while the incidence of tumors 1.1–2.0 cm (APC −0.10 [CI −1.16 to 0.96]), 2.1–4.0 cm (APC 1.12 [CI −0.17 to 2.43]), and >4.0 cm (APC −1.13 [CI −4.58 to 2.45]) stabilized during the most recent 4–6 years. Incidence-based mortality increased throughout 2000–2018 (average APC 1.35 [CI 0.88 to 1.82]).
Conclusions:
Thyroid cancer incidence rates have declined since 2014. Similar declines are noted for PTC, localized disease, and tumors ≤1.0 cm, but not for tumors >2.0 cm. Incidence-based mortality rates continue to increase. These findings suggest that changing patterns in the management of thyroid nodules may have led to a decrease in diagnosis of small indolent tumors, but not more advanced tumors.
Introduction
Thyroid cancer incidence has significantly increased in the United States over the past few decades (1 –4). This has mostly been attributed to overdiagnosis of small indolent tumors (2,3,5 –7). However, several studies have also suggested an underlying true increase in thyroid cancer rates given the increase in rates of advanced-stage disease and increase in incidence-based mortality rates (4,8).
Recent studies have suggested a change in thyroid cancer incidence trends following 2013. Powers et al. reported a stabilization of thyroid cancer incidence between 2014 and 2016 (9). A follow-up study showed that incidence rates decreased during 2015–2017 (10). However, it is unclear if this observed decrease in incidence rates has remained durable. Furthermore, it is unclear if the recently observed downtrend is also applicable to large or advanced tumors, and whether there has been a corresponding change in the incidence-based mortality trend. Such information would provide important insights into the roles of changing care patterns versus true incidence change on the observed incidence trends.
The objectives of this study were to update the data on thyroid cancer incidence and mortality trends in the United States, to assess whether incidence trends varied by histology and extent of disease, and to determine whether the observed downtrend in thyroid cancer incidence rates has resulted in a corresponding downtrend in incidence-based mortality.
Materials and Methods
This study was considered nonhuman subject research by the Stanford University Institutional Review Board because it utilized de-identified data. Incidence data were obtained from the Surveillance, Epidemiology, and End Results (SEER)-18 incidence and population data sets of the National Cancer Institute. The data set includes information from 18 high-quality population-based registries (Connecticut, Detroit, Hawaii, Iowa, New Mexico, San Francisco-Oakland, Utah, Seattle-Puget Sound, Atlanta, Los Angeles, San Jose-Monterey, Rural Georgia, the Alaska Native Tumor Registry, Greater California, Kentucky, Louisiana, New Jersey, and Greater Georgia) that includes ∼28% of the U.S. population (11).
The data set includes incidence data for the years 2000 through 2018. Age-adjusted incidence rates of thyroid cancer were calculated for the years 2000 through 2018. Age-adjusted incidence-based mortality rates of thyroid cancer were obtained from the SEER-9 database and calculated for deaths that occurred between 2000 and 2018. Analysis was limited to deaths that occurred between 2000 and 2018 among cases diagnosed between 1975 and 2018 to minimize underestimation of the mortality rates in the early years (4,12).
Thyroid cancer cases diagnosed between 2000 and 2018 were identified by the International Classification of Diseases for Oncology (ICD-O), Third Edition; topography code C73. The following histological subtypes were included: papillary thyroid carcinoma (PTC) (ICD-O histology codes: 8050, 8260, 8340–8344, 8350, 8450–8460), follicular/Hurthle cell thyroid carcinoma (ICD-O histology codes: 8290, 8330–8335), medullary thyroid carcinoma (ICD-O histology codes: 8345, 8510–8513), anaplastic thyroid carcinoma (ICD-O histology codes: 8020–8035), and insular thyroid carcinoma (ICD-O histology code: 8337). Stage was assessed by SEER Summary Stage: localized, regional, and distant.
Tumor size was obtained from the following extent of disease codes based on year of diagnosis: Extent of Disease-4 codes for cases diagnosed in 1983–1987, Extent of Disease-10 codes for cases diagnosed in 1988–2003, Collaborative Staging codes for cases diagnosed in 2004–2015, and Tumor Size Summary for cases diagnosed in 2016 and later. These codes were combined to categorize tumor size as ≤1.0, 1.1–2.0, 2.1–4.0, and >4.0 cm. Demographic characteristics, including sex, race, and age at diagnosis, were extracted from the SEER database. Race was recorded as “White,” “Black,” “American Indian/Alaskan Native,” “Asian/Pacific Islander,” or “Unknown.”
Incidence rates were calculated using SEER*Stat version 8.3.9 (National Cancer Institute, Bethesda, MD; Information Management Services, Inc., Calverton, MD). The first matching record was selected for each case. We excluded cases identified only from autopsy records or death certificates and included only microscopically confirmed cases. All rates were age adjusted to the 2000 U.S. standard population. Annual percentage change (APC) and 95% confidence intervals [CIs] were calculated using Joinpoint Regression Program version 4.9.0.0 (National Cancer Institute). T-tests were used to determine whether APCs were statistically significantly different from zero. Joinpoints (calendar years when APCs changed significantly) were identified by selecting the best-fitting log-linear regression model (13). An estimate was considered statistically significant at α = 0.05.
Results
There were 197,070 cases of thyroid cancer among residents of the SEER-18 areas for the years 2000 to 2018. Majority of cases were female patients (75.6%) and white patients (81.0%) (Table 1). PTC was the most common histology (89.1%).
Demographic Characteristics and Incidence Rates of Thyroid Cancer (2000–2018)
Incidence data were obtained from the SEER-18 database.
CI, 95% confidence interval; SEER, Surveillance, Epidemiology, and End Results.
The overall thyroid cancer incidence for 2000 to 2018 was 11.95 [CI 11.89 to 12.00] per 100,000 person-years. The incidence of thyroid cancer increased from 7.25 [CI 7.06 to 7.45] per 100,000 person-years in 2000 to 14.53 [CI 14.28 to 14.78] per 100,000 person-years in 2014 and then decreased to 13.48 [CI 13.24 to 13.72] per 100,000 person-years in 2018.
Incidence trends are shown in Table 2. Thyroid cancer incidence increased during 2000–2009 (APC 6.80 [CI 6.46 to 7.13]), continued to increase, but at a slower rate, during 2009–2014 (APC 2.58 [CI 1.71 to 3.47]), and then decreased during 2014–2018 (APC −2.33 [CI −3.15 to −1.51]) (Fig. 1A). The incidence trends stratified by histology are also shown in Table 2 and Figure 1B. The incidence trends for PTC mirrored the trends for thyroid cancer overall. The incidence of PTC increased during 2000–2009 (APC 7.44 [CI 7.00 to 7.88]), continued to increase, but at a slower rate, during 2009–2014 (APC 3.14 [CI 2.01 to 4.29]), and then decreased during 2014–2018 (APC −2.57 [CI −3.62 to −1.51]).

Thyroid cancer incidence and incidence-based mortality trends: (
Thyroid Cancer Incidence Trends
Incidence data were obtained from the SEER-18 database.
APC was not calculated because 0 cases occurred in one or more years.
APC, annual percent change; PTC, papillary thyroid carcinoma.
The incidence of follicular/Hurthle cell carcinoma (FTC) remained stable during 2000–2002 (APC −0.97 [CI −2.57 to 0.66]), increased during 2002–2005 (APC 6.97 [CI 5.37 to 8.60]), remained stable during 2005–2009 (APC 0.29 [CI −0.50 to 1.09]), decreased during 2009–2013 (APC −4.12 [CI −4.82 to −3.42]), slightly increased during 2013–2016 (APC 1.56 [CI 0.01 to 3.14]), and then decreased during 2016–2018 (APC −4.89 [CI −6.44 to −3.33]). The incidence of medullary (APC 1.69 [CI 0.50 to 2.90]) and anaplastic (APC 1.99 [CI 1.20 to 2.77]) carcinoma increased during 2000–2018 without any joinpoints.
The incidence trends stratified by stage and tumor size were analyzed for PTC and are shown in Table 2 and Figure 2. The incidence trends for localized disease mirrored the trends for PTC overall (Fig. 2A). The incidence of localized disease increased during 2000–2009 (APC 7.46 [CI 6.80 to 8.13]), continued to increase, but at a slower rate, during 2009–2014 (APC 2.51 [CI 0.77 to 4.28]), and then decreased during 2014–2018 (APC −3.51 [CI −5.08 to −1.91]). The incidence of regional disease increased during 2000–2003 (APC 4.89 [CI 0.59 to 9.37]), increased at a higher rate during 2003–2009 (APC 9.99 [CI 8.44 to 11.56]), increased at a more gradual rate during 2009–2015 (APC 3.90 [CI 2.71 to 5.10]), and then had a nonsignificant decrease during 2015–2018 (APC −1.65 [CI −4.09 to 0.84]). The incidence of distant disease remained stable during 2000–2015 (APC 0.47 [CI −0.44 to 1.39]) and then decreased during 2015–2018 (APC −17.86 [CI −26.47 to −8.25]).
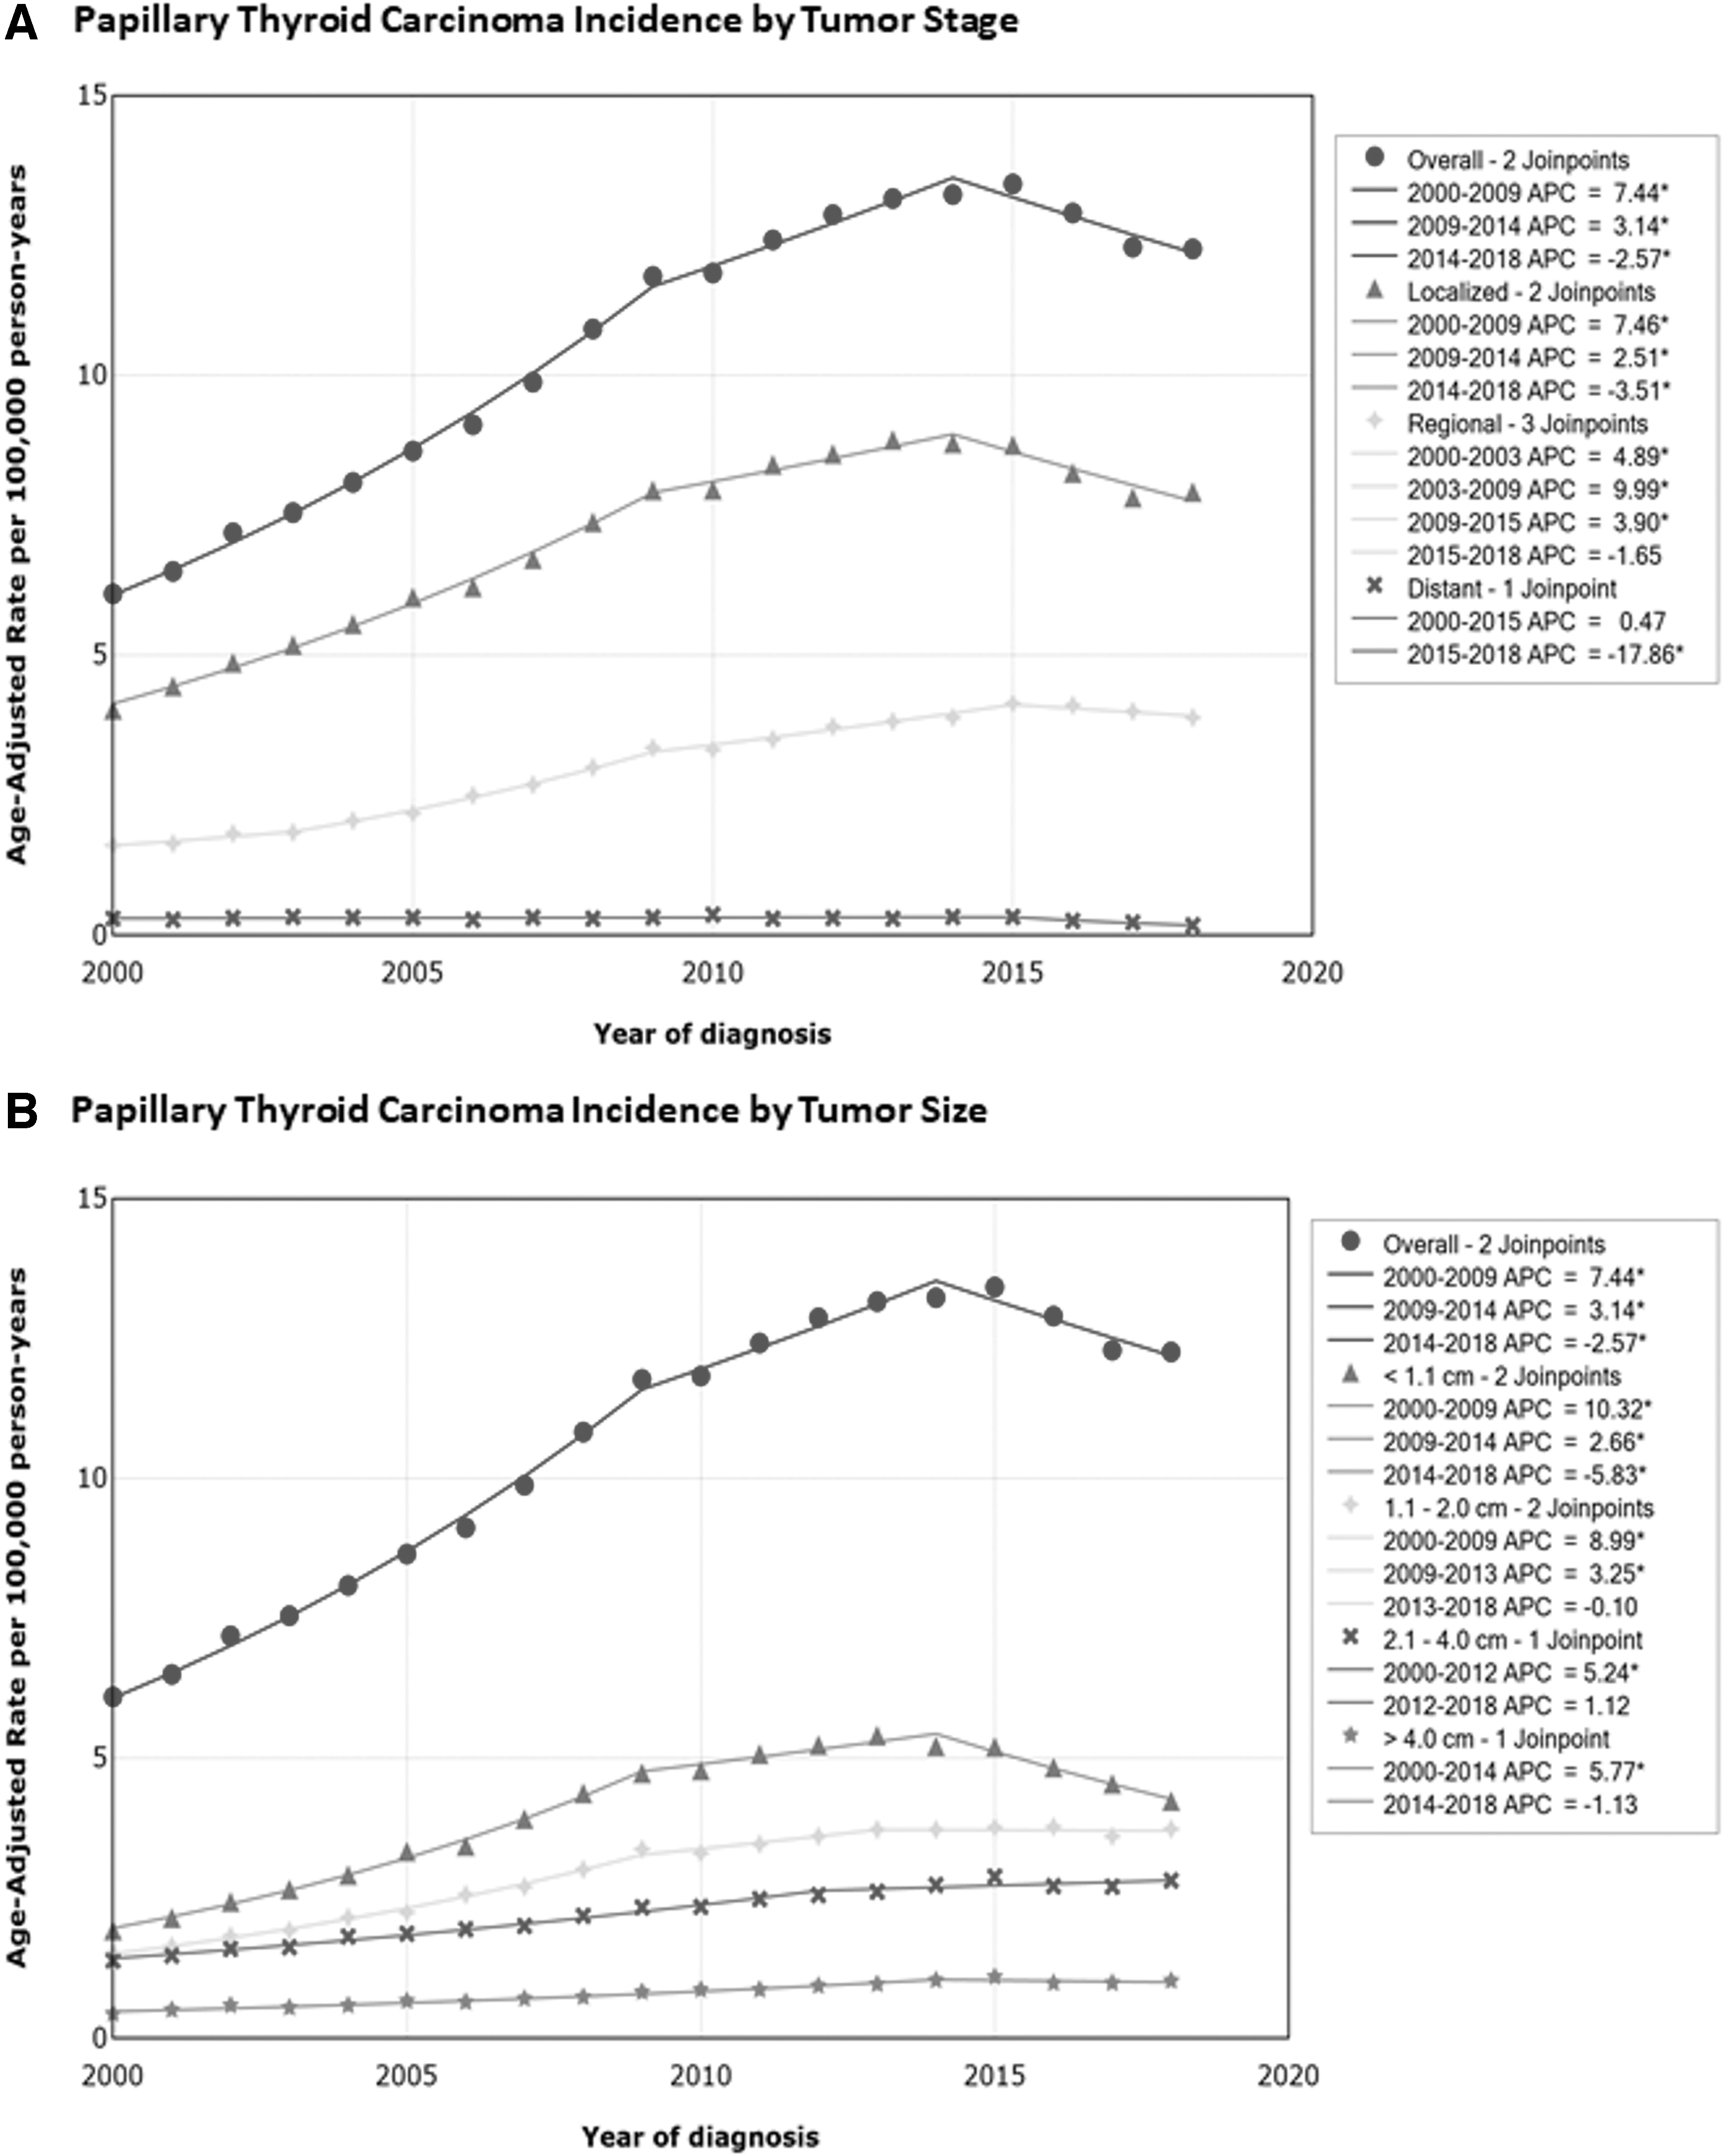
Papillary thyroid carcinoma incidence trends by extent of disease: (
The incidence of tumors ≤1.0 cm increased during 2000–2009 (APC 10.32 [CI 9.70 to 10.95]), continued to increase, but at a slower rate, during 2009–2014 (APC 2.66 [CI 1.22 to 4.11]), and then decreased during 2014–2018 (APC −5.83 [CI −7.24 to −4.40]) (Fig. 2B). The incidence of tumors 1.1–2.0 cm increased during 2000–2009 (APC 8.99 [CI 8.34 to 9.64]), increased at a slower rate during 2009–2013 (APC 3.25 [CI 0.84 to 5.71]), and then stabilized during 2013–2018 (APC −0.10 [CI −1.16 to 0.96]). The incidence of tumors 2.1–4.0 cm increased during 2000–2012 (APC 5.24 [CI 4.72 to 5.76]) and then had a nonsignificant increase during 2012–2018 (APC 1.12 [CI −0.17 to 2.43]). The incidence of tumors >4.0 cm increased during 2000–2014 (APC 5.77 [CI 5.06 to 6.48]) and then stabilized during 2014–2018 (APC −1.13 [CI −4.58 to 2.45]).
There were 2471 thyroid cancer deaths. The thyroid cancer incidence-based mortality rate for 2000 to 2018 was 0.43 [CI 0.42 to 0.45] per 100,000 person-years. The incidence-based mortality increased from 0.42 [CI 0.34 to 0.51] per 100,000 person-years in 2000 to 0.50 [CI 0.43 to 0.58] per 100,000 person-years in 2018 (APC 1.35 [CI 0.88 to 1.82]). The incidence-based mortality trends are shown in Table 3 and Figure 1A. All analyses had one trend with no joinpoints. Mortality increased for males (APC 1.55 [CI 0.47 to 2.66]) and females (APC 1.21 [CI 0.66 to 1.77]).
Thyroid Cancer Incidence-Based Mortality Trends
Incidence-based mortality data were obtained from the SEER-9 database. The incidence-based mortality trends had no joinpoints.
APC was not calculated because 0 deaths occurred in one or more years.
Mortality increased for PTC (APC 2.17 [CI 1.22 to 3.12]) and anaplastic carcinoma (APC 1.72 [CI 0.14 to 3.33]), but not FTC or medullary carcinoma. Analysis of mortality by extent of disease was performed for PTC. Mortality for distant disease increased (APC 4.95 [CI 3.06 to 6.88]). Mortality increased for tumors 2.1–4.0 cm (APC 3.65 [CI 1.41 to 5.93]) and tumors >4.0 cm (APC 4.29 [CI 1.54 to 7.12]), but not for tumors 1.1–2.0 cm. APCs could not be calculated for tumors ≤1.0 cm and for localized or regional disease because 0 deaths occurred in one or more years for those groups.
Discussion
Our study showed that thyroid cancer incidence rates in the United States increased during the years 2000–2014, but declined during 2014–2018. The incidence trends for PTC mirrored the trends for thyroid cancer overall, while the incidence trends for FTC remained relatively stable over time with several minor uptrends and downtrends. The incidence trends for localized disease also mirrored the trends for PTC overall. The incidence of regional disease increased during 2000–2015 and then had a nonsignificant decrease during 2015–2018.
In contrast, the incidence of distant disease remained stable during 2000–2015 and then decreased during 2015–2018. The incidence trends for tumors ≤1.0 cm also mirrored the trends for PTC overall. The incidence of tumors 1.1–2.0 cm showed a similar trend as tumors ≤1.0 cm, except for stabilization of the incidence rates during 2013–2018. In contrast, the incidence of tumors 2.1–4.0 cm and tumors >4.0 cm initially increased and then stabilized during the last 4–6 years. Mortality due to thyroid cancer increased throughout years 2000–2018, particularly for PTC >2 cm.
These findings are very important given that numerous studies have previously documented an alarming rise in the incidence of thyroid cancer in the United States over the past several decades (1 –4). Work by Davies and Welch first brought widespread attention to the rising incidence of thyroid cancer in the United States (2). Using the SEER database, they found that the incidence of thyroid cancer increased from 3.6 per 100,000 in 1973 to 8.7 per 100,000 in 2002. The authors proposed that increasing incidence reflected increased detection of subclinical disease.
Subsequent studies confirmed the continued rise in thyroid cancer incidence (3,4,8). Lim et al. examined thyroid cancer incidence and mortality trends in the United States between 1974 and 2013, using the SEER-9 database (4). They found that the incidence increased from 4.56 per 100, 000 person-years in 1974–1977 to 14.42 per 100,000 person-years in 2010–2013. However, further examination of their joinpoint regression plots reveals a nonsignificant increase in incidence between 2009 and 2013, indicating stabilization of the incidence rates.
Several studies have since suggested a change in thyroid cancer incidence trends following 2013. Powers et al. examined thyroid cancer incidence trends in the United States between 1992 and 2016, using the SEER-13 database (9). They found that, following persistent increase between 1992 and 2014, incidence remained stable between 2014 and 2016. In a follow-up study, Lee et al. examined thyroid cancer incidence trends in the United States between 2000 and 2017, using the SEER-18 database (10). Similar to our study, they found that the incidence decreased during 2015–2017. Our study updates these findings to include cases diagnosed in 2018 and confirms the continued decline in thyroid cancer incidence rates. The addition of 2018 cases slightly altered the incidence trend previously reported by Lee et al., showing the joinpoint at 2014 rather than 2015.
Similar to our study, Lee et al. also noted a decrease in tumors ≤1.0 cm. However, contrary to our study, they found that incidence rates of tumors >1 cm remained stable during 2015–2017. This discrepancy is due to the fact that they grouped all tumors >1 cm together, precluding further analysis of variation of incidence trends by size for these tumors. Our study showed that the incidence of tumors 1.1–2.0 cm had a similar trend to tumors ≤1.0 cm, except for stabilization of the incidence rates during 2014–2018. In addition, the incidence of tumors 2.1–4.0 cm and tumors >4.0 cm initially increased and then stabilized during the last 4–6 years. Our study also examined the incidence trends by disease stage and found that the incidence of localized disease decreased during 2014–2018, mirroring the trends for thyroid cancer overall. In contrast, the incidence of regional disease remained stable, while the incidence of distant disease declined during 2015–2018.
The reason for the recent decline in thyroid cancer incidence is currently unknown. However, it is likely that changes in practice patterns have contributed to the recent decline. Many authors have attributed the increase in thyroid cancer incidence to overdiagnosis of small incidentally discovered tumors, due increase in use of imaging studies, and higher rates of fine-needle aspiration biopsies for small thyroid nodules (2,3,5 –7). In response, recent guidelines for management of thyroid nodules and thyroid cancer have become increasingly more conservative (14,15). The more conservative approach to the management of thyroid nodules may have contributed to decreased diagnosis of small indolent tumors.
Pereira et al. sought to examine whether changes in thyroid incidence rates were associated with changes in clinical practice guidelines using the SEER-9 database (16). The authors observed that the significant increase in thyroid cancer incidence during 1998–2009 coincided with the publication of the first American Thyroid Association (ATA) guidelines for the treatment of thyroid nodules and well-differentiated thyroid cancer, which endorsed ultrasound and fine-needle aspiration biopsy for the evaluation of thyroid nodules (17). They also noted that the deceleration in the rate of increase of incidence during 2009–2014 coincided with the publication of the 2009 ATA guidelines, which established size thresholds for biopsy, and discouraged biopsy for nodules <1 cm (14).
The 2015 ATA guidelines recommended higher size thresholds for biopsy of nodules that did not have suspicious features on ultrasound (15), which may have led to a decrease in the diagnosis of smaller indolent tumors. It is unclear if the 2015 ATA guidelines were directly responsible for the recent decline in thyroid cancer incidence rates, given that our joinpoint regression indicates that the decline began in 2014, one year before the development of the 2015 ATA guidelines. However, direct observation of the annual incidence rates indicates that the highest incidence occurred in 2015. Since the most recent ATA guidelines were published in early 2016, this could have influenced the decline in thyroid cancer incidence rates, which began in 2016.
Furthermore, it is likely that the international debate over thyroid cancer leading up to the 2015 ATA guidelines may have influenced shifts in attitude and practice before 2015. The recently established American College of Radiology Thyroid Imaging Reporting and Data System (TI-RADS) (18), which discourages biopsy of low risk nodules, may have also influenced the declining trends. Finally, the reclassification of encapsulated follicular variant of PTC into noninvasive follicular thyroid neoplasm with papillary-like nuclear features by the Endocrine Pathology Society working group in 2015 (19), probably played a role in the declining thyroid cancer trends. This change in nomenclature led to the reclassification of ∼10–20% of thyroid tumors that were previously considered to be malignant into benign tumors (19).
While the rising incidence of thyroid cancer has traditionally been attributed to overdiagnosis, several studies have suggested an underlying true increase in thyroid cancer rates given the increase in rates of advanced-stage disease and increase in incidence-based mortality (4,8). Our findings suggest that a combination of enhanced diagnoses and actual increase in thyroid cancer incidence is responsible for the observed trends. Despite the decline in overall incidence and rates of tumors ≤1.0 cm during 2014–2018, the incidence of tumors 2.1–4.0 cm and tumors >4.0 cm remained stable during those years. Furthermore, mortality due to thyroid cancer continued to increase, particularly for PTC >2 cm and for distant disease. These findings suggest that changes in practice patterns may have mitigated the overdiagnosis of small indolent tumors but have not affected the incidence of more advanced tumors.
Our study has several strengths. Utilizing the SEER database allows us to analyze a large and diverse population that is representative of the U.S. population. We utilized the SEER-18 database for incidence analysis because it is more generalizable to the U.S. population (covers ∼28% of the U.S. population), in contrast to SEER-9, which covers ∼9% of the U.S. population (11). We utilized the SEER-9 database for mortality analysis to capture deaths from cases diagnosed before 2000, and thereby avoid underestimation of the mortality rates in the earlier years.
The second major strength of this study is the utilization of joinpoint regression analysis to account for variation in trends over time rather than assuming a constant trend throughout the observation period (20). This study has several limitations. Given the descriptive nature of this study, we can only speculate on the potential reasons for the observed incidence trends. Finally, the SEER incidence data set does not provide granular clinical information such as how tumors were initially detected (clinically apparent vs. incidental), and the diagnostic workup that was performed. Consequently, we cannot definitively determine the etiology of the recent decrease in incidence rates observed.
Conclusions
Recent thyroid cancer incidence trends show a decline in thyroid cancer incidence since 2014. Similar declines are noted for PTC, localized disease, and tumors ≤1.0 cm. These findings suggest that the recent decline in incidence is due to a reversal in overdiagnosis of small indolent tumor, probably driven by changing patterns in the management of thyroid nodules. In contrast, the increasing thyroid cancer incidence-based mortality suggests an underlying true increase in thyroid cancer incidence that is not completely accounted for by overdiagnosis of small indolent tumors. Future studies are needed to determine the causes of the current downtrend in thyroid cancer incidence rates and to monitor the future trajectory of thyroid cancer incidence trends to confirm the durability of the observed downtrend.
Footnotes
Authors' Contributions
U.C.M.: Conceptualization; formal analysis; investigation; methodology; project administration; resources; supervision; validation; visualization; writing—original draft. P.K.M.: Data curation; formal analysis; investigation; methodology; validation; visualization; writing—review and editing.
Author Disclosure Statement
No competing financial interests exist.
Funding Information
No funding was received for this article.