




Abstract
Background:
Metabolic disorders (MDs) and the metabolic syndrome (MetS) may be associated with thyroid diseases. The aim of this study was to investigate the relationship between MDs and various types of thyroid nodules (TNs), according to gender.
Methods:
We analyzed cross-sectional data from the Thyroid Disorders, Iodine Status, and Diabetes Epidemiological (TIDE) survey in China. A total of 56,729 subjects ≥18 years of age were included. Thyroid gland morphology was assessed by thyroid standardized ultrasonography. A multivariate logistic regression model was used to explore the odds ratio (OR) and confidence intervals [CIs] for any associations between MDs and TNs. Subgroup analyses were conducted according to gender and TN type (solitary, S-TN; multiple, M-TNs).
Results:
The prevalence of TNs was increased in several MDs, and was higher in women than men regardless of whether they suffered from MDs (22.0%, CI [21.6–22.5%] vs. 15.7%, CI [15.3–16.7%], p < 0.001). TNs were associated with the presence of MDs (OR = 1.189, CI [1.107–1.278], p < 0.001), hypercholesterolemia (OR = 1.235, CI [1.177–1.296], p < 0.001), high low-density lipoprotein cholesterol (LDL-C; OR = 1.249, CI [1.186–1.316], p < 0.001), and hyperuricemia (OR = 1.206, CI [1.126–1.293], p < 0.001). MDs and MetS were, respectively, significantly associated with TNs, S-TNs, and M-TNs in men, while MDs were significantly associated with the three TN profiles in women. With respect to dyslipidemia, hypercholesterolemia and high LDL-C had the strongest association with TNs, whereas hypertriglyceridemia had no effect.
Conclusions:
TNs (especially M-TNs) may be associated with MDs and their various components, and there appear to be some gender-specific associations.
Introduction
Metabolic disorders (MDs), including metabolic syndrome (MetS), obesity (especially central obesity), hypertension (HBP), hyperglycemia, dyslipidemia, and hyperuricemia (HUA), are risk factors for cardiovascular diseases and type 2 diabetes mellitus (T2DM). These hidden risks have become serious health issues worldwide (1). Data from the American National Center for Chronic Disease Prevention and Health Promotion revealed that body mass index (BMI) is increasing by 0.37% per year while waist circumference is increasing by 0.37% and 0.27% per year in men and women, respectively. Besides, 30.2 million adults, accounting for ∼12.2% of the adult population, suffer from T2DM. The incidence of T2DM increases with age and is present in 25.2% of the aging population (65 years or older). According to the Thyroid Disorders, Iodine Status, and Diabetes Epidemiological (TIDE) survey in China, the prevalence of MetS in the Chinese adult population is 18.18% (23.35% in men; 13.38% in women). MDs also exist in at least one-third of the population in the United States (2) and one-fifth of the Chinese population.
Thyroid nodules (TNs) are defined as discrete lesions within the thyroid gland. They are radiologically distinct from the surrounding thyroid parenchyma (3) and can be solitary, multiple, cystic, or solid (4). TNs can be detected in 5–7% of the adult population by physical examination alone. However, autopsy data have revealed the presence of TNs (>1 cm) in ∼50% of the population who had not been diagnosed with thyroid disease before death (5). High-resolution inspection technology could reveal a higher occurrence of TNs.
In recent years, several studies have found that MDs are associated with TNs (6 –8). An increased number of adipocytes may lead to increased levels of leptin, chronic inflammation, and increased secretion of the cytokines, interleukin-6 and tumor necrosis factor, which may promote the occurrence of TNs (9). In China, TNs are highly prevalent in men and are associated with lower sex hormone-binding globulin levels (10). However, associations among MDs and TNs (especially solitary TN [S-TN], and multiple TNs [M-TNs]) and gender are still unclear.
The TIDE survey is a national epidemiological cross-sectional study, which was conducted between 2015 and 2017, and included all 31 provinces of mainland China. In this study, we used the data obtained from the TIDE survey. We aimed to investigate the relationship among various MDs and TNs (included S-TN and M-TNs) and explore for potential gender-specific differences.
Methods
Subjects
This study was based on a representative sample population from a Chinese epidemiological survey conducted in 31 provinces, using a whole cluster, stratified random sampling design. The detailed sampling and survey methods have been described in Supplementary Methods in Supplementary Data and previous studies (11). Briefly, the ratios of age, gender, and urban and rural populations in each region were determined based on data from the 2010 China census. The inclusion criteria were as follows: age ≥18 years; having resided locally for at least 5 years; no iodine-containing drugs or contrast agents within 3 months of participation; and women without pregnancy. A total of 80,937 people participated in the project and completed the survey. Each participant provided written informed consent before data collection. The Ethics Committee of the China Medical University approved this study's protocol.
To investigate the relationship between MDs and TNs, the following exclusion criteria were applied: missing demographic or metabolism information; abnormal thyroid function measurements or self-reported thyroid diseases; and the presence or history of severe chronic wasting diseases (malignant cancer, chronic hepatitis, systemic lupus erythematosus, and tuberculosis). In total, the data from 56,729 adults were included for analysis. The flowchart of patient inclusion is shown in Figure 1.
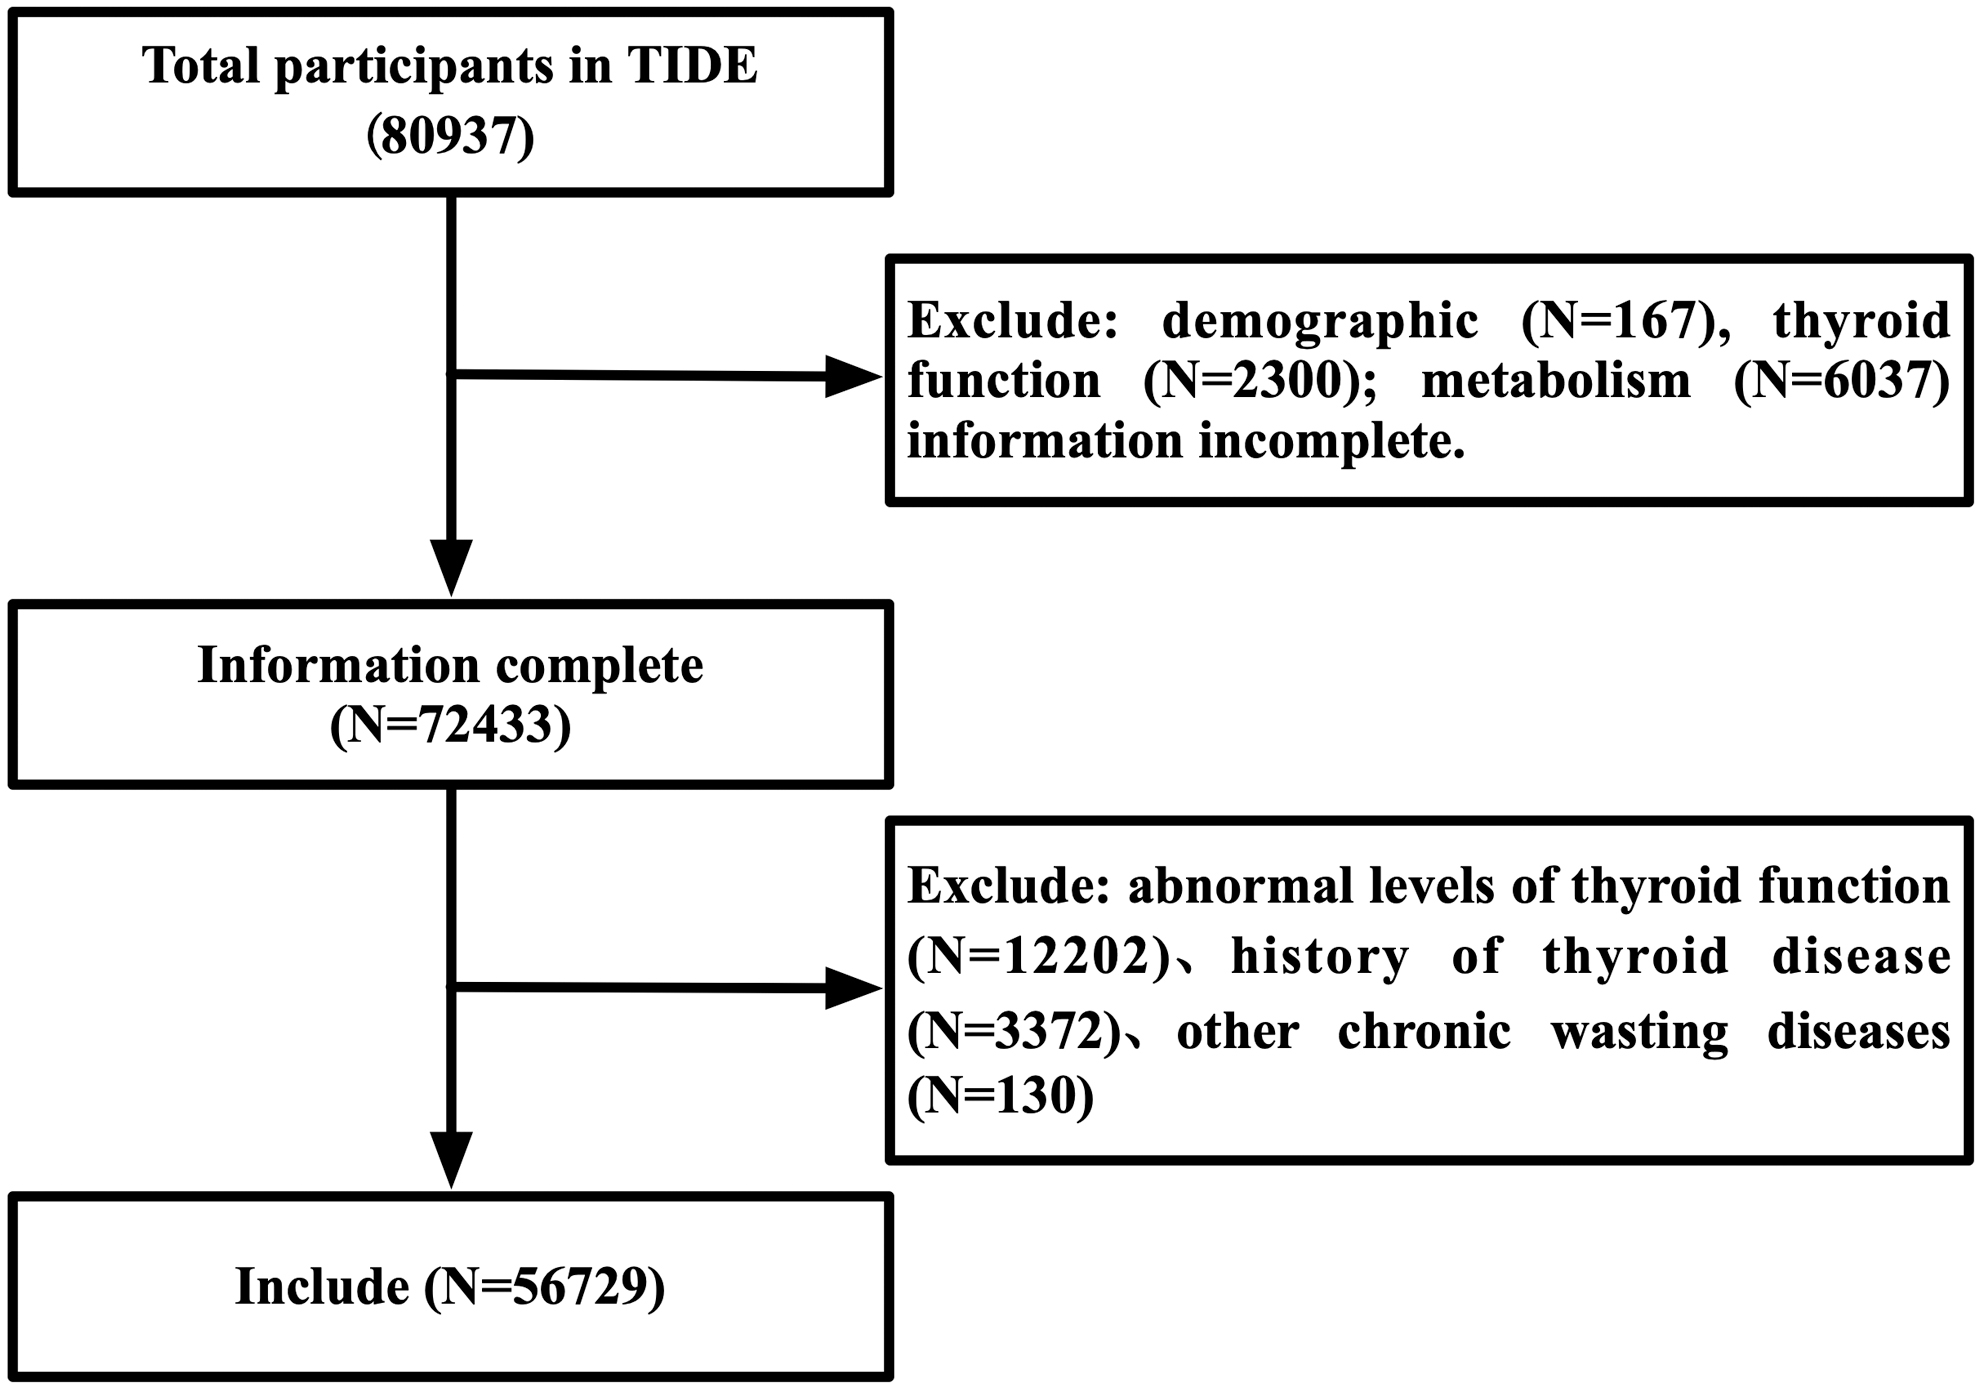
Screening flowchart. TIDE, Thyroid Disorders, Iodine Status, and Diabetes Epidemiological, a national epidemiological cross-sectional study.
Demographic and anthropometric assessment
As previously described (11), a standardized questionnaire survey was administered by professionally trained nurses to collect the demographic information, such as regional location, lifestyle habits, and medical history. Measurements of blood pressure, waist circumference, height, and weight have been previously described in the TIDE study (12).
Laboratory tests
The sampling method and detection method of the metabolic parameters were the same as in our previous study (13,14), including fasting plasma glucose, lipid profile, glycosylated hemoglobin, thyroid function, 2-hour oral glucose tolerance test, uric acid (UA), and urinary iodine concentration (UIC).
Thyroid ultrasonography
Ultrasonography of the thyroid was performed by specially trained technicians using a GE Logiq a100 with a 7.5 MHz linear array transducer. Two trained quality control personnel beyond the sonographers were responsible for supervising the accuracy and reliability of the ultrasound results.
Clinical diagnosis
The reference interval of each serum thyroid parameter was as follows: TSH (thyrotropin) 0.27–4.2 mIU/L; TPOAb <34.0 IU/mL; and TgAb <115.0 IU/mL. If the subject's TSH met the criteria, euthyroid was diagnosed. Otherwise, the subject was excluded.
TNs were defined as discrete lesions within the thyroid gland that were radiologically distinct from the surrounding thyroid parenchyma. S-TN: a solitary nodule exceeding 5 mm in diameter, thyroid volume within the normal range; M-TNs:,≥two nodules exceeding 5 mm in diameter, thyroid volume within the normal range; and normal thyroid: normal echo pattern without goiter or nodules.
The diagnostic criteria of MDs are described in Supplementary Table S1.
Statistical analyses
All statistical analyses were performed using SPSS version 26.0 (IBM). Continuous variables are described as the means and standard deviations and simple sample t-tests were applied to compare the differences between groups. Categorical variables are described in the form of the number of cases (percentage), and the χ2 test was used for comparison between groups. When there was a statistical difference between groups, the χ2 test was used for pairwise comparison, and the p-value of the pairwise comparison corrected by the Bonferroni method. Multivariate logistic regression models were adjusted for age, gender, education, province, location, profession, yearly family income, ethnicity, iodized-salt intake, family history, smoking status, BMI, TPOAb, TgAb, and UIC. The observed associations were expressed as odds ratio (OR) and confidence intervals [CIs]. A p-value of <0.05 was considered statistically significant.
Results
Population characteristics
Table 1 summarizes the general characteristics of the participants with and without MDs and TNs. Within the total population, the prevalence of MDs and TNs was 80.1% (45,462/56,729 [CI 79.8–80.5%]) and 18.7% (10,630/56,729 [CI 18.4–19.1%]), respectively. TNs were prevalent at a higher frequency in women (5988/27,160, 22.0% CI [21.6–22.5%]), whereas MDs were more prevalent in men (24,963/29,569, 84.4% CI [84.0–84.8%]). People over the age of 50 years were more likely to suffer from TNs, with the highest prevalence of TNs occurring in people 50–59 years of age (2396/10,630, 22.5%). People over the age of 40 were more likely to suffer from MDs, with the highest prevalence of MDs observed in people 40–49 years of age (10,806/45,462, 23.8%). The questionnaire revealed that subjects who live in urban areas were more likely with TNs (5944/10,630, 55.9%), whereas subjects who live in rural areas were more likely with MDs (22,110/45,462, 48.6%). Subjects with TNs or MDs were less educated (8024/10,630, 76.1%; 31,794/45,462, 70.3%), and more likely to have a low family income (7330/10,630, 70,1%; 30,286/45,462, 67.5%).
General Characteristics of Subjects with Thyroid Nodules and Metabolic Disorders
Some values were missing in the total population: 332 for UIC. The term worker refers to a person who works part-time in a factory or enterprise. Smoking refers to subjects who were either former or current smokers.
BMI, body mass index; UIC, urinary iodine concentration.
In addition, subjects who have no iodized salt intake were more likely to suffer from TNs and MDs (579/10,630, 5.5%; 2041/45,462, 4.5%). Subjects with Han ethnicity had a higher prevalence of MDs (40,876/45,462, 89.9%), whereas other ethnicities had a higher prevalence of TNs (1409/10,630, 13.3%). Subjects who like to smoke (13,930/45,462, 30.7%) and have a family history of diabetes (7135/45,462, 15.7%) were more likely to have MDs, whereas subjects who like to smoke were less likely with TNs (2630/10,630, 24.8%). The prevalence of TNs or MDs was highest when the BMI ranged from 18.5 to 25.0 kg/m2 (5706/10,630, 53.7%; 24,247/45,462, 53.3%). However, subjects with a BMI over 25.0 kg/m2 were more likely to suffer from TNs or MD (25.0–30.0 kg/m2: 3751/10,630 [35.3%], 16,186/45,462 [35.6%]; >30.0 kg/m2: 821/10,630 [7.7%], 3470/45,462 [7.6%]). In subgroup analyses according to gender, most of the results were consistent with the findings described above (location, education, family income, iodized salt intake), with the exception of some indicators that showed gender difference.
Men over the age of 50 and women over the age of 40 years were more likely to suffer from TNs, with the highest prevalence of TNs occurring in both men and women 50–59 years of age (1025/4642, 22.1%; 1371/5988, 22.9%). Men over the age of 30 and women over the age of 40 years were more likely to suffer from MDs, with the highest prevalence of MDs observed in both men and women 40–49 years of age (5894/24,963, 23.6%; 4912/20,499, 24.0%). The results of ethnicity in men were the same as the total. However, subjects with MDs in women had no difference with different ethnicities (p = 0.112). Subjects with TNs in men had no difference in whether a smoker's group (p = 0.821), and women who like to smoke were more likely with TNs or MDs (223/5988, 3.7%; 694/20,499, 3.4%). Subjects who have family history of diabetes in men were more likely with TNs (730/4642, 15.7%) and MDs (3852/24,963, 15.5%), but had no difference in women (p = 0.640, p = 0.356) (Supplementary Table S2).
TN prevalence in subjects with different profiles of MDs
As indicated in Figure 2, the prevalence of TNs was, in general, higher in both MD and MetS patients (9359/45,462, 20.6% and 4057/16,308, 24.9%, both with p < 0.001). However, the prevalence of TNs in HUA patients was comparable to subjects with normal serum UA (1447/7778, 18.6% vs. 9183/48,951 18.7%, p = 0.744). Except for HUA, patients with other MD components had a higher prevalence of TNs (central obesity, 23.9% vs. 16.1%; diabetes, 29.2% vs. 17.5%; prediabetes, 21.6% vs. 14.8%; impaired fasting glucose [IFG], 19.6% vs. 14.8%; impaired glucose tolerance [IGT], 24.8% vs. 14.8%; high triglyceride [TG], 20.2% vs. 18.1%; high total cholesterol [TC], 25.0% vs. 16.3%; high low-density lipoprotein cholesterol [LDL-C], 25.2% vs. 17.0%; low high-density lipoprotein cholesterol [HDL-C], 19.5% vs. 18.6%; HBP, 25.6% vs. 15.8%).

The prevalence of TNs (including solitary and multiple) based on metabolic disorders and their component diseases.
In addition, referring to the number of nodules, we divided the TN patients into S-TN and M-TNs. We found that the number of nodules might also be related to metabolic abnormalities. Overall, whether it is M-TNs or S-TN, the prevalence in MD and MetS groups were higher than that in no-MD and no-MetS groups (M-TNs in MD: 8.8% vs. 3.8%; M-TNs in MetS: 8.6% vs. 6.4%; S-TN in MD: 11.8% vs. 7.4%; S-TN in MetS: 13.6% vs. 9.9%). If the various abnormal metabolic components were discussed separately, we found that there was no difference of S-TN only in whether one suffers from low-HDL-C, HUA and M-TNs only in whether one suffers from HUA (M-TN in low HDL-C: 7.9% vs. 7.8%, p = 0.669; M-TN in HUA: 7.7% vs. 7.8%, p = 0.678; S-TNs in HUA: 10.9% vs. 10.9%, p = 0.958).
Patients with several MD components had a higher prevalence of S-TN or M-TNs than those without these MDs (central obesity [S-TN: 13.0% vs. 9.9%; M-TNs: 10.9% vs. 6.2%], diabetes [S-TN: 14.4% vs. 10.5%; M-TNs: 14.8% vs. 7.0%], prediabetes [S-TN: 12.6% vs. 9.1%; M-TNs: 9.0% vs. 5.7%], IFG [S-TN: 12.1% vs. 9.1%; M-TNs: 7.5% vs. 5.7%], IGT [S-TN: 14.5% vs. 9.1%; M-TNs: 10.3% vs. 5.7%], high TG [S-TN: 11.7% vs. 10.6%; M-TNs: 8.5% vs. 7.5%], high TC [S-TN: 13.6% vs. 9.9%; M-TNs: 11.4% vs. 6.4%], high LDL-C [S-TN: 13.6% vs. 10.2%; M-TNs: 11.6% vs. 6.8%], and HBP [S-TN: 13.6% vs. 9.8%; M-TNs: 12.0% vs. 6.0%]). However, patients with low HDL-C had higher prevalence of S-TN than those without low HDL-C (11.6% vs. 10.8%) (Fig. 2).
Multivariate logistic regression between metabolic abnormalities and TN risk
As indicated in Figure 3 and Supplementary Table S3, we analyzed the risk of TNs in patients with different metabolic abnormalities (marked in black, OR, and CI). All results were adjusted by essential demographic, anthropometric, and serological information in the present study. Generally speaking, MDs were independently significantly associated with the presence of overall TNs, S-TN, and M-TNs. MetS was significantly associated with overall TNs and M-TNs. Furthermore, several MD components, such as central obesity, diabetes, IGT, hypercholesterolemia, high LDL-C, HBP, and HUA, respectively, were also significantly associated with overall TNs. Moreover, low HDL-C was inversely associated with overall TNs. Furthermore, IGT, hypercholesterolemia, high LDL-C, and HUA, respectively, were associated with S-TNs to a variable extent. Meanwhile, central obesity, diabetes, hypercholesterolemia, high LDL-C, HBP, and HUA, respectively, were significantly associated with M-TNs, whereas low HDL-C was inversely associated with M-TNs.

Adjusted ORs and CIs estimating the association between metabolic disorders and their component diseases with TNs (including STNs and M-TNs).
Gender-specific analysis examining association with the presence of TNs
In general, most patients with metabolic abnormalities had a higher prevalence of TNs, and differences in associations were gender specific. The prevalence of TNs (total thyroid nodule [T-TN], S-TN, and M-TN) in patients with abnormalities in overall MDs is shown in the histogram (Fig. 2). Overall, the prevalence of TNs (T-TN, S-TN, and M-TN) in MDs and most of its components were higher than the prevalence in the group without these metabolic diseases (p < 0.05). However, the M-TN prevalence in men had no difference between whether suffering from high TG and HUA. Besides, the TN (T-TN, S-TN, M-TNs) prevalence had no difference between whether suffering from low HDL-C regardless of gender. The prevalence of TNs (T-TN, S-TN, M-TNs) were all higher in women than men with MDs (T-TN, 24.9% vs. 17.0%; S-TN, 13.6% vs. 10.3%; M-TNs, 11.3% vs. 6.7%), MetS (T-TN, 31.8% vs. 20.2%; S-TN, 16.0% vs. 12.0%; M-TNs, 15.8% vs. 8.2%), and their components (p < 0.05).
The multivariate logistic regression analyses, according to gender, are shown in Figure 3 and Supplementary Table S3. The gender-specific TN ORs [with CI] were marked in blue and pink for men and women, respectively. Both MDs and MetS were risk factors for overall TNs, S-TNs, and M-TNs in men, whereas MDs were risk factors for these three TN profiles in women.
When taking overall TN risk into consideration, central obesity, diabetes, IGT, hypercholesterolemia, high LDL-C, HBP, and HUA were all significantly associated with the presence of TNs in men. Hypercholesterolemia, high LDL-C, HBP, and HUA were significantly associated with the presence of TNs in women. An inverse association was observed between HDL-C and the presence of overall TNs in women (OR = 0.869, CI [0.810–0.933], p < 0.001). In men, diabetes, prediabetes, IGT, hypercholesterolemia, high LDL-C, and HUA, respectively, were associated with the presence of S-TNs. In women, hypercholesterolemia, high LDL-C, HBP, and HUA were associated with the presence of S-TNs. However, central obesity, diabetes, hypercholesterolemia, high LDL-C, HBP, and HUA were associated with M-TNs in men. Central obesity, diabetes, hypercholesterolemia, high LDL-C, HBP, and HUA were associated with the presence of M-TNs in women, and had an inverse association between HDL-C and the presence of M-TNs in women (OR = 0.816, CI [0.737–0.903], p < 0.001).
Discussion
In recent years, the diagnosis of TNs has increased rapidly. Occult TNs may occur in 68% of the general population (15), which may be due to the increased use of imaging techniques resulting in increased detection of thyroid incidentalomas (16). The reported detection rate of TNs by ultrasonography is ∼65%, of which ∼50% are solitary (5,17). The prevalence of TNs and the rate of multinodularity are increased in women and with increased BMI (15). However, the specific factors in the formation of TNs are still not clear. An observed association between MetS and TNs has been previously reported (18 –22). However, there are very few published studies examining for the potential relationships between specific types of MDs and TNs. In this study, a large sample size survey in China has clarified some relationships between MDs and TNs and suggested theories that may inform the understanding of the formation of TNs.
A relationship between thyroid disease and metabolic disease has been previously reported (14,23,24). A retrospective study comprising 72,319 subjects in Korea revealed that an increased detection of MDs was associated with increased prevalence of TNs in the general population (25). This result demonstrated that metabolic disturbances may contribute to an increased prevalence of TNs. A comprehensive survey from China involving 6798 subjects, which investigated the pathogenesis underlying the increased prevalence of TNs in MetS, suggested that respective components of MetS may be associated with the presence of TNs to a greater extent in women, as compared with men (26). This study revealed the importance of examining for gender differences in the relationship between TNs and MetS. To date, this was one of the first studies to investigate the relationship between TNs and MDs in different genders. However, no studies have investigated the relationship between different types of TNs (S-TN and M-TNs) and MDs with respect to gender.
In contrast to previous studies (26), we observed that MetS was significantly associated with the presence of TNs in men, but not in women. Our contrasting findings may be attributed to the different diagnostic criteria for MetS. The waist circumference and HDL-C cutoff value for women used in this study was 85 cm and 1.30 mmol/L, respectively, as compared with 80 cm and 1.29 mmol/L in the above study (26). However, our large sample size would be expected to mitigate the risk of sampling error and uncertainty. With respect to central obesity and HBP, we report for the first time that these variables were significantly associated with with M-TNs but not S-TN.
Abnormal glucose metabolism and diabetes are risk factors for many other diseases, including cardiovascular disease. Consistent with previous studies (19,21,27), we have observed that diabetes was significantly associated with the presence of M-TNs. However, a novel observation in this study was the lack of a significant association between M-TNs and prediabetes, IFG, and IGT. Insulin resistance (IR) is a key factor involved in the pathogenesis of impaired glucose metabolism. The most likely cause of the effect of abnormal glucose metabolism on TNs is IR. Tang et al. reported that homeostasis model assessment-insulin resistance (HOMA-IR) values and age were higher in individuals with TNs, as compared with controls, and suggested that HOMA-IR was a risk factor for TNs (28).
Another recent study similarly reported a significant association between the HOMA-IR value and the presence of TNs (r = 0.29, p < 0.05) (29). Although this finding has been reported in multiple studies, the mechanism of abnormal glucose metabolism on TNs remains unclear. This might be due to the lack of a robust animal model of TN. Thus, mechanistic studies are required to examine the relationship among IR, abnormal glucose metabolism, and TNs, especially for M-TNs.
Similar to abnormal glucose metabolism, dyslipidemia is an important risk factor for cardiovascular disease and thrombosis (30). Hypertriglyceridemia also plays a critical role in various cerebro- and cardiovascular diseases (31). In this study, we found no significant association between hypertriglyceridemia and TNs, consistent with several previous studies (19,32). However, this was in contrast to others (18,33). The relationship among hypercholesterolemia, high LDL-C, and TNs is poorly understood. In this study, we found a significant association between the presence of TNs and hypercholesterolemia and high LDL-C, respectively, regardless of TN types (S-TN or M-TNs). Demir et al. observed a statistically significant decrease in TN size in patients receiving 10 mg of rosuvastatin (study of 106 hyperlipidemic patients treated for 6 months with rosuvastatin or atorvastatin at dosages of 10 and 20 mg daily) (34). These findings suggest that TN volume may be associated with cholesterol levels and one may hypothesize that treatment of lipid abnormalities may be beneficial in this context.
Only one study has investigated the relationship between UA and TNs. Liu et al. (35) reported that serum UA appeared to be inversely associated with the presence of TNs in men older than 30 years, but was positively associated with the presence of TNs in both men younger than 30 years and women older than 30 years. As the age stratification of patients with UA was not performed in this study, we cannot verify the conclusion above. However, in our study, the presence of TNs (included S-TN and M-TNs) were associated with HUA both in women and men, and the OR value was higher in women than men. Further studies are required to determine whether the age of patients with HUA will affect the occurrence of TNs.
A common characteristic in the prevalence of thyroid disorders is the known preponderance in women. The ratio between women and men has been reported to be 3–4:1 for TNs (36). The effect of female gonadal hormones, such as prolactin and estrogen, and X chromosome inactivation on the thyroid gland may contribute to women's predilection to TNs. The direct action of estrogen on thyroid tissue may contribute to the development of thyroid goiter and nodules in women (36). Estradiol also plays an important role in the growth of TN cells (37). Estrogen receptors are known to be found in normal thyroid follicular cells and tumor cells (38). In vitro studies have suggested that estrogen can promote the proliferation of thyroid follicular cells (39). While this may be the potential mechanism of action of estrogen on TNs, more studies are required to further elucidate the potential role of estrogen on TN formation.
Limitations
This study has several limitations. First, due to its cross-sectional nature, no causal inference between MDs and TNs should be drawn and future prospective research is needed. Second, we did not measure insulin levels in this population-based study to support the assumption of the presence of IR. Third, since our study excluded subjects with abnormal thyroid function and pregnant women, and only included adults, the results are not generalizable to the whole Chinese population, children, or other populations. Fourth, there were many sonographers who participated in this cross-sectional survey, which could create some interobserver variability in the diagnosis of TNs. However, we ensured that all sonographers were uniformly trained and that the diagnostic criteria for TNs were uniform before starting the investigation. Finally, we did not distinguish between cystic and solid nodules.
Conclusion
In summary, TNs (especially M-TNs) may be associated with MDs and their various components (MetS, central obesity, diabetes, IGT, hypercholesterolemia, high LDL-C levels, low HDL-C, HBP, HUA) and there are gender-specific differences in some of the observed associations.
Ethics Approval
This study was approved by the Medical Ethics Committee of China Medical University (2014-103-2; serial number: IRB[2008]115).
Patient Consent
All participants provided written informed consent after a thorough explanation of the research procedures.
Related Data That Has Been Published
A partly related data of the relationship of TN in MetS had been reported in our published article (40).
Data Sharing Statement
The data used during the current study are available from the corresponding author upon reasonable request.
Footnotes
Authors' Contributions
All authors had full access to all the data in the study and take responsibility for the integrity of the data and the accuracy of the data analysis. Concept and design: Z.S. and W.T. Acquisition, analysis, or interpretation of data: F.Z., D.T., N.T., G.W., Y.L., and X.Y. Drafting of the article: F.Z. Statistical analysis: F.Z., Y.L., and X.Y. Obtained funding: W.T. Administrative, technical, or material support: All authors. Study supervision: D.T., N.T., G.W., Z.S. and W.T.
Acknowledgments
The authors thank the participants of this study. For their continuous support, assistance, and cooperation, the authors thank the investigators of the TIDE Survey Group.
Author Disclosure Statement
The authors declare no conflict of interests.
Funding Information
This study was funded by The Research Fund for Public Welfare, National Health and Family Planning Commission of China (Grant No. 201402005; W.T.) and The Clinical Research Fund of Chinese Medical Association (Grant No. 15010010589; W.T.).
Supplementary Material
Supplementary Data
Supplementary Table S1
Supplementary Table S2
Supplementary Table S3