
Abstract
Background:
Iodine nutrition is an important public health issue. Trends in iodine status over time among U.S. schoolchildren and adults and factors mediating changes of iodine status were examined.
Methods:
In this cross-sectional study of National Health and Nutrition Examination Survey (NHANES) data, we estimated trends in the U.S. population using linear regression analyses. Representative samples of U.S. children and adults were enrolled in NHANES 2001–2020. The NHANES cycles were categorized into 5 four-year periods: 2001–2004, 2005–2008, 2009–2012, 2013–2016, and 2017–2020. The final sample sizes of children and adults for analysis were 4288 and 19,661, respectively. The estimated average requirement (EAR) (based on guidelines from the Institute of Medicine), was used to estimate the prevalence rate of inadequate iodine intake. Binary logistic regression analyses were used to investigate the association between iodine status and contributing factors.
Results:
From 2001–2004 to 2017–2020, among children, urinary iodine concentration (UIC) decreased from 243 to 166 μg/L (p trend = 0.0057) and prevalence of iodine intake below the EAR rose from 15.4% to 27.6%. In adults, the UIC decreased from 153 to 116 μg/L (p trend < 0.001) and prevalence of iodine intake below the EAR rose from 15.0% to 17.9%. A higher prevalence rate of iodine intake below the EAR was observed in females compared with males (children, 24.0% vs. 16.5%, p < 0.001; adults, 20.0% vs. 11.1%, p < 0.001). Inadequate iodine intake was less frequent among non-Hispanic White and Hispanic compared with non-Hispanic Black in children and adults. Adults without thyroid problems had a higher prevalence of inadequate iodine intake than those with thyroid problems (16.0% vs. 13.0%, p = 0.001). Inadequate iodine intake was less likely in the children who “sometimes” and “often” consumed milk products compared with children who “never or rarely” consumed milk products (OR = 0.60 [CI 0.30–1.21] and OR = 0.24 [CI 0.13–0.43], respectively). The prevalence of inadequate iodine intake among adults reporting “sometimes” (OR = 0.70 [CI 0.58–0.83]) and “often” consuming milk products was lower than those who “never or rarely” consumed them (OR = 0.36 [CI 0.30–0.44]).
Conclusions:
In this weighted survey, the prevalence of inadequate iodine intake increased from 2001–2004 to 2017–2020 among U.S. school-age children and adults. Sex, race, thyroid problems, and a decreased intake of milk products were significantly associated with iodine intake below the EAR.
Introduction
Iodine is essential for thyroid function, growth, development, as well as physical and mental functioning. Among children and adults, complications of iodine deficiency disorder include goiter, mental function impairment, physical developmental retardation, and increased susceptibility of the thyroid gland to nuclear radiation. 1 The urinary iodine concentration (UIC) reflects recent iodine intake, as ∼90% of absorbed iodine is ultimately excreted in the urine. 2 The categories for the UIC for school-age children and adults were defined by the World Health Organization (WHO) as follows: deficiency, <100 μg/L; adequate, 100–199 μg/L; more than adequate, 200–299 μg/L; and excessive, ≥300 μg/L. 3,4 The UIC value varies greatly between and within individuals, but this variation tends to achieve equilibrium in the population. Hence, the WHO-defined cutoff of median UIC (100 μg/L) value used in epidemiological studies should not be applied to individuals and should only be recommended in evaluating the iodine deficiency level in a respective population. 5
Iodine nutrition status is a nationwide public health issue of immense importance in the U.S. population. The National Health and Nutrition Examination Survey (NHANES) has conducted regular monitoring of the iodine status of the general population in the United States since 1971; the UIC in the NHANES 1988–1994 demonstrated an adequate level, but that in the NHANES 1971–1974 was half the median value. 6 According to a previous study, 7 a downtrend in the UIC among adults over time was discovered in NHANES datasets from 2001–2004 to 2009–2012.
In this study, NHANES datasets were used to investigate trends in iodine status over time in U.S. schoolchildren and adults. We also explored factors associated with inadequate iodine intake. This study utilizes data from urinary iodine in single spot urine samples from 2001 to March 2020, which were measured in the NHANES by the Elemental Analysis Laboratory of the CDCs Division of Laboratory Science.
Methods
Data source
The NHANES selected national samples representative of the civilian, noninstitutionalized U.S. population by using a multistage and stratified sampling design. The National Center for Health Statistics Research Ethics Review Board granted approval for the survey, and participants were required to sign an informed consent form. A detailed description of the NHANES data collection method has been published in a previous study. 8
Datasets were collected from 10 consecutive two-year cycles of the NHANES from 2001 to 2020 prepandemic. The study population of interest was selected as follows: children 6–11 years of age and adults ≥20 years of age. There were 4288 participants 6–11 years of age and 20,109 participants 20 years of age and over at enrollment for whom UICs were available. Then, NHANES data were used and grouped into the following 5 four-year periods: 2001–2004, 2005–2008, 2009–2012, 2013–2016, and 2017–March 2020. The exclusion criterion was pregnant women (448 participants). The final child and adult sample sizes for analysis were 4288 and 19,661, respectively. The flowchart of data filtered in detail for the study participants is shown in Supplementary Figure S1.
The assessment of iodine status
From 2001–2002 to 2019–March 2020 (with the exception of 2007–2008), the UIC was measured from every single spot urine sample at the mobile examination center (MEC) and was collected from one-third of all participants six years of age and older. In the 2007–2008 survey period, the collected spot UIC was measured from the urine samples of all survey participants. These collected spot urine specimens were analyzed using the method described by Caldwell et al. 9,10 Then, the UIC was determined by using inductively coupled plasma mass spectrometry and DRC™ technology, as previously described. 7,11 –13
The NHANES database did not contain 24-hour urinary iodine excretion (UIE) measurements, so the estimated average requirement (EAR) was recommended as a better substitution method for assessing the extent of iodine inadequacy in contrast to the UIC as per the current WHO criteria. 5 The EAR approach based on the Institute of Medicine (IOM) guidelines could assess how many people were probably iodine inadequate or had poor iodine intake status. 14,15 An iodine intake equal to the EAR value would satisfy 50% of people's needs within the criteria, and the percentage below the EAR estimates the proportion of the population at risk of iodine inadequacy. 14,15
An average daily iodine intake (μg/day) could be determined using the formula “UIC (μg/L)/0.92 × (0.0009 L·h−1·kg−1·24 h·day−1) × weight (kg)”; then, the prevalence of inadequacy was calculated by the percentage of individuals with values below the EAR threshold: 65 μg/day (6–8 years), 73 μg/day (9–11 years.), and 95 μg/day (≥20 years). 5,16,17 Another way to assess how many people have probably iodine inadequacy is the urinary iodine to creatinine ratio criteria (UI/Cr below 85 μg/g). There was some evidence to suggest that this ratio may be superior to the UIC. 2,7,18 –20 Through the above three approaches, we were able to obtain the prevalence of inadequate iodine intake in three ways, which was equivalent to the sensitivity analysis to some degree.
Possible contributing food types associated with iodine
In the dietary recall interview in the MEC, participants were asked about salt use and whether fish and shellfish had been consumed during the past 30 days. Salt use at the table or in preparation levels was categorized as “never or rarely,” “occasionally,” and “very often.” Milk product consumption levels in the past 30 days were categorized as “Never or Rarely,” “sometimes,” and “often.” “Never or rarely” indicated that in the past 30 days, milk products were consumed less than once a week; “sometimes” indicated that milk products were consumed more than once a week but less than once a day; and “often” denoted that milk products were consumed once a day or more.
Covariates
Sociodemographic variables, including sex, race, and age, were self-reported in the interview. Sex and race are categorical variables, whereas age is a continuous variable. Race was classified into four categories: non-Hispanic White (NHW), non-Hispanic Black (NHB), Hispanic, and other race (other). Health-related variables included body mass index (BMI), urinary creatinine concentration (UCr), and thyroid problem. BMI (kg/m 2 ) was calculated by measuring height and weight. In this study, UCr was used to correct for variable UIE rates. The Thyroid Problem section included self-reported health and medical history interview data of thyroid for adults 20 years of age and over. Socioeconomic status variables include the PIR, Education, and Health insurance. The PIR was the ratio of family income to poverty (low, <1.85; medium, ≥1.85, <3.5; high ≥3.5), and poverty guidelines from the Department of Health and Human Services were used to calculate this ratio. Poverty guidelines vary by family size and geographic location. 7,21,22
Education is the highest grade or level of education completed by adults 20 years of age and older. The response levels were categorized as “<high school,” “high school graduate/some college,” and “college graduate or above.” Possessions of health insurance was established by trained interviewers by using a computer-assisted personal interview system. Accordingly, the number of subjects with complete data describing covariate data for children and adults can be seen in Supplementary Table S1. The missing percentages of relevant covariates ranged from 0.00% to 6.79% in schoolchildren and 0.00% to 8.99% in adults.
Statistical analyses
Statistical analyses were performed using IBM SPSS Statistics, Version 25 (complex survey design 23 ), EmpowerStats and R, Version 4.0.5. Continuous variables are described as the survey-weighted median (Q1, Q3) for non-normally distributed data; if the continuous data conformed to the normal distribution and the variance was uniform, they are represented by the survey-weighted mean and standard error, and comparisons between groups were performed by the F-test. Categorical variables are described as percentages, and comparisons of multiple component ratios were performed using the Wald chi-square test. Two-sided p-values were considered statistically significant if p < 0.05. The median UIC (μg/L) and UCr (mg/dL) were used instead of the mean UIC and UCr because of the positively skewed data distribution in the UIC and UCr. The arithmetic mean of the log-transformed UIC data (log10UIC) was used because log-transformed data were approximately normally distributed according to the P–P graph. 24 –26
To evaluate the trends in the UIC and prevalence of inadequate iodine intake (below the EAR, UIC below 100 μg/L, and UI/Cr below 85 μg/g) from 2001–2004 to 2017–2020 among U.S. children and adults, the log10UIC or prevalence was used as the dependent variable, the survey period was used as the independent variable, and the trend analysis of iodine status was carried out by using linear regression under the complex survey design. Binary regression analysis was used to further investigate the association between iodine status and possible contributing factors with and without the adjustment of sociodemographic, health-related, and socioeconomic status variables.
Results
Baseline characteristics of study subjects
Among children, there was no significant difference in sex, race, age, BMI, or PIR, whereas there was a significant difference in UCr during the five divided periods; health insurance, fish eaten, and salt use at the table seemed to exhibit a downtrend/uptrend over time (all p trend < 0.05) (Table 1). Among adults, there was no significant difference in sex, race, or PIR, whereas there was a significant difference in age and UCr during the five divided periods; BMI, thyroid problems, education level, health insurance, fish eaten, salt use at table, and salt use in preparation showed a downtrend/uptrend over time (all p trend < 0.05) (Table 2). In Tables 1 and 2 and Figure 1, we observed downtrends in milk product consumption among children and adults over time.
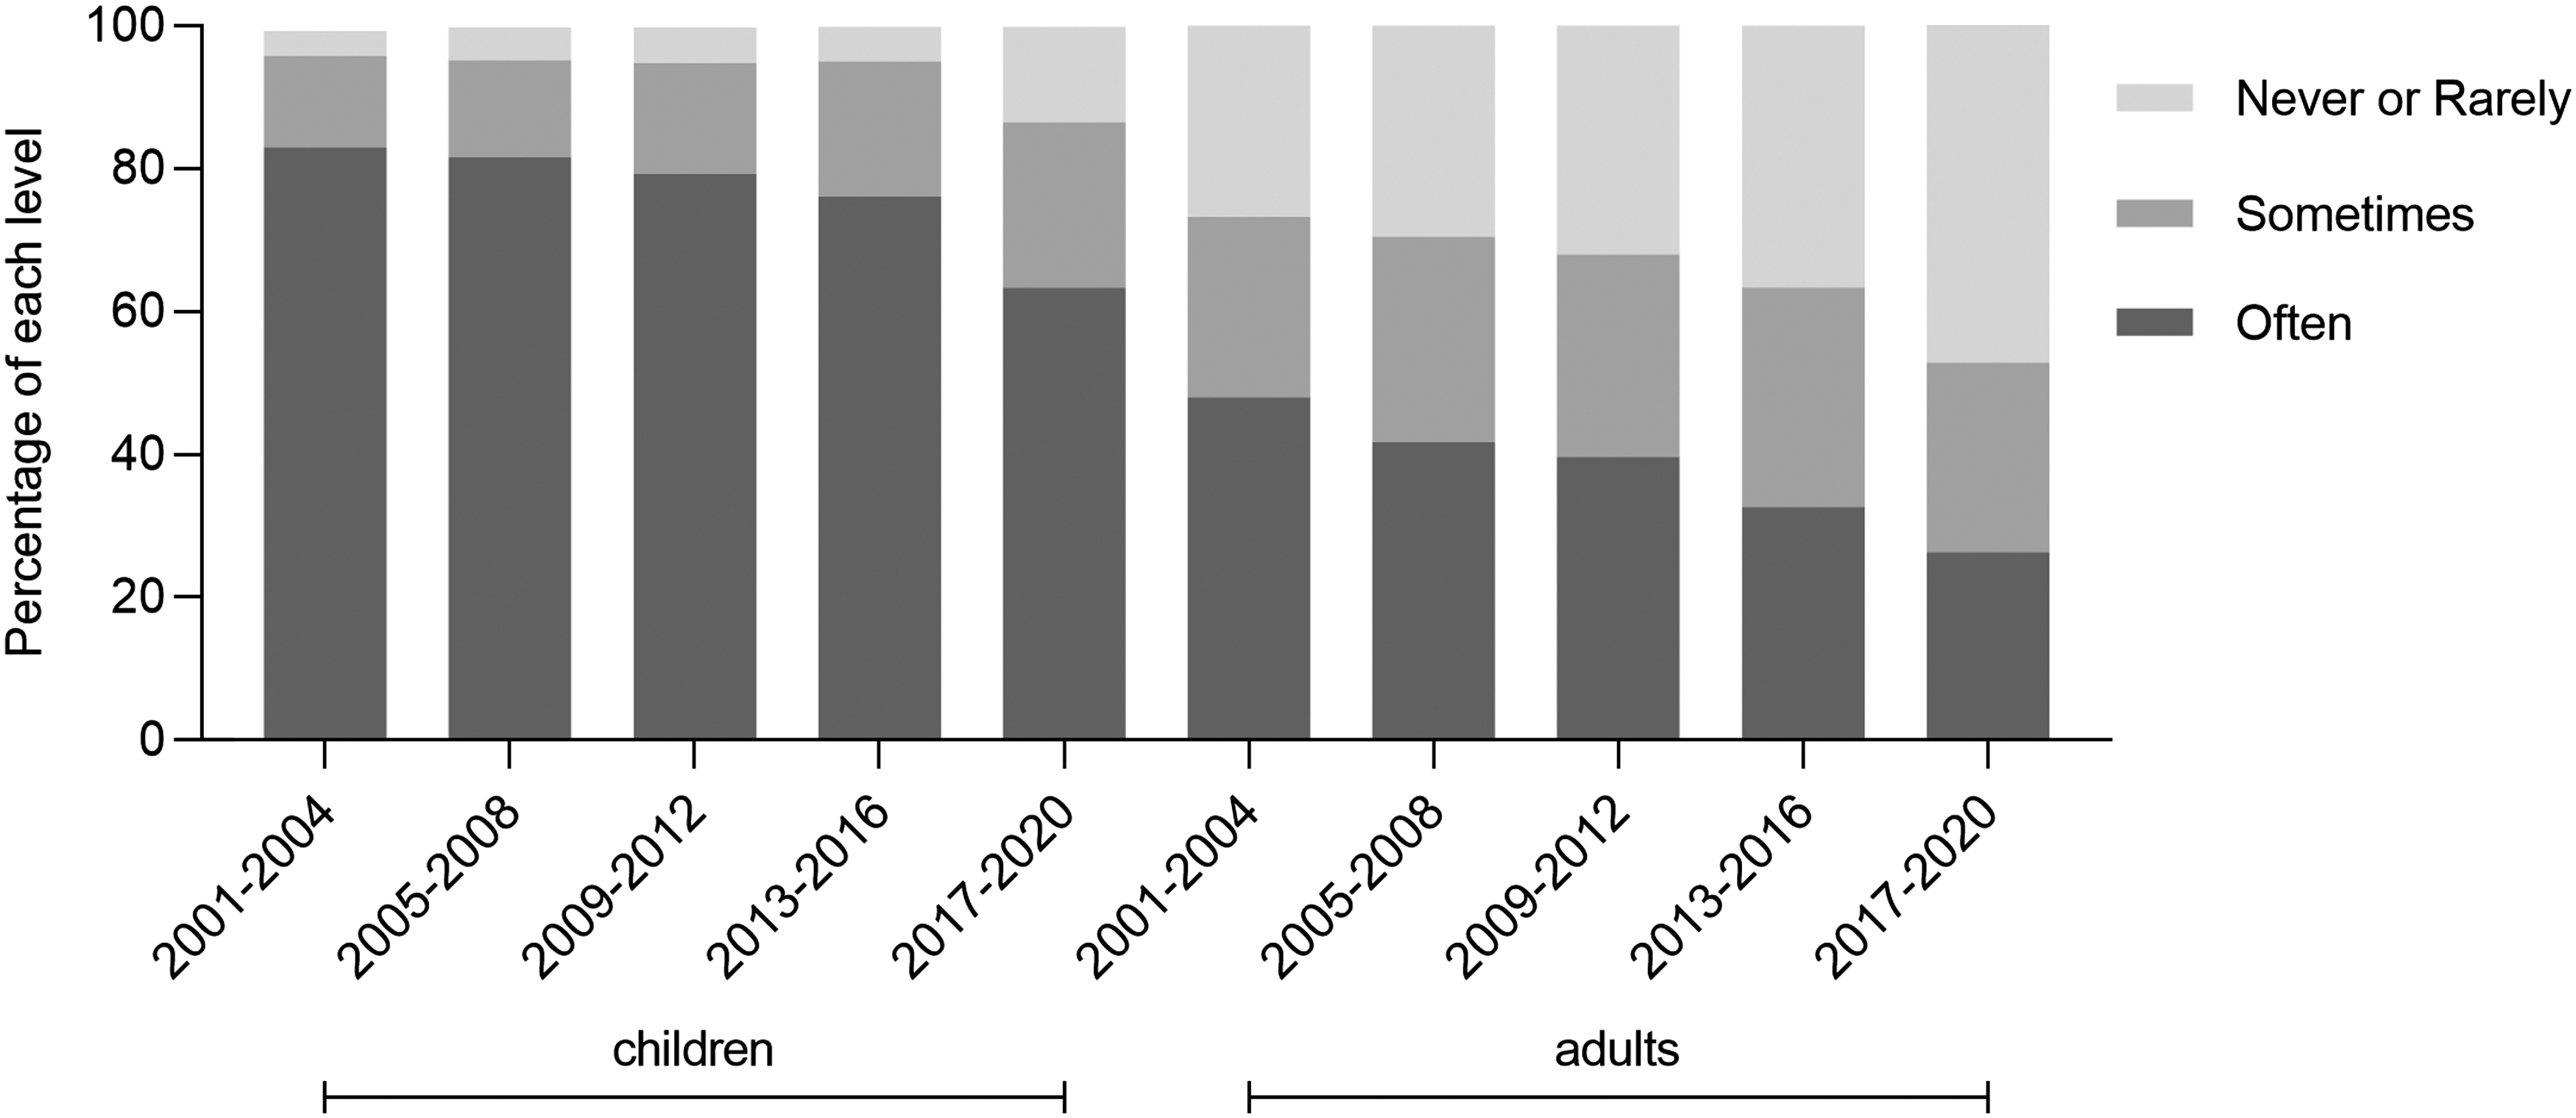
A downtrend in dairy consumption among children and adults is observed over time.
Weighted Characteristics of U.S. Children with Iodine Nutrition Status, National Health and Nutrition Examination Survey 2001 to March 2020 (n = 4288)
Represent p for trend over time by using survey-weighted linear regression.
BMI, body mass index.
Weighted Characteristics of U.S. Adults with Iodine Nutrition Status, National Health and Nutrition Examination Survey 2001 to March 2020 (n = 19,661)
Data in above tables: Continuous variables are described as survey-weighted mean or median (Q1, Q3). Categorical variables are described as percentages and comparisons of multiple component ratios were performed using the Wald chi-square test.
Represent p for trend over time by using survey-weighted linear regression.
/ Indicates that data are missing or cannot be classified.
NHB, non-Hispanic Black; NHW, non-Hispanic White; PIR, the ratio of family income to poverty; UCr, urinary creatinine concentration; UIC, urinary iodine concentration.
Iodine status and trends over time
In Tables 1 and 2 and Figure 2, the UIC among children and adults showed downtrends from 2001 to 2020, and the median UIC met the linear trend; UIC values over time were 243, 223, 206, 174, and 166 μg/L, respectively, among children (p trend = 0.0057) and 153, 155, 136, 121, and 116 μg/L, respectively, among adults (p trend < 0.001). The percentage of iodine intake below the EAR among children was 15.4% in the NHANES 2001–2004 but 27.6% in the NHANES 2017–2020. The proportion below the EAR among adults was 15% and 17.9% in the NHANES 2001–2004 and 2017–2020, respectively. The prevalence of inadequacy as defined by the EAR cutoff method was 4–15% in children and 52–61% in adults, which was lower than the prevalence as defined by a UIC below 100 μg/L in children and adults. It seemed that it was more conservative to use an UI/Cr below 85 μg/g to define iodine inadequacy in the population (Supplementary Table S2 and Supplementary Fig. S2A, B).
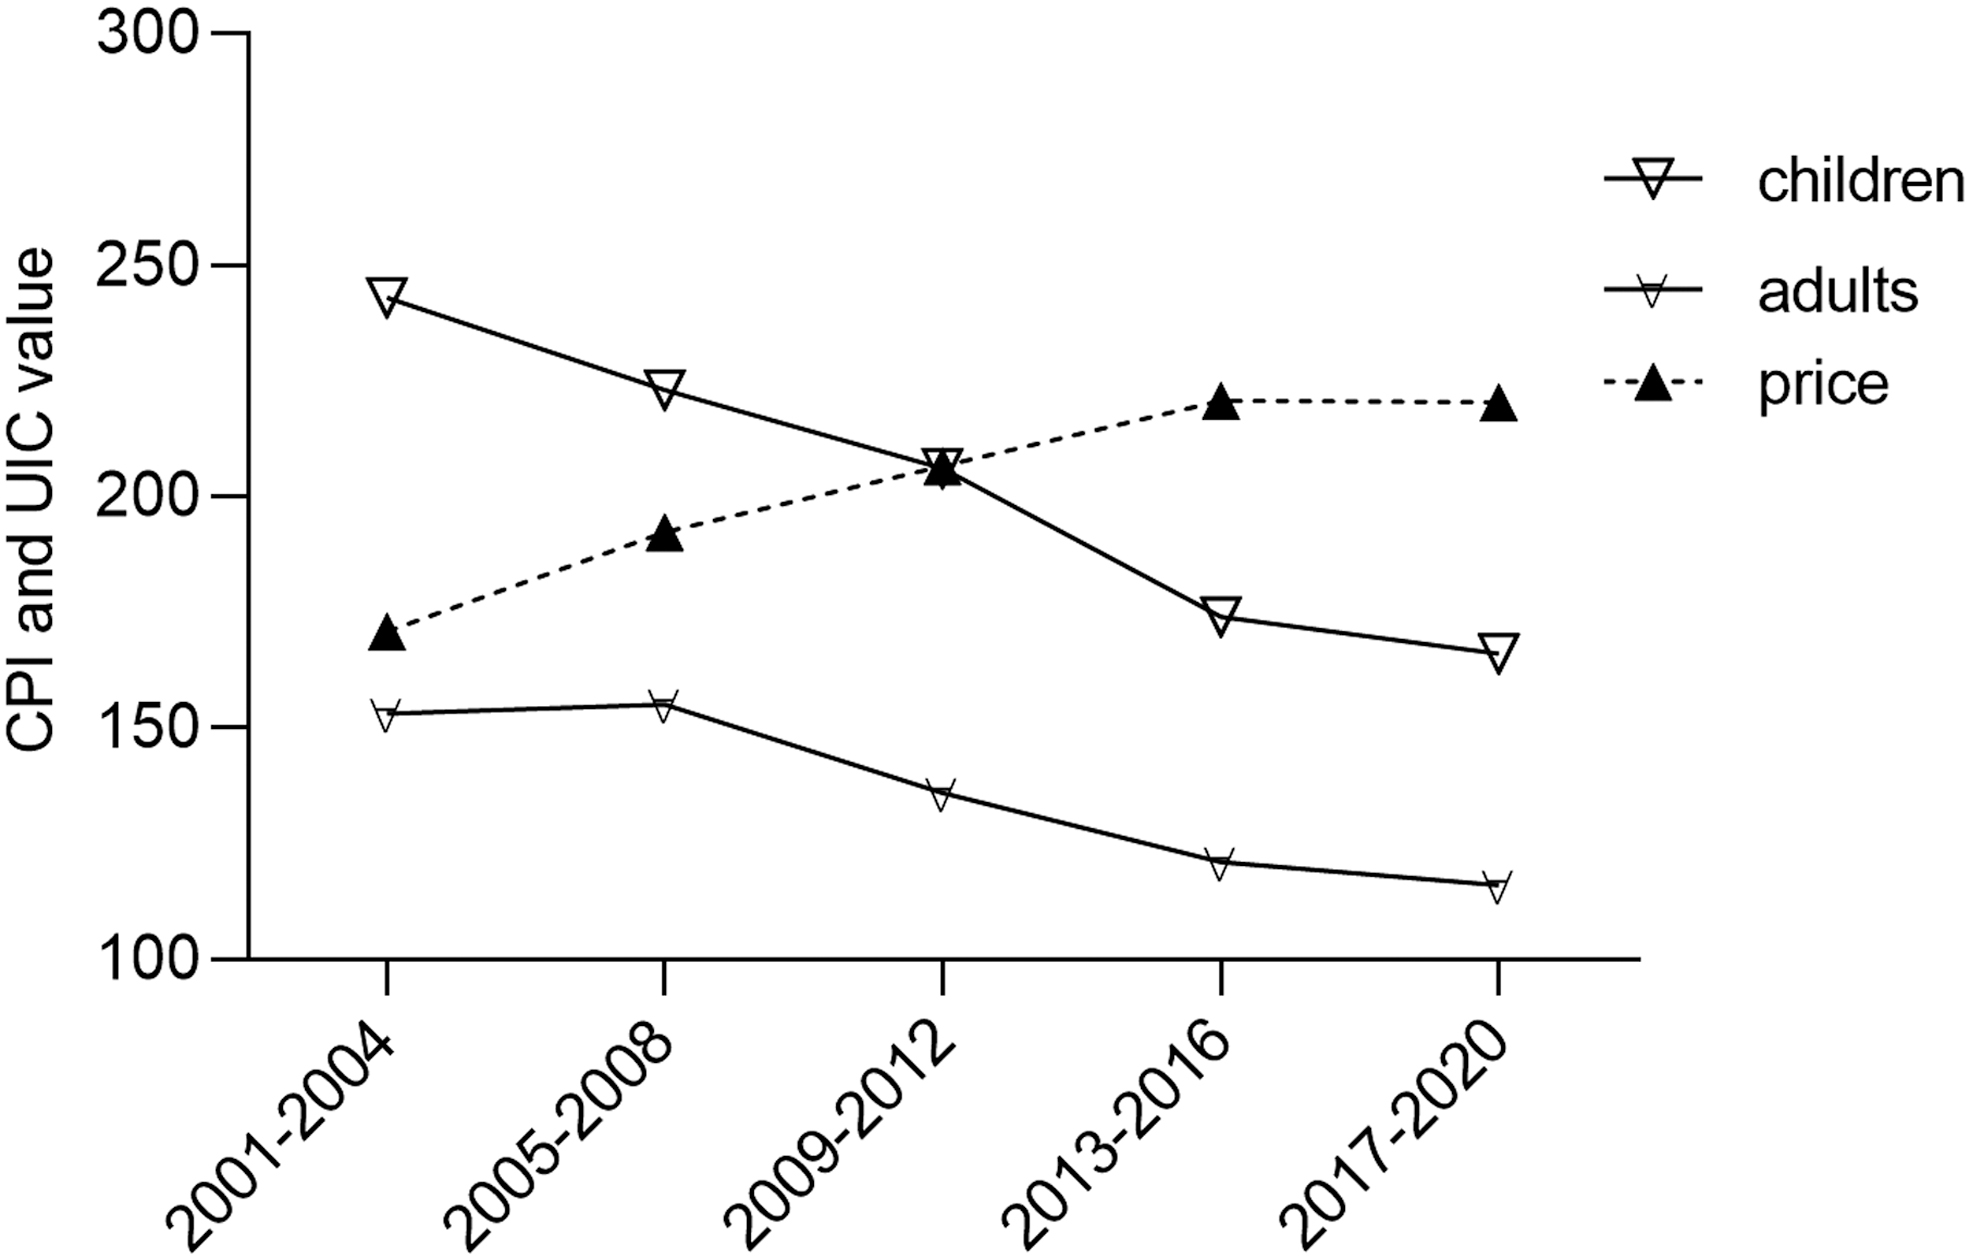
A downtrend in UIC among children and adults and an upward trend in CPI for dairy products are observed. CPI, Consumer Price Index; UIC, urinary iodine concentration.
Factors associated with inadequate iodine intake
The prevalence of inadequate iodine intake was consistently higher in females than in males, whereas the uptrend in females was less obvious than that in males during the five periods (Supplementary Table S2). A higher prevalence was more likely among females than males (children, 24.0% vs. 16.5%, multivariable-adjusted prevalence ratio = 1.46 [CI 1.09–1.95]; adults, 20.0% vs. 11.1%, multivariable-adjusted prevalence ratio = 1.21 [CI 1.01–1.45]). It was estimated that the prevalence of iodine intake below the EAR was less likely among NHW and Hispanic individuals versus NHB individuals in both children and adults. Adults without thyroid problems had a higher prevalence of inadequate iodine intake than those with thyroid problems (Table 3).
Factors Associated with Iodine Intake Below the Estimated Average Requirement Among U.S. Children and Adults, National Health and Nutrition Examination Survey 2001 to March 2020
Bold values represent p value < 0.05.
Data are represented as OR [CI].
Model 1: adjustment of sociodemographic variables, including sex, race, and age.
Model 2: adjustment of sociodemographic variables, including sex, race, and age+health-related variables, including BMI, UCr, and Thyroid problem+socioeconomic status variables, including PIR, education, and health insurance.
/ Indicates that data are missing or cannot be classified.
CI, confidence interval; OR, odds ratio; SE, standard error.
In Table 3, increased milk product consumption levels were negatively associated with the prevalence of iodine intake below the EAR among U.S. children and adults. Children reporting milk consumption “often” had a significantly lower prevalence of inadequate iodine intake compared with those who “never or rarely” reported consuming milk products (17.9% vs. 35.1%; multivariable-adjusted prevalence ratio = 0.24 [CI 0.13–0.43]). Among adults, inadequate iodine intake in the group consuming milk products “sometimes” (OR = 0.70 [CI 0.58–0.83]) and “often” (OR = 0.36 [CI 0.30–0.44]) was significantly lower than that in the group reporting milk product consumption “never or rarely.” Similar associations were seen when stratified by sex and race, as shown in Table 4.
Dairy Consumption and its Association with Iodine Intake Below the Estimated Average Requirement Among U.S. Children and Adults
Bold values represent p value < 0.05.
Data are represented as OR [CI].
All data except for sample size are weighted accounting for the complex survey design according to the directions of the
Model 1: adjustment of sociodemographic variables, including sex, race, and age.
Model 2: adjustment of sociodemographic variables, including sex, race, and age+health-related variables, including BMI, UCr, and Thyroid problem+socioeconomic status variables, including PIR, education, and health insurance.
Individuals with a PIR <3.5 (compared with those ≥3.5), those with less than high school education (compared with those having high school graduate/some college or above) and those with no health insurance (compared with those having health insurance) had a higher UIC and a lower prevalence of iodine adequacy. However, there was no significant association between PIR/education/health insurance status and inadequate iodine intake (all p > 0.05); in addition, no significant relationship between inadequate iodine intake and shellfish/fish/salt consumption was observed (all p > 0.05) (Table 3 and Supplementary Table S3).
Discussion
In this study, we observed that overall dietary iodine intake is currently adequate among U.S. children and adults according to the WHO criteria. However, there are concerns raised about the higher prevalence rates of inadequate iodine intake over time among adults, especially in females, NHB individuals, and individuals without thyroid problems. There were several reasons accounting for the above findings.
The various frequencies of milk product consumption among subgroups may account for the differentiation in UIC values (e.g., the higher frequency of dairy consumption with higher UIC values among children). The downtrend in UIC values mirrored the downtrend in milk product consumption over time among U.S. children and adults, and when stratified by sex and race, supporting the hypothesis that milk product consumption plays a key role in iodine nutrition. Milk products have been a major source of iodine in typical diets for decades in the United States, and one bottle of milk can provide ∼57% of daily iodine intake. 27,28 Iodine-containing milk products are the primary source of U.S. dietary iodine due to the use of iodophors in the dairy industry rather than the deliberate addition of iodine. 5,28 Milk products are a more convenient source of dietary iodine than other iodine sources, such as iodized salt, because they can be consumed through the habitual consumption of a glass of milk or dairy items such as yogurts. 29,30
As Supplementary Table S4 shows, milk product consumption was lower in females than in males and was lower in NHB individuals than in NHW and Hispanic individuals based on the NHANES 2001–2020 datasets. It has been previously reported that 76% of the population reporting lactose intolerance were females, among which 50% were NHB, 30% were NHW, and 20% were Hispanic. 31 This report was consistent with variations in iodine status in different races or sexes and with different rates of milk product consumption by sex/ethnicity in our above findings. Self-diagnosed lactose intolerance and consequent avoidance of dairy products may be another contributing factor in the downtrend of milk product consumption.
Individuals who perceive themselves to be lactose intolerant but who are not lactose intolerant may unnecessarily impose self-dairy restrictions. 10 This decrease in dairy intake inevitably led to a higher prevalence, as validated in Supplementary Table S2 (Dairy Consumption section). Adults without thyroid problems had a higher prevalence of inadequate iodine intake, which may be explained by their lower health awareness than those with thyroid problems and their lower milk product consumption, 32 as shown in Supplementary Table S4.
Given the increasing trend in the adoption of veganism, soy products, as milk substitutes, are common nutritional solutions for vegetarians due to their high protein content. 33 This inevitably led to the decrease in milk product consumption over time among the population of those practicing veganism. Another reason for the downtrend in milk product consumption may be related to the rising price of dairy products from 2001–2004 to 2017–2020 (Fig. 2). Detailed information or data about the Consumer Price Index for dairy products can be seen on the website. 35 As shown in Figure 1, the price of dairy products went up from 2001 to 2020 relating to the above website.
As described in this study, iodine nutrition was not dependent on iodization of salt in the United States; similar findings were also shown in previous studies. In addition, no significant association between urinary iodine and fish/shellfish consumption was observed. 13,35 The difference in the prevalence according to the PIR, education level, and health insurance types may be explained by the fact that people with a higher PIR, education level, and health insurance might have greater health awareness or more diverse food choices. Our findings in Table 3, as well as those from Supplementary Table S3, show the attenuation of the association among PIR/Education/Health insurance, and inadequate iodine intake after adjusting for health-related and other socioeconomic status variables. This may explain the lack of significant associations with these variables.
It is worth adopting specific measures in populations after the assessment of iodine status. Milk products can be an effective vehicle for iodine intake by including ingredients enriched with iodine. Individuals with lactose intolerance can be advised to consume lactose-free products, such as yogurts. It is equally important to clarify misconceptions about dairy intake, especially among people with low iodine intake. However, a recent study showed that the iodine content in milk can vary greatly from 33 to 534 μg/L. 36 Considering these data, it seems advisable that the iodine content of specific products should be incorporated into packaging labels. 28 As revealed in the study, dietary habits might play an important role in preventing the risk of inadequate iodine status and could be an important factor in identifying risk groups in the future. Previous relevant studies partly revealed the downtrend in the UIC among the U.S. population. 6,7 However, they excluded the population under 20 years of age, which is the more meaningful age group; this could be further updated and analyzed by stratification and controlling for confounding factors.
This study has several limitations. First, only spot UIC (which might have considerable variations between and within days) was measured in this study, so the iodine nutrition status was less certain than if repeated measurements of UIC or 24-hour UIE were available. Hence, the EAR and UI/Cr were used as two alternative methods to better assess iodine status. Second, the NHANES was a cross-sectional study and did not include individual changes over time; hence, it can only be concluded that iodine status was associated with milk product consumption. Third, children under the age of 6 years were not considered in this study because there were few to no datasets of populations 0–5 years of age collected in the NHANES.
Conclusion
In this weighted survey, the prevalence of inadequate iodine intake increased from 2001–2004 to 2017–2020 among U.S. school-age children and adults, especially in females, NHB individuals, and individuals without thyroid problems. Decreased intake of milk products was significantly associated with inadequate iodine intake. It is important to continue to consider the NHANES as a sentinel surveillance system for iodine status.
Footnotes
Authors' Contributions
B.H. and N.W. contributed to the concept and design. Y.L. contributed technical and material support. K.Z. and J.C. contributed to the integrity of the data and the accuracy of the data analysis. K.Z. and J.C. contributed to the first draft of the article. K.Z., J.C., J.Y., Y.C., X.S., and C.Z. contributed to the revised versions and the final version of the article. All authors approved the final version of the article for submission.
Author Disclosure Statement
No competing financial interests exist.
Funding Information
This study was supported by the National Natural Science Foundation of China (81670717) and the Natural Science Foundation of Shanghai (22ZR1436600).
Supplementary Material
Supplementary Table S1
Supplementary Table S2
Supplementary Table S3
Supplementary Table S4
Supplementary Figure S1
Supplementary Figure S2