
Abstract
Background:
Thyroid hormones play a key role in differentiation and metabolism and are known regulators of gene expression through both genomic and epigenetic processes including DNA methylation. The aim of this study was to examine associations between thyroid hormones and DNA methylation.
Methods:
We carried out a fixed-effect meta-analysis of epigenome-wide association study (EWAS) of blood DNA methylation sites from 8 cohorts from the ThyroidOmics Consortium, incorporating up to 7073 participants of both European and African ancestry, implementing a discovery and replication stage. Statistical analyses were conducted using normalized beta CpG values as dependent and log-transformed thyrotropin (TSH), free thyroxine, and free triiodothyronine levels, respectively, as independent variable in a linear model. The replicated findings were correlated with gene expression levels in whole blood and tested for causal influence of TSH and free thyroxine by two-sample Mendelian randomization (MR).
Results:
Epigenome-wide significant associations (p-value <1.1E-7) of three CpGs for free thyroxine, five for free triiodothyronine, and two for TSH concentrations were discovered and replicated (combined p-values = 1.5E-9 to 4.3E-28). The associations included CpG sites annotated to KLF9 (cg00049440) and DOT1L (cg04173586) that overlap with all three traits, consistent with hypothalamic–pituitary–thyroid axis physiology. Significant associations were also found for CpGs in FKBP5 for free thyroxine, and at CSNK1D/LINCO1970 and LRRC8D for free triiodothyronine. MR analyses supported a causal effect of thyroid status on DNA methylation of KLF9. DNA methylation of cg00049440 in KLF9 was inversely correlated with KLF9 gene expression in blood. The CpG at CSNK1D/LINC01970 overlapped with thyroid hormone receptor alpha binding peaks in liver cells. The total additive heritability of the methylation levels of the six significant CpG sites was between 25% and 57%. Significant methylation QTLs were identified for CpGs at KLF9, FKBP5, LRRC8D, and CSNK1D/LINC01970.
Conclusions:
We report novel associations between TSH, thyroid hormones, and blood-based DNA methylation. This study advances our understanding of thyroid hormone action particularly related to KLF9 and serves as a proof-of-concept that integrations of EWAS with other -omics data can provide a valuable tool for unraveling thyroid hormone signaling in humans by complementing and feeding classical in vitro and animal studies.
Introduction
Thyroid hormones play a key role in differentiation and metabolism. Thyroid dysfunction, a condition affecting 5–10% of the adult population, is associated with an increased risk of weight changes, cardiovascular diseases, osteoporosis, psychiatric disorders, and mortality. 1,2 Prohormone thyroxine and the biologically active triiodothyronine are the main circulating thyroid hormones and are regulated by thyrotropin (TSH). Thyroid hormones are known regulators of gene expression through both genomic and epigenetic processes; 3 however, the underlying exact molecular mechanisms remain unknown. One of these processes includes DNA methylation (DNAm), which predominantly occurs at CpG sites, and is a key regulator of gene expression.
While there has been little research so far in humans, various animal models provided evidence of thyroid hormones influencing DNAm. This was supported, for example, in a study by Kyono et al, 4 showing in developing frog tissue that triiodothyronine directly controls DNA methyltransferase 3a (Dnmt3a) expression, responsible for de novo DNAm. A recent study of two cohorts of Australian adolescents further revealed two and six CpG sites that were associated with TSH and free triiodothyronine (fT3) concentrations, respectively, indicating that although DNAm is highly tissue specific, the analysis of DNAm in blood may provide deeper insights into thyroid hormone action and/or regulation. 5
Motivated by the conclusion that larger sample sizes are necessary to replicate the findings and to reveal additional associations, we conducted a large-scale epigenome-wide association study (EWAS) assessing the effects of free thyroxine (fT4), fT3, and TSH on changes of DNAm in whole blood encompassing up to 7073 individuals of the ThyroidOmics Consortium (
Materials and Methods
Study population
We conducted the EWAS using population-based studies from the ThyroidOmics Consortium. The discovery stage included three cohorts: SHIP-Trend, 6 ARIC, 7 and KORA. 8 Replication of the findings was sought in the Rotterdam Study (RS), 9 TwinsUK, 10 the Lothian Birth Cohorts of 1921 and 1936 (LBC1921 and LBC1936), 11 and the Brisbane Systems Genetics Study (BSGS). 12 All study protocols were conducted in accordance with the Declaration of Helsinki and approved by the respective local ethics committees. All subjects provided written informed consent. Detailed information is given in Tables 1 and 2 and in the Supplementary Data.
Baseline Statistics of the Cohorts Included in the Epigenome-Wide Association Study Analysis
Sample sizes per cohort and trait can be found in Figure 1 and in the Supplementary Data.
BSGS, Brisbane Systems Genetics Study; fT3, free triiodothyronine; fT4, free thyroxine; NA, not available; RS, Rotterdam study; TSH, thyrotropin.
Technical Details of the Cohorts Used in the Epigenome-Wide Association Study analysis
Sample size per cohort and trait can be found in Figure 1 and in the Supplementary Data.
See Lehne et al. 38
See Teschendorff et al. 39
See Tsaprouni et al. 40
See McRae et al. 41
BMIQ, Beta MIxture Quantile dilation; CPACOR, incorporating Control Probe Adjustment and reduction of global CORrelation; DNAm, DNA methylation; WBC, white blood cell.
Biomarker measurements
DNAm was measured from whole blood using Illumina Infinium BeadChip arrays. Details regarding the cohorts, as well as the fT4, fT3, and TSH assays applied, are provided in Table 2.
Statistical analysis
The EWAS was undertaken in each cohort separately and subsequently meta-analyzed using quantile–quantile normalized beta CpG values as the dependent and log-transformed hormone levels as the independent variable. Each cohort followed the same analysis plan (Supplementary Data), and the results were processed by our in-house quality control pipeline (Supplementary Fig. S1). The EWAS results were corrected for inflation and bias where applicable using the Bacon R-package (Supplementary Fig. S2). 13 A detailed overview of the analyses is provided in Figure 1 and in the Supplementary Data.

Flowchart of the analyses performed in the current study. Image created with BioRender.com
Findings of the discovery stage passing significance after the Bonferroni correction (p-value <0.05/450,000 = 1.1E-07) were replicated in additional independent samples. A successfully replicated site was defined by p-value <0.05 in the replication stage with consistent effect direction, and a p-value <1.1E-07 in the discovery and replication combined meta-analysis.
Correlation with gene expression levels
The association of replicated CpG sites with gene expression levels of genes within ±500 kb vicinity was assessed in up to 713 blood samples of the KORA study (Supplementary Data). 14 Results passing the false discovery rate (FDR) <0.05 were declared significant.
Additional characterization of the findings
To analyze whether DNAm sites altered by thyroid hormones levels might be influenced by binding of thyroid hormones on thyroid hormone receptors elements, we extracted the overlap and distance between replicated CpGs and binding sites of the thyroid hormone receptor alpha from ChIPAtlas (
MR analysis
To test for a possible causal effect of the thyroid hormones on DNAm levels of significantly associated CpG sites, we conducted a two-sample MR using the R-package TwoSampleMR. 20 As genetic instruments for fT3 were unavailable, we only conducted the MR on fT4- and TSH-associated sites using independent genome-wide significantly associated index single nucleotide polymorphisms (SNPs) from a large genome-wide association study (GWAS) as instruments for the thyroid hormone levels. 21 The association of these SNPs with DNAm levels (methylation quantitative trait locus [mQTLs]) as outcomes was assessed in 1662 blood samples of the KORA study. The mQTLs were estimated by regressing the residuals of the methylation beta values adjusted for sex, age, technical factors, and estimated white blood cell type composition 22 on the SNP allele dosage.
Results of the mQTL analyses were available for 31 and 56 instruments for fT4 and TSH, respectively. The inverse-variance weighted fixed-effect MR was conducted as primary analysis, and the weighted median 23 and MR-Egger 24 as sensitivity analyses representing less powerful but more robust methods regarding violations of the validity of the instruments. Significance was assessed by the primary analysis p-value <0.05 divided by the number of tested CpGs per thyroid function trait. The effects can be interpreted as the proportion increase in DNAm per change in one standard deviation of the thyroid hormone level.
Results
Study sample characteristics
In the discovery stage EWAS based on 3 cohorts, we included 4085 individuals for TSH, 1639 for fT3, and 4081 for fT4. In the replication stage using 5 independent cohorts, 2988 additional individuals were included in the TSH analysis, 590 for fT3, and 2448 for fT4 (Table 1 and Supplementary Data).
DNAm sites associated with thyroid hormone levels
We discovered and replicated two novel CpG sites associated with TSH (cg00049440 in KLF9 and cg04173586 in DOT1L) and three novel sites associated with fT4 (cg00049440 in KLF9, cg04173586 in DOT1L, and cg03546163 in FKBP5). Of the five fT3-associated CpGs (in KLF9, DOT1L, LRRC8D, and near CSNK1D/LINC01970), the two CpGs in LRRC8D (cg06983052 and cg20146909) are novel. The replicated results are provided in Table 3, the significant results of the discovery stage are shown in Supplementary Table S1, and the cohort-specific results are listed in Supplementary Table S2. In total, all but one site identified in the discovery analysis were successfully replicated. Detailed annotation of the replicated CpGs is shown in Supplementary Table S3.
CpG Sites Significantly Associated with Thyroid Function After the Replication Stage
The effect estimates and p-values of the discovery and replication combined meta-analysis are provided.
Known association.
As indicated by the Chicago plots, all replicated sites were associated with higher methylation for higher TSH (Fig. 2) and with lower methylation for both higher fT4 (Fig. 3) and fT3 (Fig. 4).
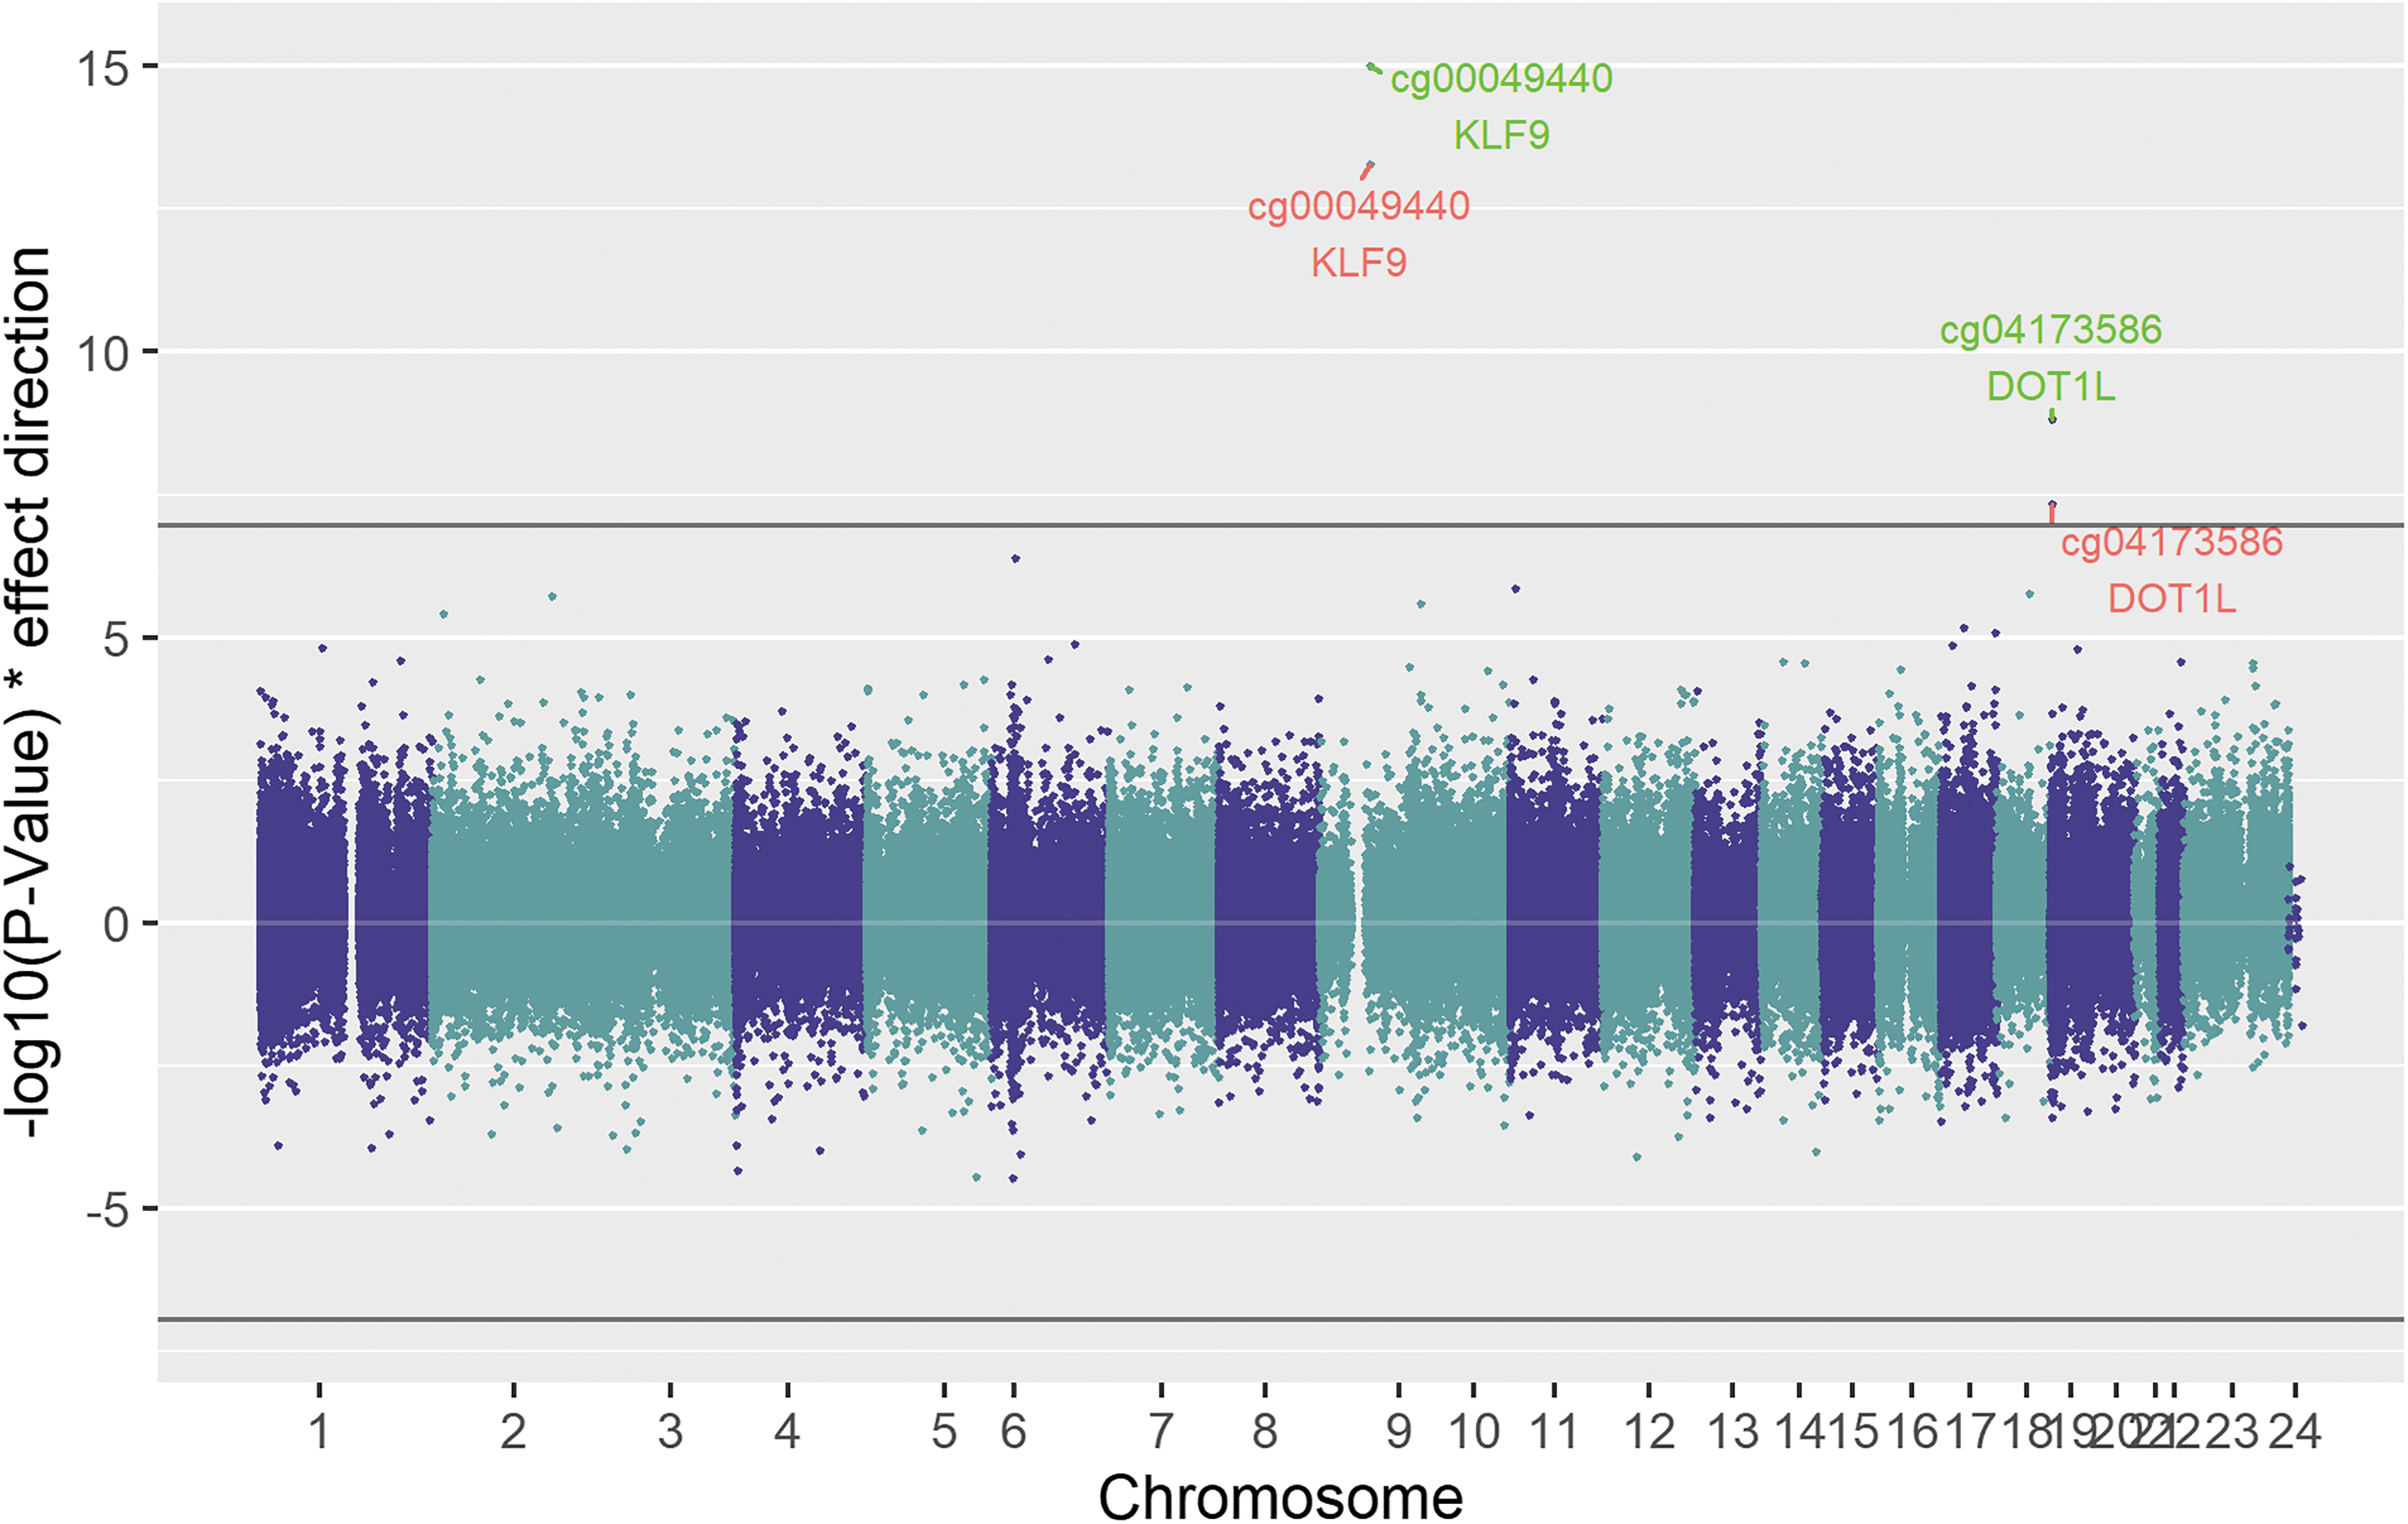
Chicago plot showing the results of the TSH discovery analysis. Red labels show the significant sites (p-value <1.1E-07) of the discovery analysis, while green labels show results of the combined analysis. The black line shows the epigenome-wide significance cutoff (1.1E-07). Points plotted in the upper panel show a positive correlation with TSH, while those plotted below have a negative association. TSH, thyrotropin.
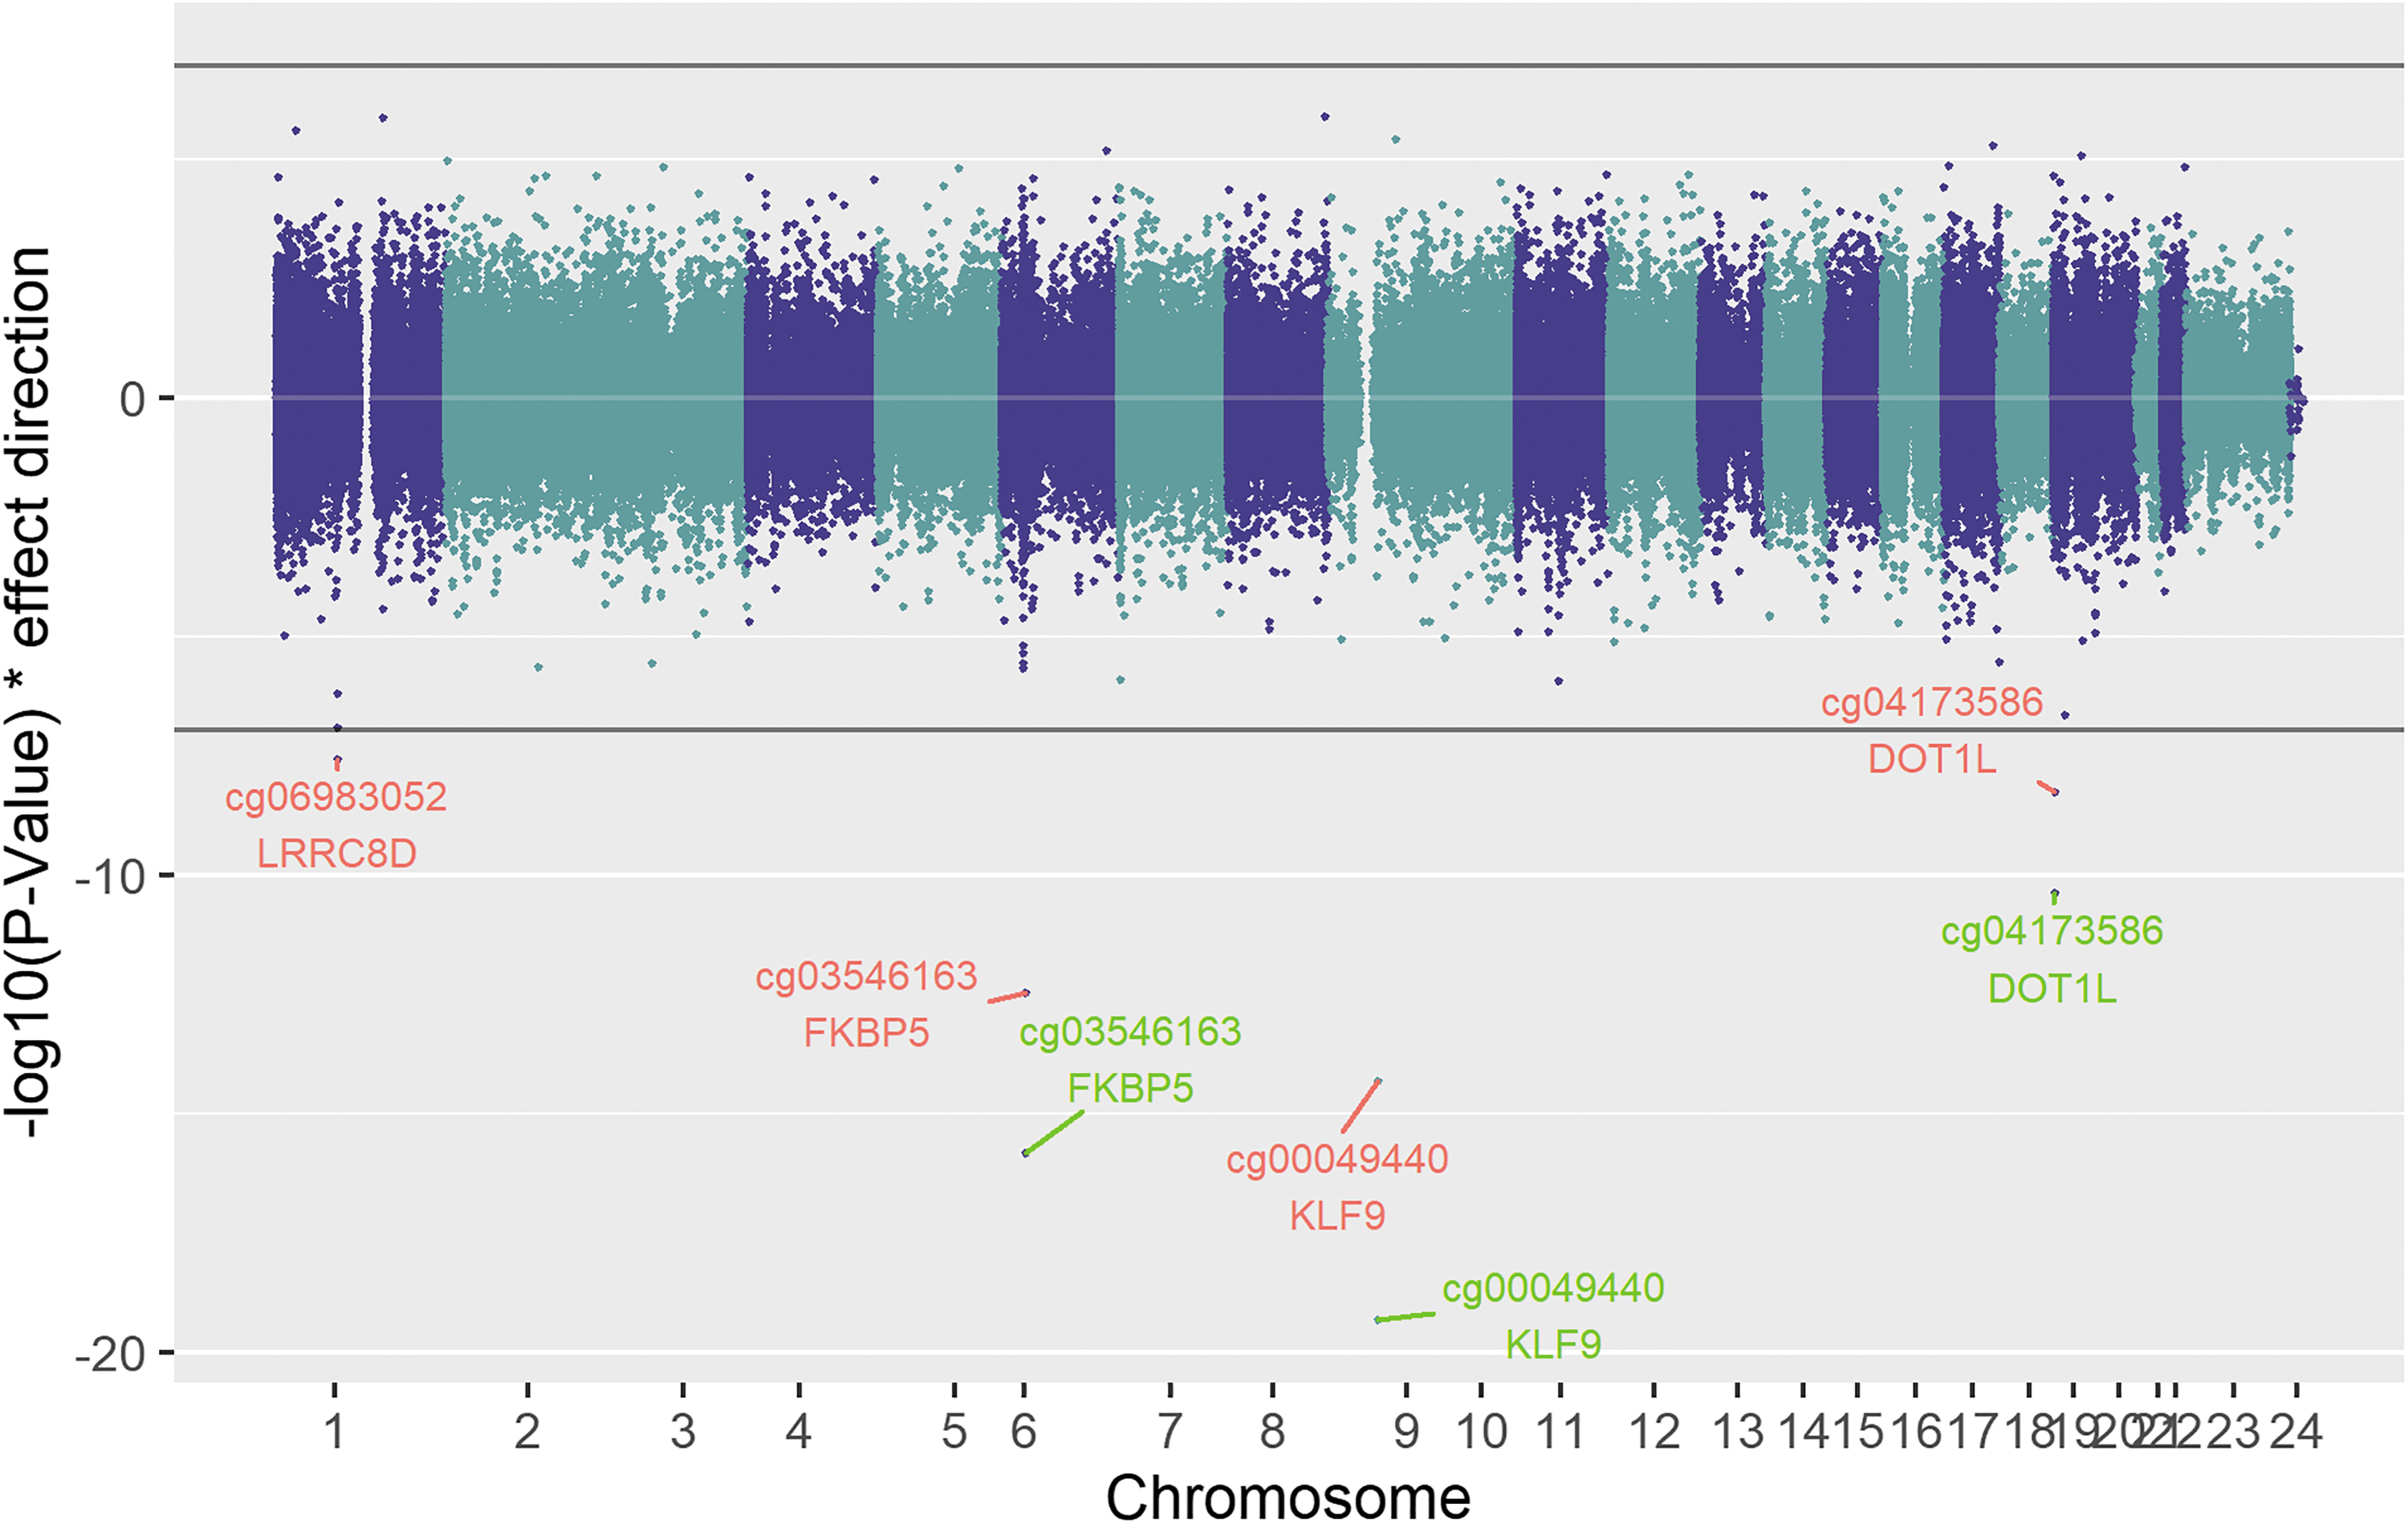
Chicago plot showing the results of the fT4 discovery analysis. Red labels show the significant sites (p-value <1.1E-07) of the discovery analysis, while green labels show results of the combined analysis. The black line shows the epigenome-wide significance cutoff (1.1E-07). Points plotted in the upper panel show a positive correlation with fT4, while those plotted below have a negative association. fT4, free thyroxine.
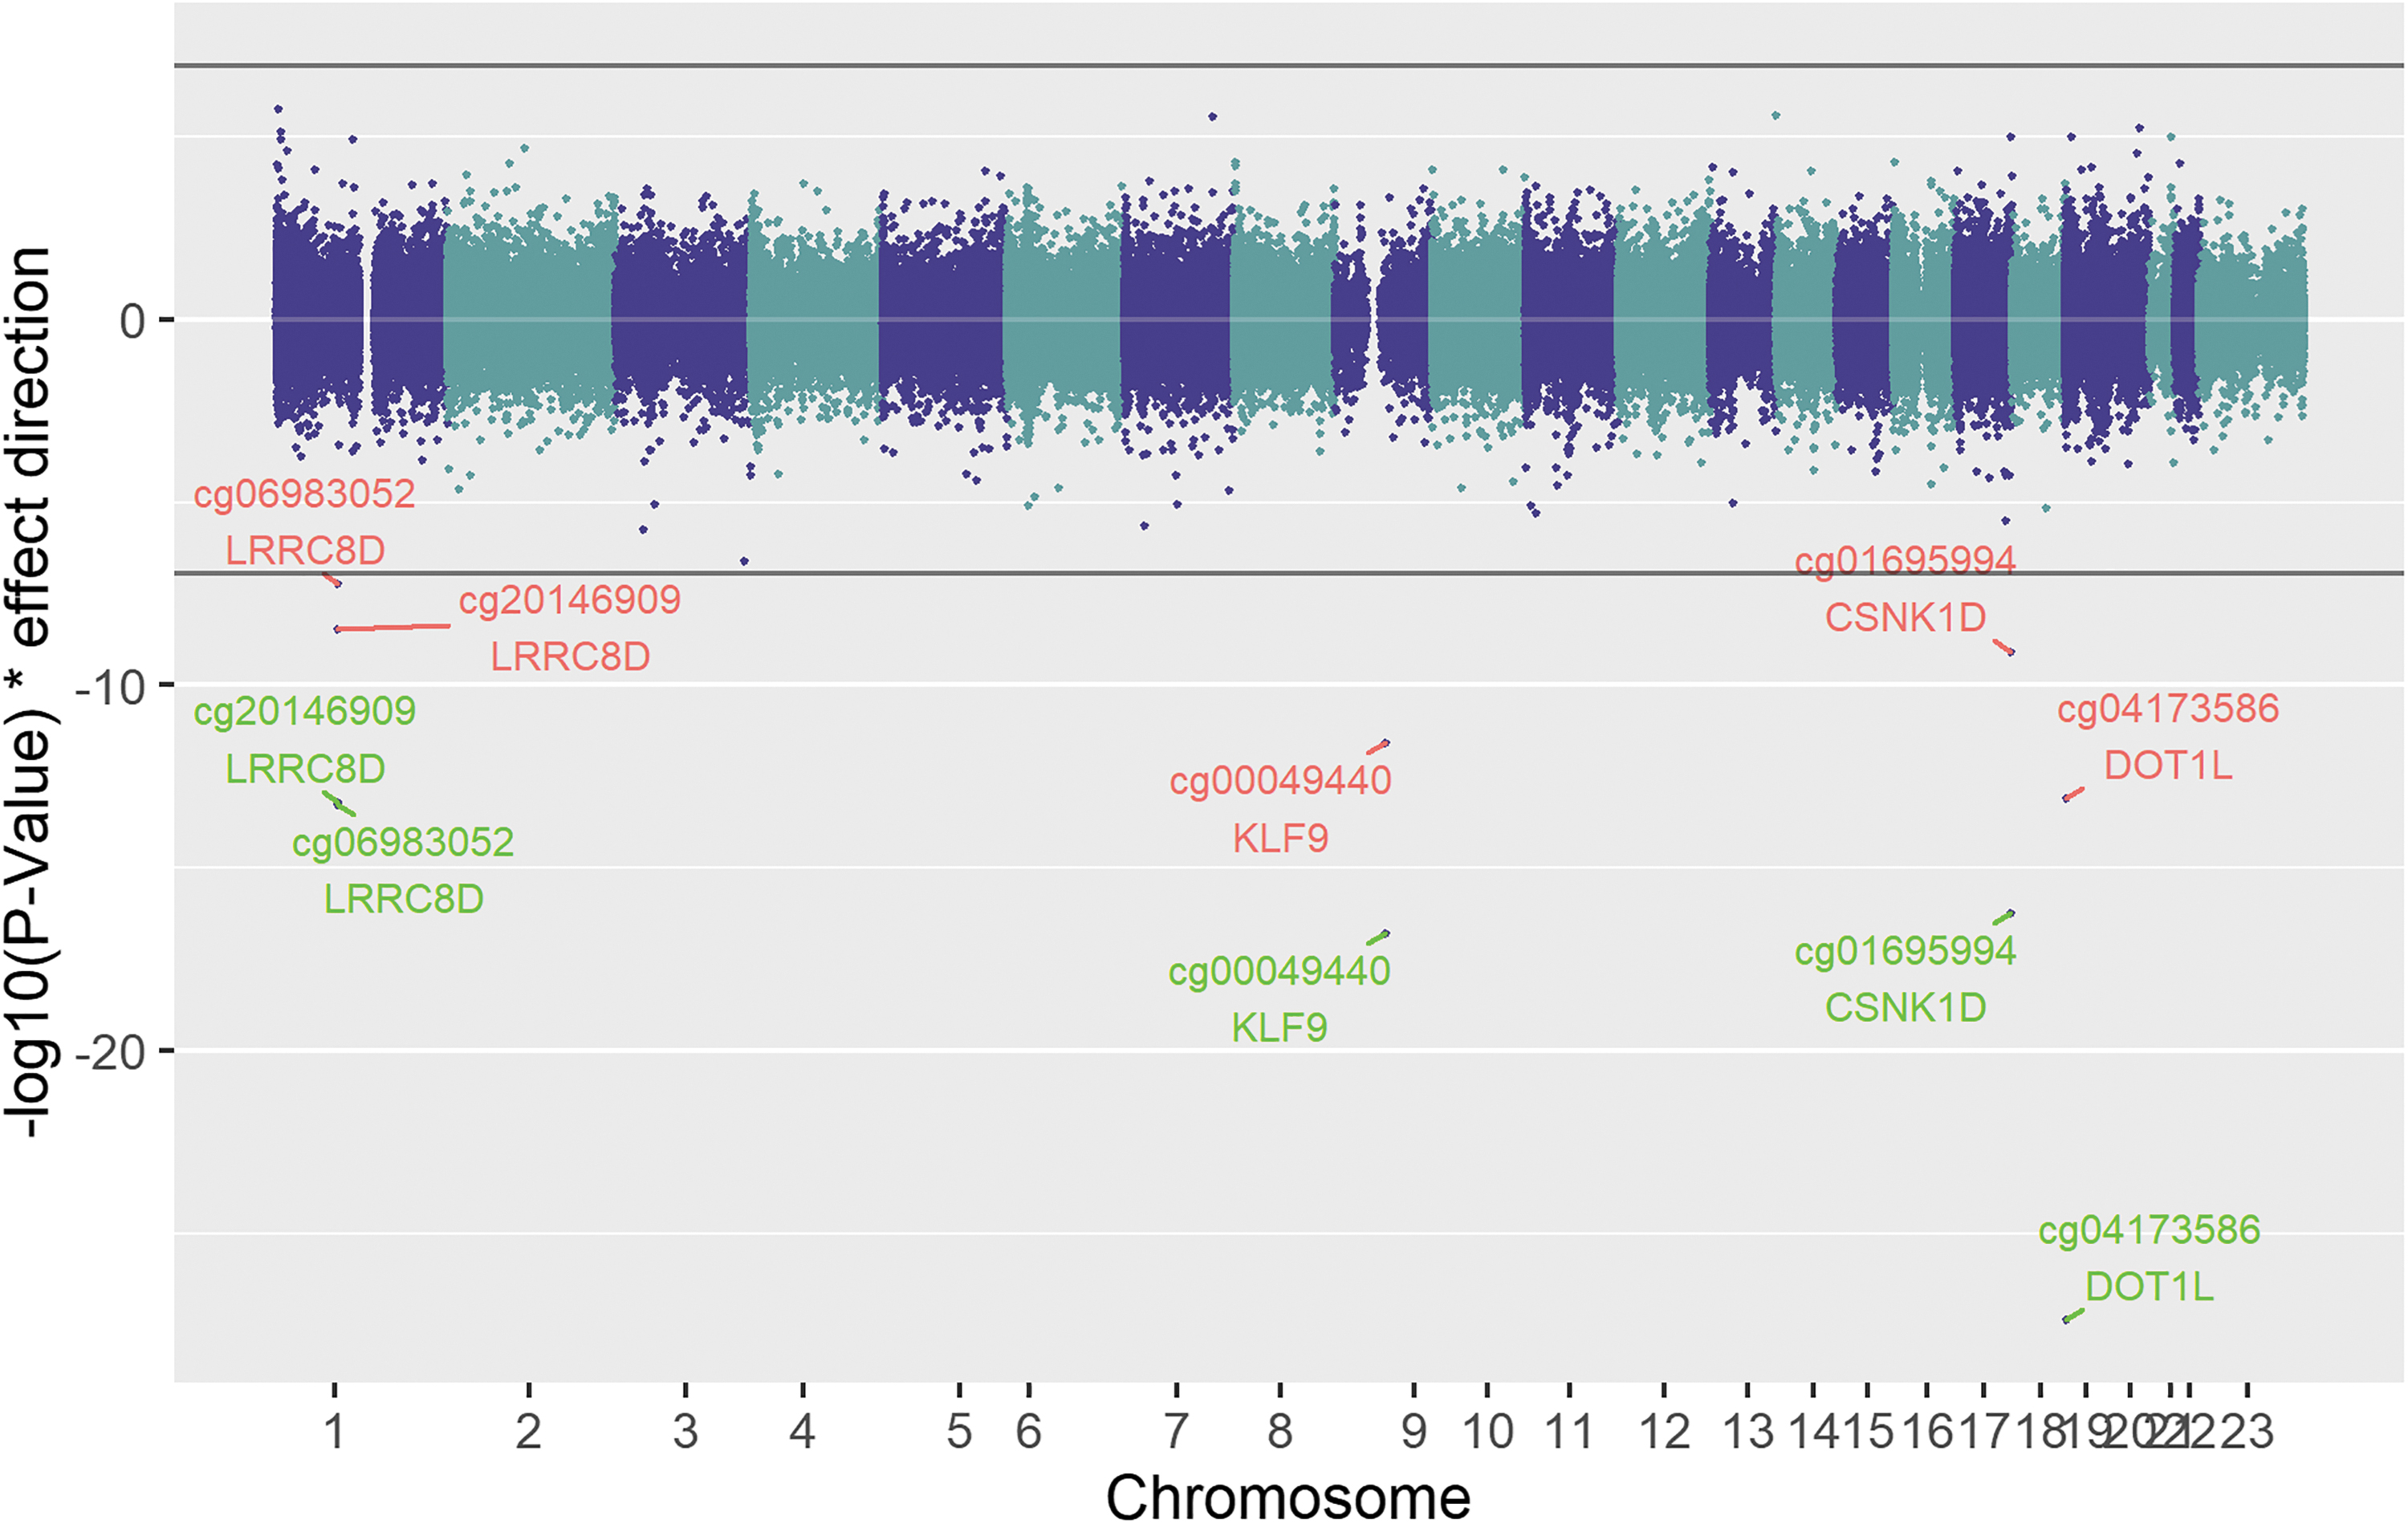
Chicago plot showing the results of the fT3 discovery analysis. Red labels show the significant sites (p-value <1.1E-07) of the discovery analysis, while green labels show results of the combined analysis. The black line shows the epigenome-wide significance cutoff (1.1E-07). Points plotted in the upper panel show a positive correlation with fT3, while those plotted below have a negative association. fT3, free triiodothyronine.
In detail, the TSH meta-analysis revealed two associations cg00049440 (β combined = 0.13; p-value = 9.57E-16) and cg04173586 (β combined = 0.07; p-value = 1.53E-09). The CpG site cg00049440 is located inside a promotor region in intron 1 of the KLF9 gene (Supplementary Fig. S3), and cg04173586 is located in intron 1 of DOT1L (Supplementary Fig. S4).
The fT4 analysis identified three sites (cg00049440, cg03546163, and cg04173586), two of which, namely cg00049440 in KLF9 (β combined = −0.75; p-value = 4.44E-20; Supplementary Fig. S5) and cg04173586 in DOT1L (β combined = −0.43; p-value = 4.03E-11; Supplementary Fig. S6), were also identified in the TSH analysis. The additional association is cg03546163 (β combined = −0.84; p-value = 1.45E-16), which lies within the second intron of FKBP5 (Supplementary Fig. S7).
The EWAS on fT3 identified five sites cg00049440, cg01695994, cg04173586, cg06983052, and cg20146909, two of which, namely cg00049440 (β combined = −1.46; p-value = 1.69E-17; Supplementary Fig. S8) and cg04173586 (β combined = −1.93; p-value = 4.33E-28; Supplementary Fig. S9), were also identified in the fT4 and TSH, and one CpG, namely cg06983052 (β combined = −1.04; p-value = 5.45E-14; Supplementary Fig. S10), was identified in the fT4 analysis (Supplementary Table S1). The remaining two sites are cg01695994 (β combined = −1.37; p-value = 5.84E-17), which is located 1518 bp downstream of LINC01970 and 14,809 bp upstream of CSNK1D (Supplementary Fig. S11), and cg20146909 (β combined = −1.04; p-value = 6.51E-14), which is located inside intron 1 of the gene LRRC8D (Supplementary Fig. S12).
The DNAm sites we identified for TSH, fT4, and fT3 were not colocated with SNPs or genes previously highlighted through GWAS of thyroid function.
Effects on gene expression in blood
As DNAm represents an important regulator of gene expression, we tested the association of the methylation levels of our replicated findings with mRNA levels in blood of nearby genes. Of all 146 CpG-mRNA associations tested, only cg00049440 passed the level of significance (FDR <0.05) and was negatively correlated with KLF9 gene expression (β = −0.109; p-value = 3.00E-7; Supplementary Table S4). The CpG cg00049440 is located in an island shore and in the promotor region of KLF9, and was associated with circulating TSH, fT3, and fT4 levels.
Overlap of DNAm sites with thyroid hormone receptor binding sites
Except for cg20146909, all CpGs that were associated with thyroid function fall in promoters and enhancer regions shared between several tissues including blood, liver, and brain (Supplementary Table S3). As thyroid hormone receptor footprints are dynamic, capable of chromatin remodeling and dependent on thyroid hormones levels, 25,26 we furthermore studied whether DNAm sites associated with fT4, fT3, and TSH fall in thyroid hormone receptor binding sites in liver and neural cells where the data were available (see the Materials and Methods section). The cg01695994 at CSNK1D/LINC01970 overlapped with thyroid hormone receptor alpha binding peaks in liver cells. We did not identify any other overlap between thyroid hormone receptor binding site peaks and our six significant DNAm sites (distance between 517 and 2219 bp; Supplementary Table S3). This could be either because of tissue specificity or because there are more complex relationships between thyroid hormone levels and DNAm.
Impacts of genetic variation on thyroid-DNAm sites
The total additive heritability of individual DNAm levels (h 2 ) at our six significant CpG sites is above 25% (cg06983052) and up to 57% (cg06983052) in blood (Supplementary Table S3). DNAm heritability estimates at cg00049440 and cg03546163 were explained by 72% and 100% of common genetic variants in the genome (h 2 SNPs/h 2 ), respectively. 18 However, the proportion of heritability explained by common genetic variants for the five remaining signals was less than 30% and near 0% for cg04173586.
Using mQTL results identified in GoDMC,
19
several independent cis and trans genetic variants impact the blood DNAm levels of all significant CpG sites except DOT1L (Supplementary Table S5). Interestingly, DNAm levels at cg00049440 (KLF9) and cg03546163 (FKBP5) were significantly associated with several genetic variants in trans located in an intronic region of the THRB gene (rs9310736 and rs869785), which encodes the nuclear hormone receptor for triiodothyronine. However, none of these variants were identified in thyroid hormone GWAS
21,27
or as eQTLs in the GTEx database (
Causal effects of thyroid status on DNAm
We conducted an MR analysis to test if variation in TSH and fT4 causally affects the changes in DNAm of the replicated EWAS findings. MR is a framework using SNPs as instrumental variables to assess an unconfounded exposure–outcome association and thus allowing a causal inference. 28,29 To maximize statistical power, we applied a two-sample MR using published large-scale GWAS results for selecting instruments for TSH and fT4 as exposure. Because no instruments for fT3 from former GWAS were available, no causal effects of triiodothyronine on DNAm as outcome could be assessed. The MR results revealed a significant effect of genetically determined TSH levels on cg00049440 at KLF9 (β = 0.005; p-value = 0.01). The MR-Egger and the weighted median MR analysis were nominally significant with the same effect directions and similar effect sizes underpinning the robustness of the findings. No heterogeneity (Q-statistics p-value = 0.35) or directional pleiotropy (MR-Egger intercept p-value = 0.33) being both indicators of wrong instruments was detected.
All MR results of the second TSH-associated CpG site as well as the fT4-associated sites had p-values >0.05 (Supplementary Table S6). As an additional sensitivity analysis addressing potential horizontal pleiotropy through associations with thyroperoxidase (TPO), we removed instruments that were associated (p-value <0.05) with TPO antibody positivity in a recent GWAS. 30 After excluding five TPO-associated SNPs for TSH, significance changed only for the weighted median MR result for TSH on cg00049440 to p-value = 0.06 with a similar effect estimate. No instruments needed to be excluded for the MR of fT4 (Supplementary Table S6).
Discussion
In the current analyses, we revealed three significantly associated CpGs for fT4, five for fT3, and two for TSH. An overview of our findings in relation to known mechanisms is illustrated in Figure 5. Additionally to the known associations between fT3 and Krueppel-like factor 9 (KLF9) and DOT1-like histone lysine methyltransferase (DOT1L)-related CpG sites, 5 we found de novo associations regarding TSH and fT4 with effect directions consistent with hypothalamic–pituitary–thyroid axis physiology (i.e., opposite effects for TSH and fT4/fT3).
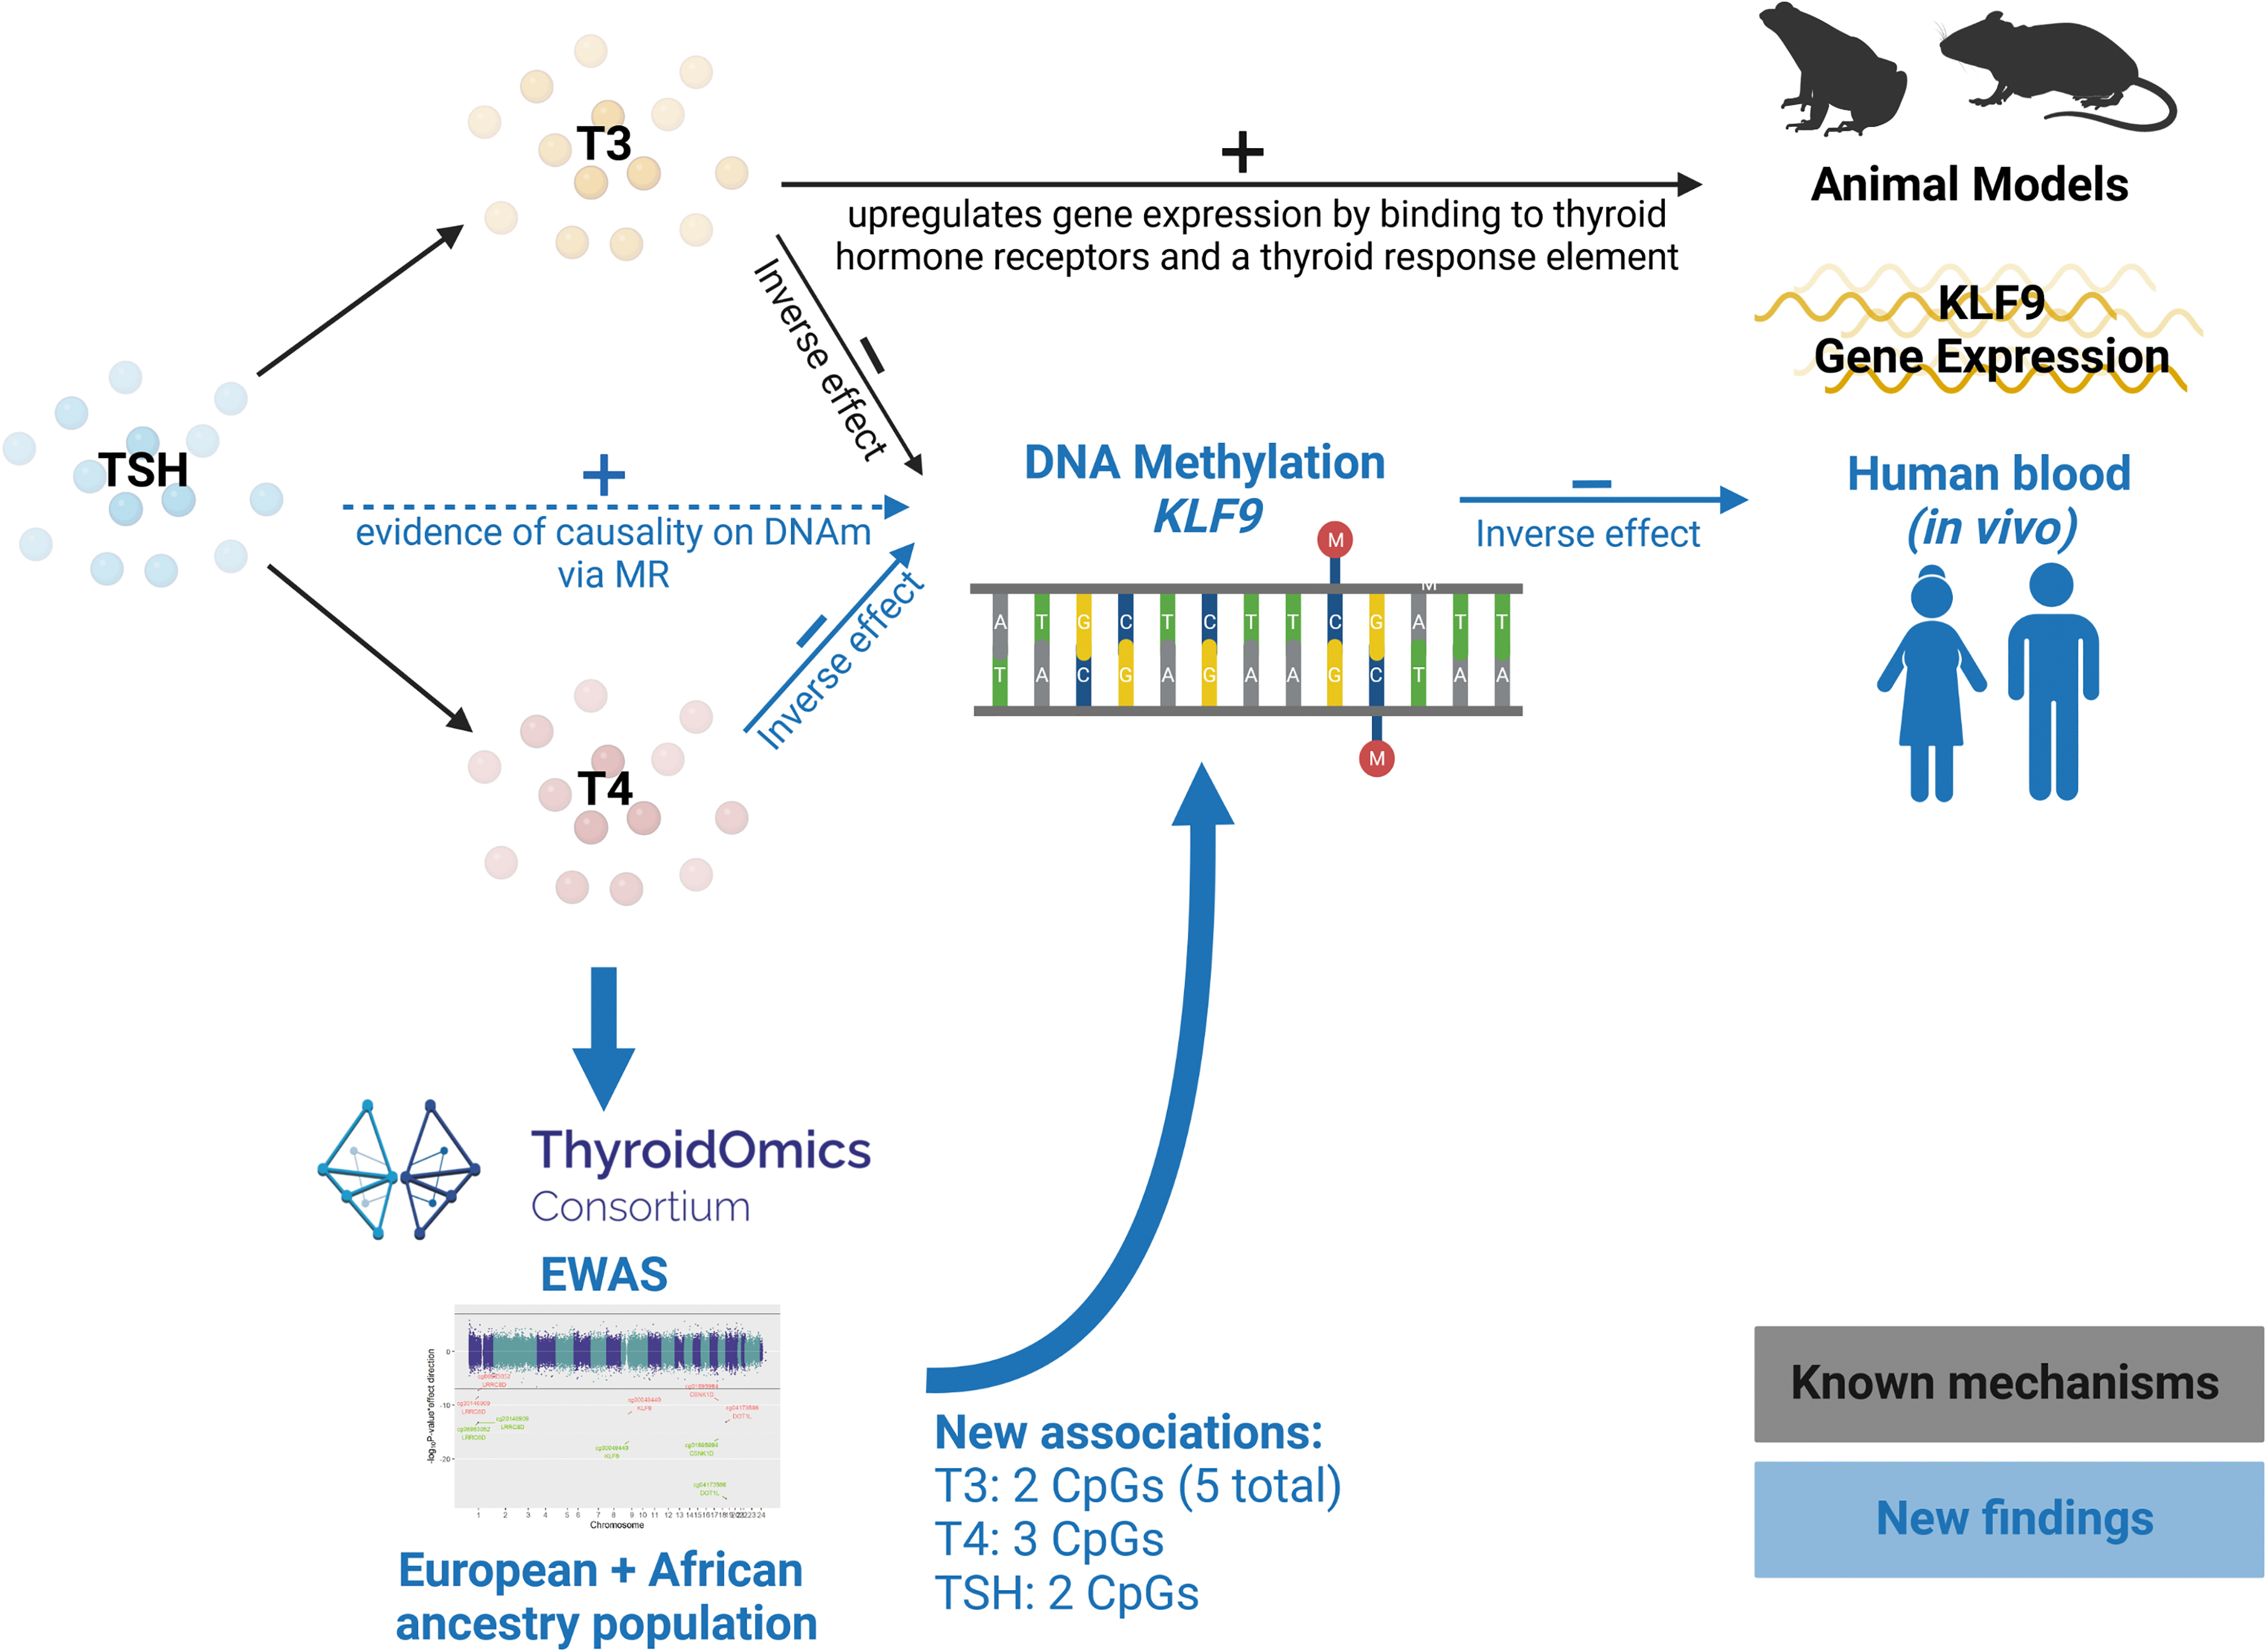
Overview of the study analyses and findings. Known mechanisms and associations are colored in black, and new findings revealed by this study are marked in blue color. Image created with BioRender.com
The ubiquitously expressed KLF9 gene is part of the Sp1 C2H2-type zinc finger transcription factor family that binds to GC box elements located in the promotor (NCBI RefSeq database). KLF9 was found to be a triiodothyronine response gene in mice 26 and frogs, 31 where triiodothyronine regulated gene expression by binding to and activating thyroid hormone receptors, which in turn regulate KLF9 transcription via the thyroid response element. 26 Furthermore, there is evidence that this mechanism is also present in human cells including hepatocytes 32 and neural cells. 33 Our KLF9 findings exemplify how thyroid function affects gene expression via DNAm in humans. In particular, we found that higher thyroid hormone levels (with physiologically fitting lower TSH levels) were associated with lower DNAm levels at cg00049440, located in the promotor region of KLF9, which in turn was associated with increased KLF9 expression in blood cells (Fig. 5).
Importantly, the causality in this cascade was supported by MR analyses showing directionally consistent associations with genetically determined TSH levels. Previous studies showed no overlap between variants detected in TSH and fT4 GWAS, 21 while MR analyses showed that well-known thyroid status-related endpoints such as cholesterol levels and atrial fibrillation were associated with TSH but not with fT4 variants. 34,35 This strongly suggests that TSH-associated genetic variants are a more valid representation of thyroid function, which likely explains the absence of associations in our fT4 MR analyses.
We hereby show in humans that next to the known pathway via binding to thyroid hormone receptor beta on a response element in the KLF9 promoter, thyroid hormones can also affect KLF9 gene expression via KLF9 DNAm (Fig. 5). In this context, it is noteworthy to mention that in a study in developing Xenopus brain, triiodothyronine has been shown to promote DNA demethylation. This is in part by promoting TET3 recruitment to discrete genomic regions, and in part by inducing genes that encode DNA demethylation enzymes. 36
The second multi-trait association, DOT1L, represents a ubiquitously expressed gene coding for a methyltransferase that methylates lysine-79 of histone H3. A link to thyroid hormones was found in Xenopus laevis where triiodothyronine induces Dot1L expression during metamorphosis. 37 Our study partially translates these results to humans, where the thyroid function-associated CpG cg04173586 is located in an enhancer region. However, the correlation of DNAm with DOT1L mRNA levels in 699 blood tissue samples was not significant.
This points to a limitation of our study as blood represents only one of the possible target tissues for both DNAm and gene expression analyses. Additionally, the sample size might have been too small to achieve the required statistical power, although the effect direction suggests an inverse association (Supplementary Table S4). The advantage of correlating both measured DNAm and mRNA is that this approach does not depend on the availability of known genetic factors needed to predict these measurements in alternative approaches such as colocalization.
In addition to two new and three known associations with fT3 revealed in our study, the remaining three associations discovered in the study of Lafontaine et al 5 were statistically significant (p < 0.05/6) in our EWAS. Considering that our replication cohort for fT3 was also included in Lafontaine et al, we restricted this lookup to the discovery stage results (Supplementary Table S7) providing an independent sample set.
Of note, the CpG cg20146909 in LRRC8D that was associated with fT3 in our study was suggestive of an association with the study by Lafontaine et al. 5 Thus, we confirmed this candidate and revealed a second site in this gene, namely cg06983052, that was associated with both fT3 and fT4.
The two previously reported TSH associations at FOXK2 and the lnRNA AC012506.1 were not replicated in our study (Supplementary Table S7). This could be because the previous findings were false positive results, or because these associations are specific to adolescents or young adults who accounted for most participants in the former study.
In addition to data sets from European ancestry, our study also included a substantial proportion of DNAm data of African ancestry individuals via the ARIC cohort. However, no ancestry-specific heterogeneity of the effect estimates was observed for our replicated EWAS results (Supplementary Table S2 and Supplementary Fig. S13).
In conclusion, we conducted an EWAS by developing and applying a standardized analyses and quality control workflow in a large sample of both European and African ancestry individuals, replicated the statistically significant associations in independent cohorts, and characterized the findings by integrating multiple types of -omics data. Our study revealed DNAm associated with thyroid function at five distinct loci. In particular, we showed that DNAm is another previously unknown route underlying thyroid hormone-induced KLF9 expression, which is a well-known thyroid hormone household gene. This study serves as a proof-of-concept that integration of EWAS with other -omics data can provide a valuable tool to unravel thyroid hormone signaling in humans by complementing and feeding classical in vitro and animal studies.
Footnotes
Authors' Contributions
Project design: A.Te., J.T.B., L.C., M.M., R.P.P., and T.C.M. Data collection: A.F.M., C.G., C.M., D.v.H., E.P.S., H.G., H.J.G., H.P., J.P.W., J.T.B., M.F., M.N., M.R., M.W., N.G.M., P.J.C., S.E.H., S.G.W., and S.R.C. Cohort study management: A.P., A.U., C.M., E.P.S., H.V., J.B.J.v.M., J.T.B., M.B., M.F., M.N., N.G.M., R.P.P., S.R.C., and T.C.M. Subject recruitment: C.M., H.V., N.G.M., and S.R.C. Drafting of the article: A.Te., A.W., and T.C.M. Interpretation of results: A.K., A.Te., A.W., E.S., J.N., J.P.W., J.T.B., M.M., S.G.W., and T.C.M. Statistical methods and analysis: A.F.M., A.Te., A.Ti., A.W., B.K., B.R.S., D.L.M., J.N., K.V.E.B., L.C., P.J.C., P.-C.T., R.E.M., S.E.H., and T.C.M. Critical review of the article: A.F.M., A.K., A.P., A.Te., A.Ti., A.U., A.W., B.K., B.R.S., C.G., C.M., D.L.M., D.v.H., E.P.S., E.S., W.E.V., H.G., H.J.G., H.P., H.V., J.B.J.v.M., J.N., J.P.W., J.T.B., K.V.E.B., L.C., M.B., M.F., M.M., M.N., M.R., M.W., N.G.M., P.J.C., P.-C.T., R.E.M., R.P.P., S.E.H., S.G.W., S.R.C., and T.C.M.
Author Disclosure Statement
H.J.G. has received travel grants and speakers honoraria from Fresenius Medical Care, Neuraxpharm, Servier, and Janssen Cilag as well as research funding from Fresenius Medical Care not related to this work. R.E.M. has received speaker fees from Illumina and is an advisor to the Epigenetic Clock Development Foundation. All other authors declare no conflicts of interest.
Funding Information
Acknowledgements and funding sources are listed in the Supplementary Note section in the Supplementary Data.
Supplementary Material
Supplementary Data