
Abstract
Background:
The prevalence of hypothyroidism (HT) has increased over time. To assess the effectiveness of treatment, we (1) studied thyrotropin (TSH) levels among patients receiving levothyroxine (LT4) and (2) determined the percentages of patients switching among LT4 formulations.
Methods:
Data on patients with HT receiving LT4 from the Optum™ Clinical and Claims Database were analyzed from March 2013 through February 2020. Eligible adult patients had ≥1 medical claim with an HT diagnosis and all patients were observed for ≥12 months. Patients included in Objective 1 were indexed on a randomly selected TSH result and had ≥2 results for TSH 1–15 months apart. Patients included in Objective 2 were indexed on a randomly selected LT4 pharmacy claim and had ≥2 LT4 claims ≥1 month apart and ≥1 claim during follow-up. Outcomes were the proportion of patients with low, normal, or high (<0.45, 0.45–4.5, or >4.5 mIU/L, respectively) TSH levels and the proportion of patients switching LT4 formulations, respectively. Data were stratified by age group, sex, and insurance type. All data reported were analyzed using descriptive statistics.
Results:
Of patients who were in the indexed TSH group, 81.1% [confidence intervals: 80.4–81.8; n/N = 9130/11,259] achieved normal TSH values. When stratified by age group, sex, and insurance type, ≥70% of patients in each of these subgroups exhibited normal mean TSH values at follow-up. For Objective 2 (N = 25,076), 24.9% (N = 6238) of the LT4-indexed group had ≥1 formulation switch in 12 months, of which 67.3% only switched once, and 41.4% (N = 10,370) had ≥1 formulation switch in up to 24 months. A significantly higher proportion of Medicare vs. commercially insured patients had switched formulations (26.2% vs. 23.1%, p < 0.001).
Conclusions:
Most LT4-treated patients maintain normal TSH levels, which is an improvement vs. previous reports. Continued physician engagement and patient education are advised to further reduce the number of patients who maintain off-target TSH levels. Contrary to clinical recommendations, about 25% of patients receiving LT4 switched formulations within 1 year, with >40% switching within 2 years; among patients who switched, most only switched once.
Introduction
Hypothyroidism (HT) is a condition resulting from insufficient circulating levels of thyroid hormones. It affects virtually every tissue in the body, impairing cognition, mood, and homeostasis. 1 Today's standard of care is treatment with synthetic levothyroxine (LT4) monotherapy, which, after physiological conversion to triiodothyronine, effectively resolves symptoms of overt HT in most patients. 2,3
Treatment efficacy with LT4 depends on its steady delivery to the body through daily tablets taken by mouth. Ideally, all patients on LT4 take their medications as prescribed and without interruption; however, real-world treatment adherence may be suboptimal for many patients and varying bioavailability of LT4 in tablet formulations can also impact the LT4 dose delivered. This may prolong the process of determining optimal treatment dose and normalization of thyrotropin (TSH) levels. Maintaining an off-target LT4 dose may have important clinical implications. 4 Overtreatment has been associated with increased risk of atrial fibrillation and other cardiovascular events, as well as osteopenia, osteoporosis, and bone fractures 4 ; undertreatment may result in weight gain, hyperlipidemia, and residual HT symptoms. 1
There has been increased awareness of the impacts of suboptimal treatment, wherein patients maintain abnormal TSH levels despite receiving treatment. Indeed, several studies have demonstrated ∼32–48% of patients receiving treatment did not achieve normal TSH values. 5 –8 As such, current guidelines have been revised to highlight the importance of optimal dosing and frequent follow-up to help combat this. 2 These changes are reflected in a recent retrospective matched cohort study conducted by Kaiser Permanente in which only 79% of 435 patients on LT4 had TSH values within normal range. 9
This study assessed two objectives using data from patients with HT in the United States from an administrative claims and linked electronic health records (EHR) database. The first objective was to assess TSH levels among adult patients with HT receiving LT4. The second objective was to determine percentage of patients switching between LT4 formulations (i.e., branded to branded, generic to generic, or branded to generic).
Materials and Methods
Study design and patient selection
This retrospective observational study was conducted using the Optum
To be included in the TSH-indexed group (Objective 1; TSH-indexed group), patients had to have ≥2 laboratory results for TSH 1–15 months apart during the patient identification period; index date for patients was a randomly selected TSH laboratory result date. If multiple valid TSH results were obtained on the same date, these values were averaged to provide a single value per date. Patients also had ≥1 TSH result during treatment with LT4 during follow-up.
To be included in the LT4-indexed group (Objective 2; LT4-indexed group) patients had to have ≥2 pharmacy claims for LT4 therapy ≥1 month apart; index date was a randomly selected LT4 pharmacy claim date during the identification period. Eligible patients in the LT4-indexed group had ≥1 subsequent LT4 claims during follow-up.
A full description of patient selection methods and attrition for Objectives 1 (TSH-indexed group) and 2 (LT4-indexed group) are listed in Figures 1 and 2, respectively; full attrition tables, including percents excluded, are listed in Supplementary Tables S1 and S2. In brief, all patients were aged ≥18 years in the index year, had ≥12 months' continuous health plan enrollment before index date (i.e., baseline period), and ≥1 medical claim with an HT diagnosis in the baseline period (complete list of International Classification of Diseases, 9th or 10th edition, codes for HT diagnosis are listed in Supplementary Table S3). Patients with thyroid cancer and those who were pregnant or had recently given birth were excluded. All patients were observed post-index for a 12-month minimum and up to 24 months, to end of study period, end of continuous health plan enrollment, end of EHR clinical activity, or death, whichever occurred first (i.e., follow-up period).
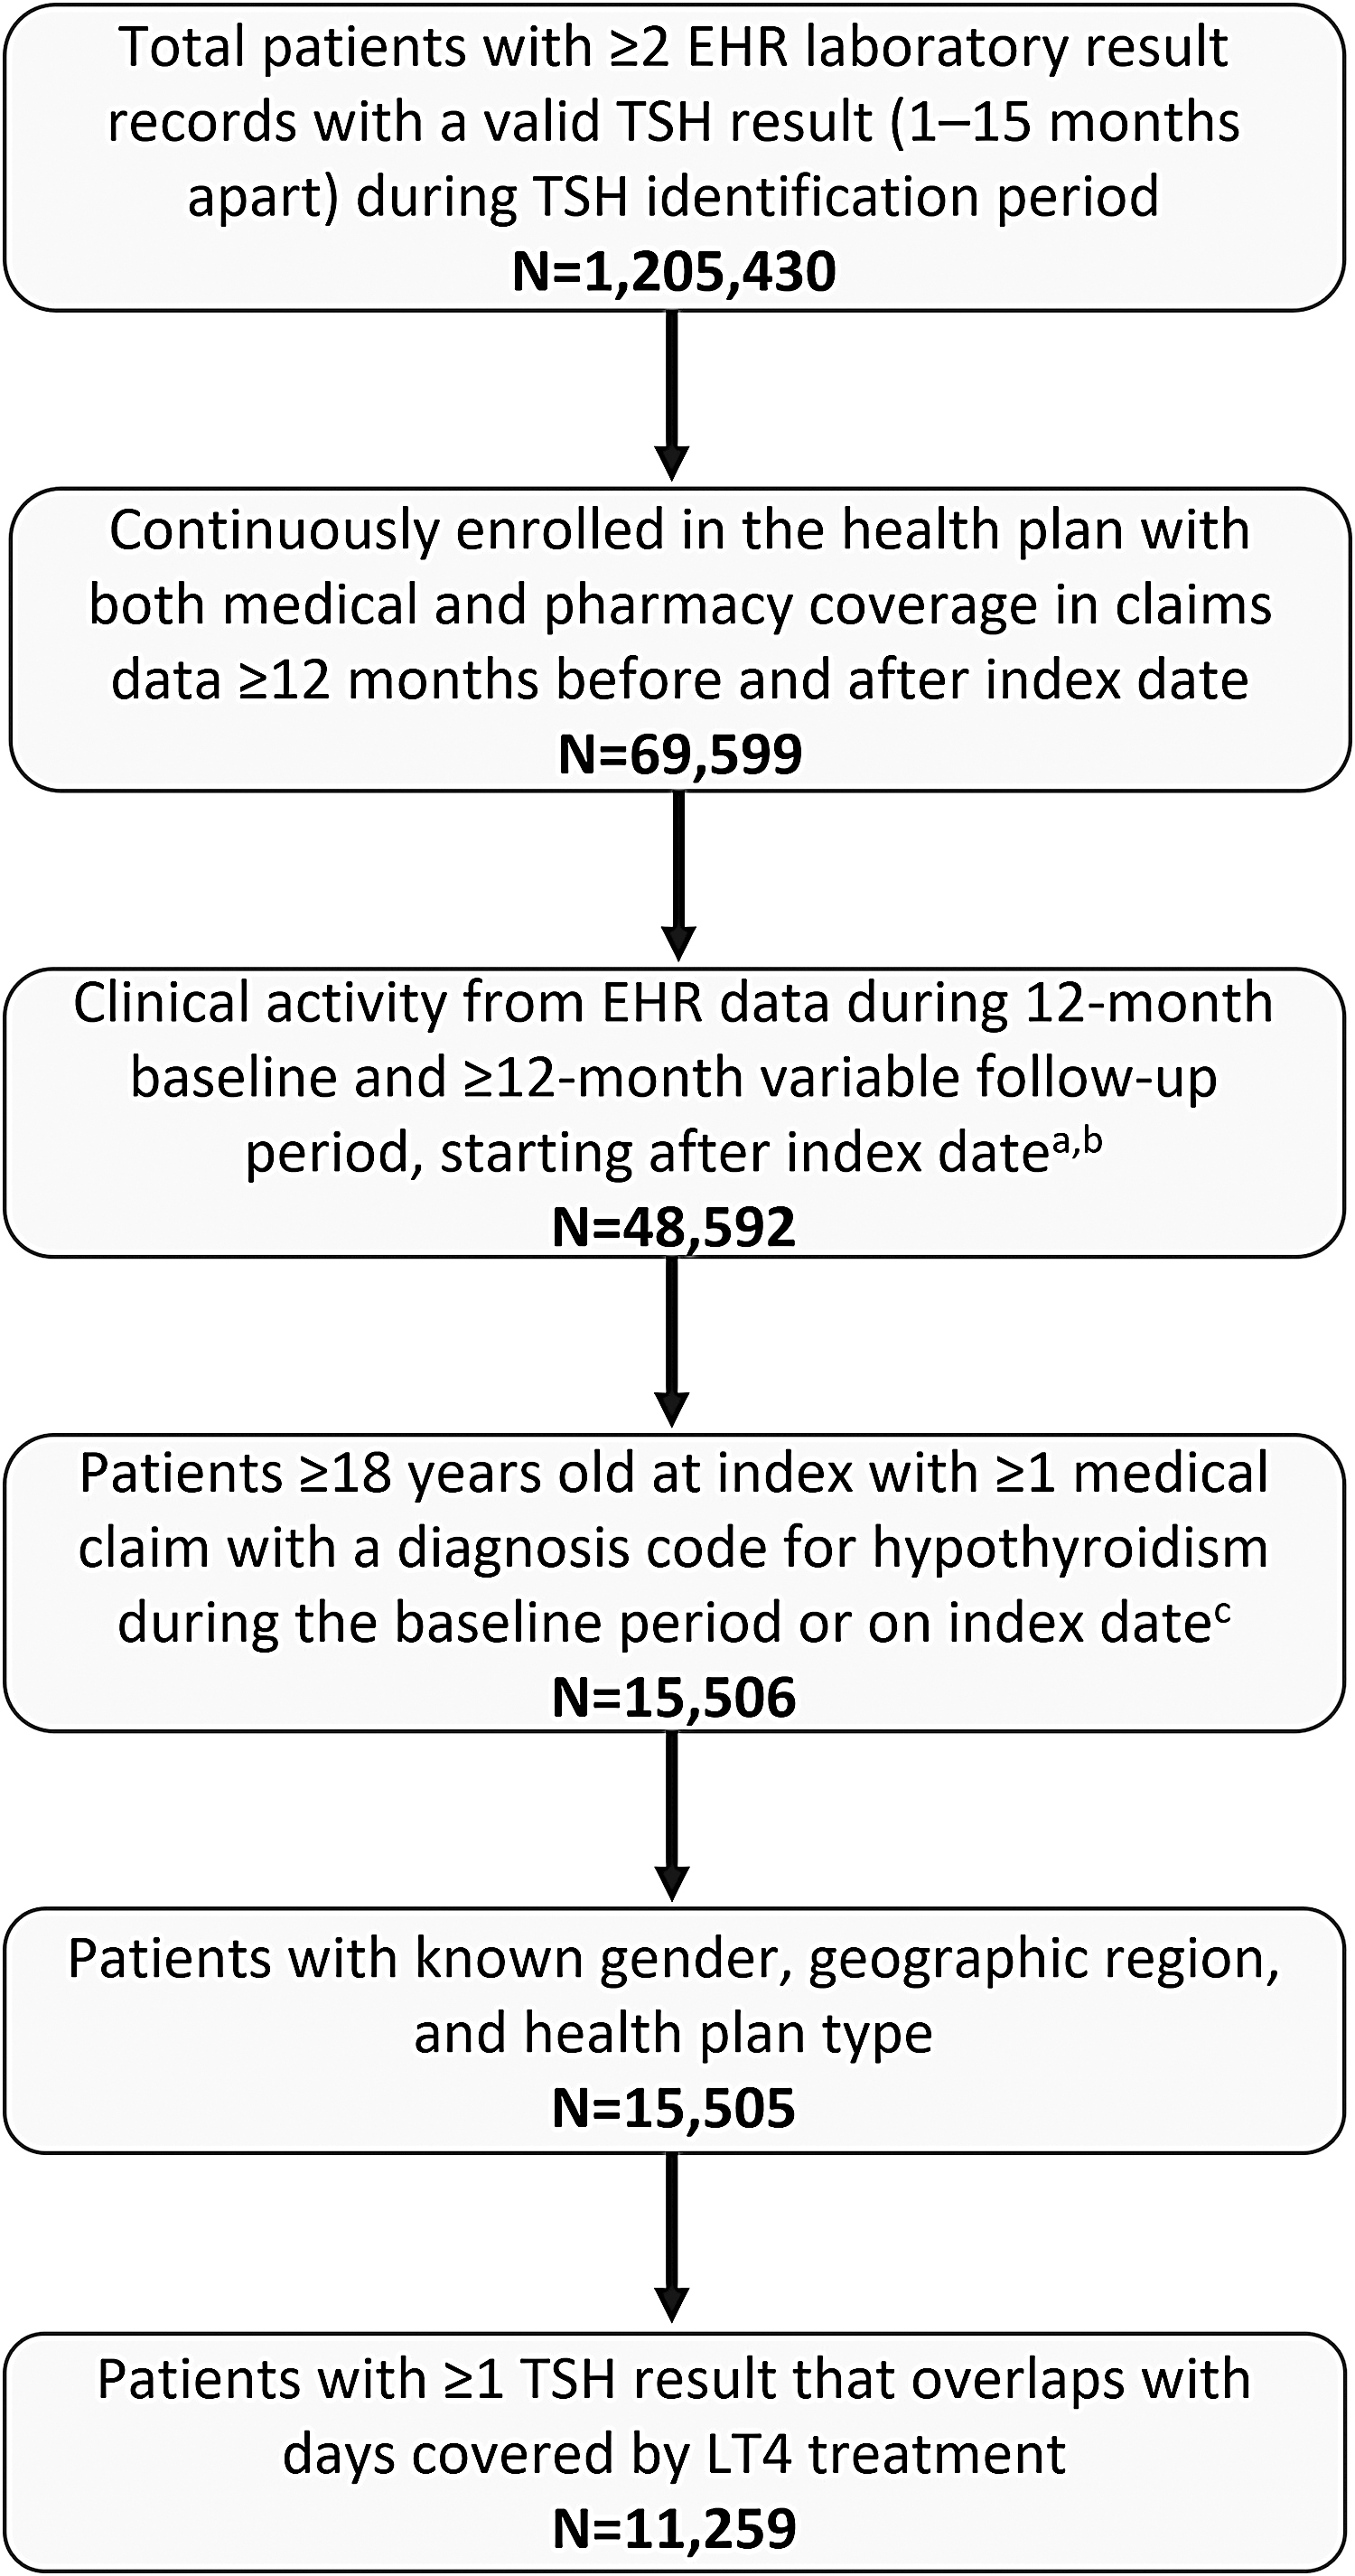
Patient selection and attrition: TSH-indexed group. Study period: March 01, 2013 through February 29, 2020. TSH identification period: March 01, 2014 through February 28, 2019. aClinical activity was defined as ≥1 record from the EHR database (e.g., diagnosis, procedure, and medication) that signaled that the patient was seen by the provider during a baseline or follow-up visit. bAll patients have clinical/EHR record on the first day of the follow-up period because a TSH laboratory result sets the index date; this criterion looked for ≥1 more EHR record after the index date through the end of the variable follow-up period. cExcludes patients with claims with diagnosis or procedure codes for pregnancy, labor, or delivery, as well as claims with a diagnosis code for thyroid cancer, during the baseline and follow-up periods. EHR, electronic health record; LT4, levothyroxine; TSH, thyrotropin.
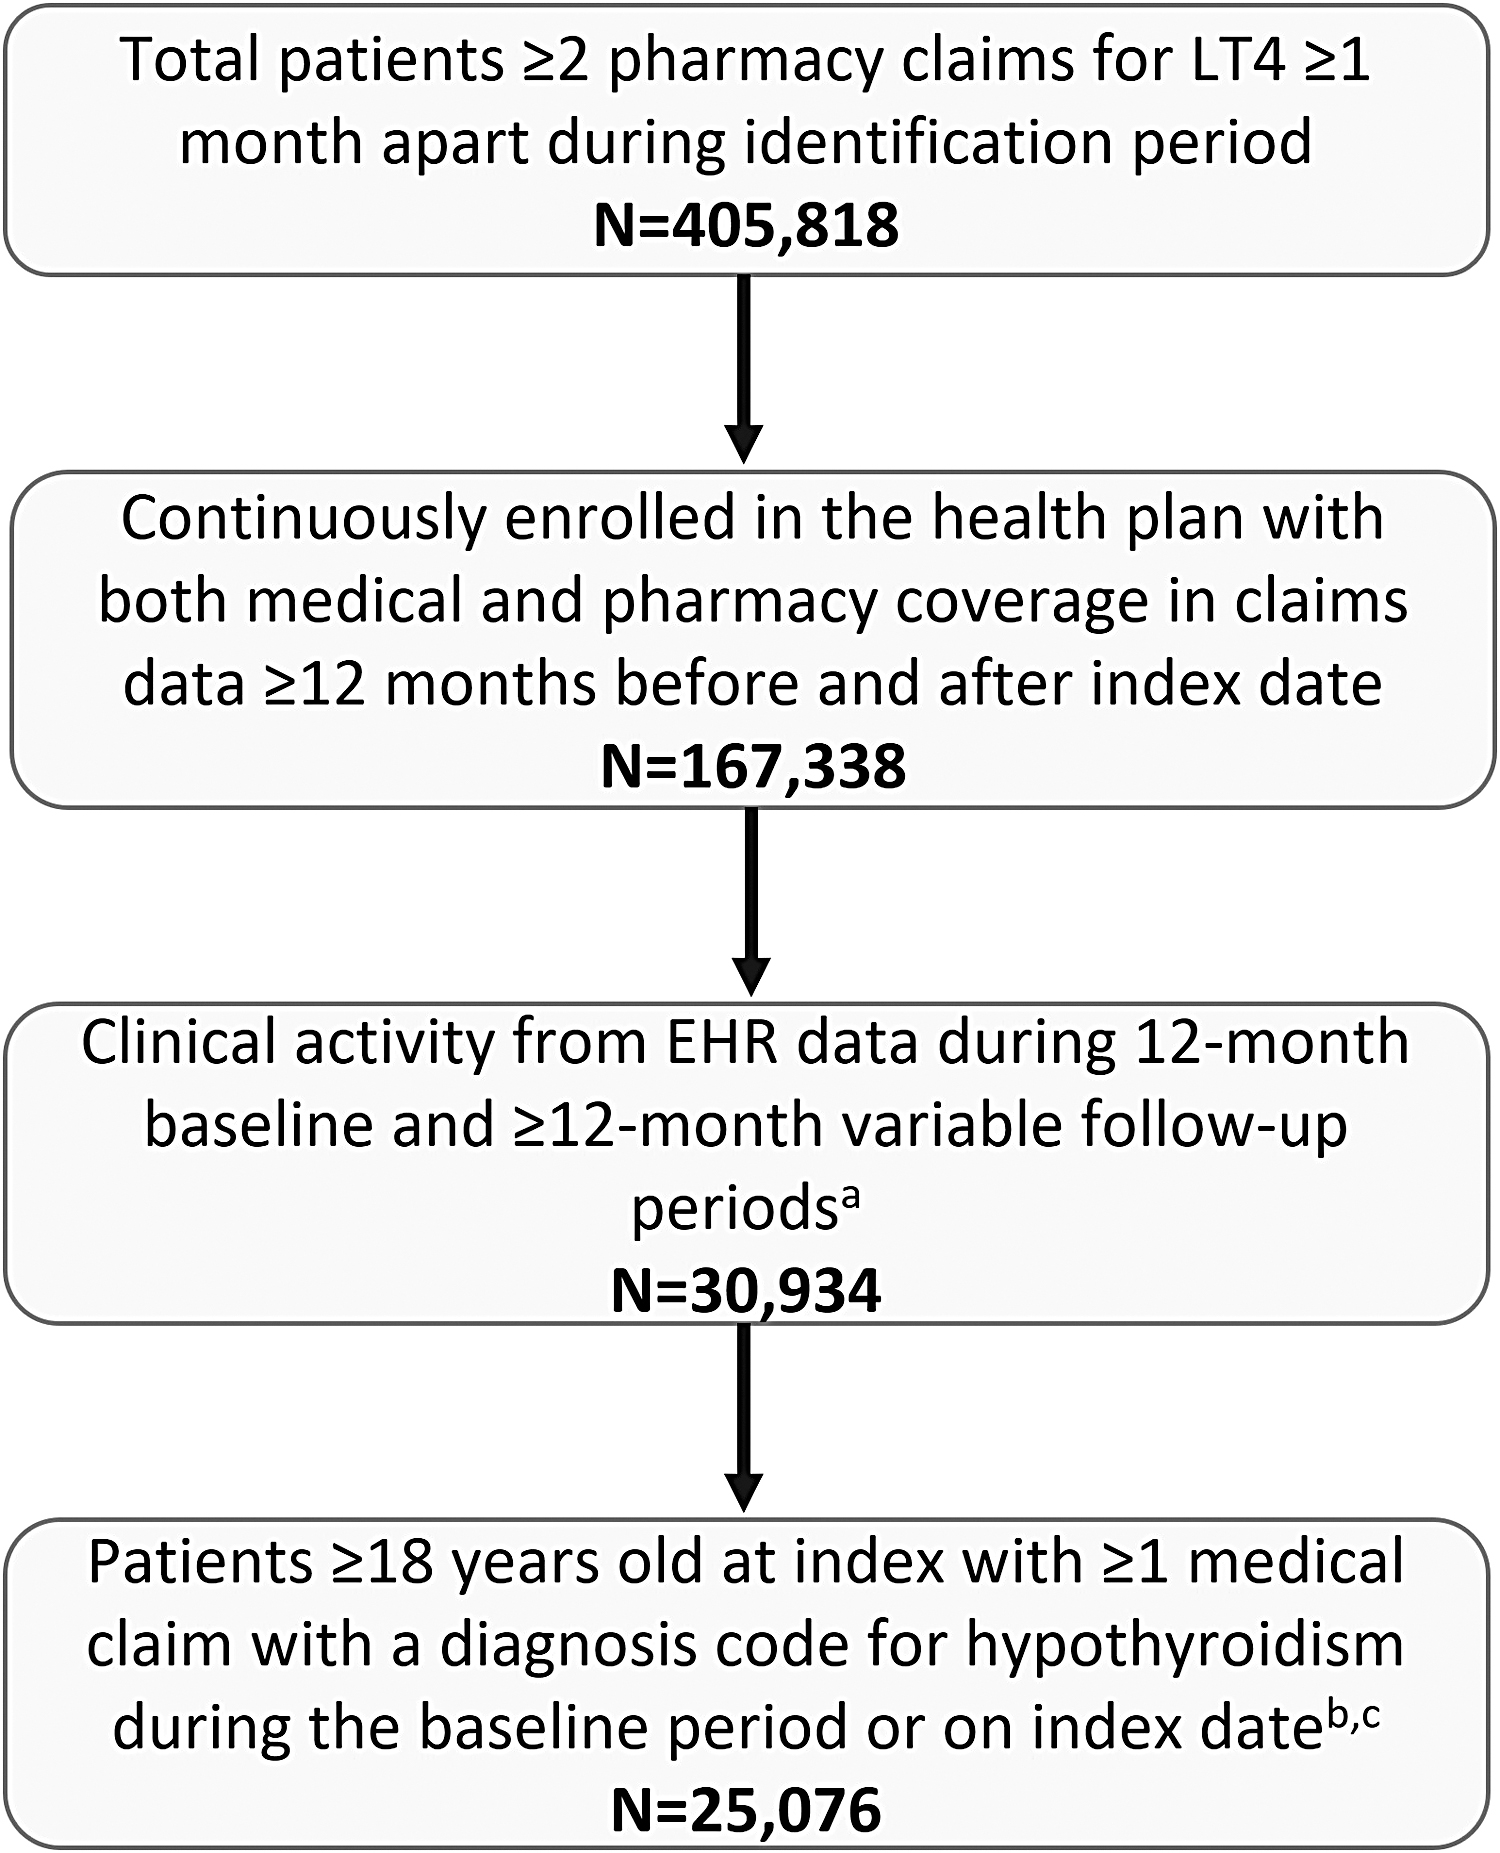
Patient selection and attrition: LT4-indexed group. Study period: March 01, 2013 through February 29, 2020. Levothyroxine identification period: March 01, 2014 through February 28, 2019. aClinical activity was defined as ≥1 record from the EHR database (e.g., diagnosis, procedure, and medication) that signaled that the patient was seen by the provider during a baseline or follow-up visit. bExcludes patients with claims with diagnosis or procedure codes for pregnancy, labor, or delivery, as well as claims with a diagnosis code for thyroid cancer, during the baseline and follow-up periods. cIncludes only those patients with known sex, geographic region, and health plan type.
Patients and TSH results were not identified by venue. Approximately 20% of the TSH-indexed group had ≥1 hospitalization during the 12- to 24-month follow-up period; hospitalization rate (0.24 per person per year) and length of stay (2.6 days per person per year) were low among the TSH-indexed group. Consequently, while some TSH results may have come from inpatient settings, most data for the TSH-indexed group came from outpatient and laboratory settings, and TSH outcomes in this study should not be affected by the potentially few inpatient-based TSH values.
Outcomes
Objective 1: assessment of TSH levels among patients treated with LT4 (TSH-indexed group)
Using laboratory data, patient TSH levels were assessed at baseline and during the follow-up period. Baseline TSH corresponded to the TSH result closest to index date within three months before the index date. Eligible follow-up TSH results occurred with overlapping days' supply of LT4. Patients were categorized as having low (<0.45 mIU/L), normal (0.45–4.5 mIU/L), or high (>4.5 mIU/L) TSH levels based on mean eligible TSH results during follow-up. These data were further stratified by sex, age, and insurance type (i.e., commercial vs. Medicare).
Objective 2: assessment of LT4 formulation switching among patients prescribed LT4 (LT4-indexed group)
Percentage of patients with formulation switches during the first 12 months of the follow-up period was assessed. Eligible switches included switch from branded to generic formulation, among branded formulations, or generic formulations. Switchers were defined as patients with ≥1 eligible switch, which included any switch from the index LT4 as well as among subsequent LT4 fills, during the follow-up period. Data were further stratified by sex, age, and insurance type. Proportion of patients with ≥1 eligible switch is also reported for the variable follow-up period of up to 24 months depending on patient data availability.
Statistical analysis
All data reported were analyzed using descriptive statistics. Numbers and proportions were provided for dichotomous and polychotomous variables; means plus standard deviations were provided for continuous variables. For subgroup analyses (i.e., data stratified by age group, sex, and insurance type), percentages of patients by TSH levels (normal vs. not) or percentages of patients with at least one defined LT4 formulation switch were assessed as binary outcomes, and analyzed by chi-square tests for between- or among-group differences.
Results
Objective 1: assessment of TSH among patients treated for HT
Patient characteristics and baseline assessment
After applying inclusion and exclusion criteria, 11,259 total patients were included in the TSH-indexed group (Fig. 1). Patients were primarily female (77.8%, N = 8755) and the vast majority were aged ≥45 years (93.2%; Table 1). More than half of patients were insured by Medicare Advantage with Part D (62.1%, N = 6986) and 53.9% (N = 6070) were in the Midwestern region. Twelve major comorbidities were identified among these patients, with the top three being dyslipidemia (61.7%), hypertension (59.2%), and diabetes (25.1%; Table 1). Nonetheless, as a group, serum levels of total cholesterol, low-density lipoprotein (LDL), high-density lipoprotein (HDL), cholesterol, and triglycerides were within normal range (Table 1).
Baseline Demographic and Clinical Characteristics of Patients in the Thyrotropin-Indexed Group
Total number of patients with at least one TSH result within three months before the index date.
Baseline TSH values correspond to the TSH result closest to the index date within the three months before the index date.
CVD, cardiovascular disease; fT4, free thyroxine; GERD, gastroesophageal reflux disease; HDL, high-density lipoprotein; IBD, inflammatory bowel disease; LDL, low-density lipoprotein; LT4, levothyroxine; SD, standard deviation; TSH, thyrotropin.
The baseline LT4 mean daily dose in this group was 91.6 ± 42.3 mcg (N = 10,751), with 75.9% of the patients taking >50 mcg/day. Baseline free thyroxine (fT4) levels were available for only 36.5% (N = 4115) of patients, of which 91% (N = 3762) were within normal reference range (Table 1). Less than half of patients with ≥1 baseline TSH result (40.9%, N = 791) had normal TSH levels at baseline; 38.0% (N = 735) and 21.1% (N = 409) had high (>4.5 mIU/L) or low (<0.45 mIU/L) TSH, respectively. This relatively high percentage of patients with off-target TSH levels is likely because eligibility criteria required all patients have an HT diagnosis during baseline period, but did not require evidence of LT4 treatment during baseline period. Thus, TSH levels reflect a broad HT spectrum.
Follow-up TSH levels among patients treated with LT4
The LT4 mean daily dose during the follow-up period was 93.2 ± 42.8 mcg, with 78.5% of patients taking >50 mcg/day. Overall, 81.1% (confidence interval [CI: 80.4–81.8]; N = 9130) of patients had normal mean TSH levels, and 11.7% [CI: 11.1–12.3; N = 1312] and 7.3% [CI: 6.8–7.8; N = 817] had high and low TSH levels, respectively. Approximately 4% had very low (TSH <0.1; 1.7% [1.5–2.0]) or very high (TSH >10; 2.3% [2.1–2.6]) TSH levels.
When stratified by age, 71.8–82.4% had normal mean TSH levels across all age groups (Fig. 3A). Overall, numerically more patients in all age groups had high mean TSH levels (10.4–21.1%) than low mean levels (3.9–10.3%). When stratified by sex, a significantly higher proportion of females, compared with males, had normal (82.0% vs. 78.0%, p < 0.001) or low (7.7% vs. 5.6%, p < 0.001) mean TSH levels (Fig. 3B). In contrast, a significantly higher proportion of males presented with high mean TSH levels (16.5% vs. 10.3%, p < 0.001). A statistically significantly higher proportion of patients insured by commercial insurance had low TSH levels than those insured by Medicare (8.8% vs. 6.3%, p < 0.001), whereas more Medicare-insured patients had normal mean TSH levels (81.7% vs. 80.1%; p = 0.042; Fig. 3C). No significant difference existed between Medicare and commercially insured patients with mean high TSH levels.

TSH results by
Evidence shows that the reference range to determine “normal” TSH levels may not be appropriate for older adults; 10 thus, we performed a sensitivity analysis wherein we incorporated an alternative reference range of “normal” TSH levels in patients aged ≥60 years based on Boucai et al.'s findings. 11 Incorporating the age-specific TSH reference range resulted in moderate changes (standard vs. age-specific range): 82.4% versus 86.0% of patients aged 65–74 years within normal mean TSH levels, and 10.4% versus 6.5% with high mean TSH levels. A similar trend was seen in patients aged ≥75 years (normal TSH: 81.8% vs. 87.5%; high TSH: 12.8% vs. 7.0%).
Objective 2: assessment of LT4 formulation switching among patients treated for HT
Patient characteristics and baseline assessment
After applying inclusion and exclusion criteria, 25,076 total patients receiving thyroid replacement therapy were included in the LT4-indexed group to assess formulation switching (Fig. 4). Patients were primarily female (77.9%, N = 19,534) and most were aged ≥45 years (91.3%; Table 2). More than half of patients were insured by Medicare Advantage with Part D (56.4%, N = 14,143) and 49.4% (N = 12,393) were in the Midwestern U.S. region. At baseline, 86.2% (N = 21,610) had ≥1 claim for a generic LT4 and 13.2% (N = 3301) had ≥1 claim for a branded LT4. Mean duration of follow-up was 621 ± 121 days. Similar to the TSH-indexed group, 12 major comorbidities were identified among these patients, with the top 3 being dyslipidemia (64.5%), hypertension (61.4%), and diabetes (26.0%; Table 2).
LT4 switching results by
Baseline Demographic and Clinical Characteristics of Patients in the Levothyroxine-Indexed Group
A total of 24,243 patients had LT4 dose data at baseline.
Nonetheless, as a group, serum levels of total cholesterol, LDL, HDL, cholesterol, and triglycerides were within normal range (Table 2). At baseline, 24,243 patients in the LT4-indexed group had ≥1 LT4 claim; the mean daily LT4 dose was 89.2 ± 44.2 mcg. Overall, 27.9% (N = 6762) received LT4 doses ≤50 mcg/day in baseline. Of the nearly three-quarters of patients receiving doses >50 mcg/day, 41.3% (N = 10,018) received >50 to ≤100 mcg/day and 29.7% (N = 7206) received >100 to ≤200 mcg/day. Only 1.1% of patients received doses >200 mcg/day.
Frequency and types of LT4 formulation switches
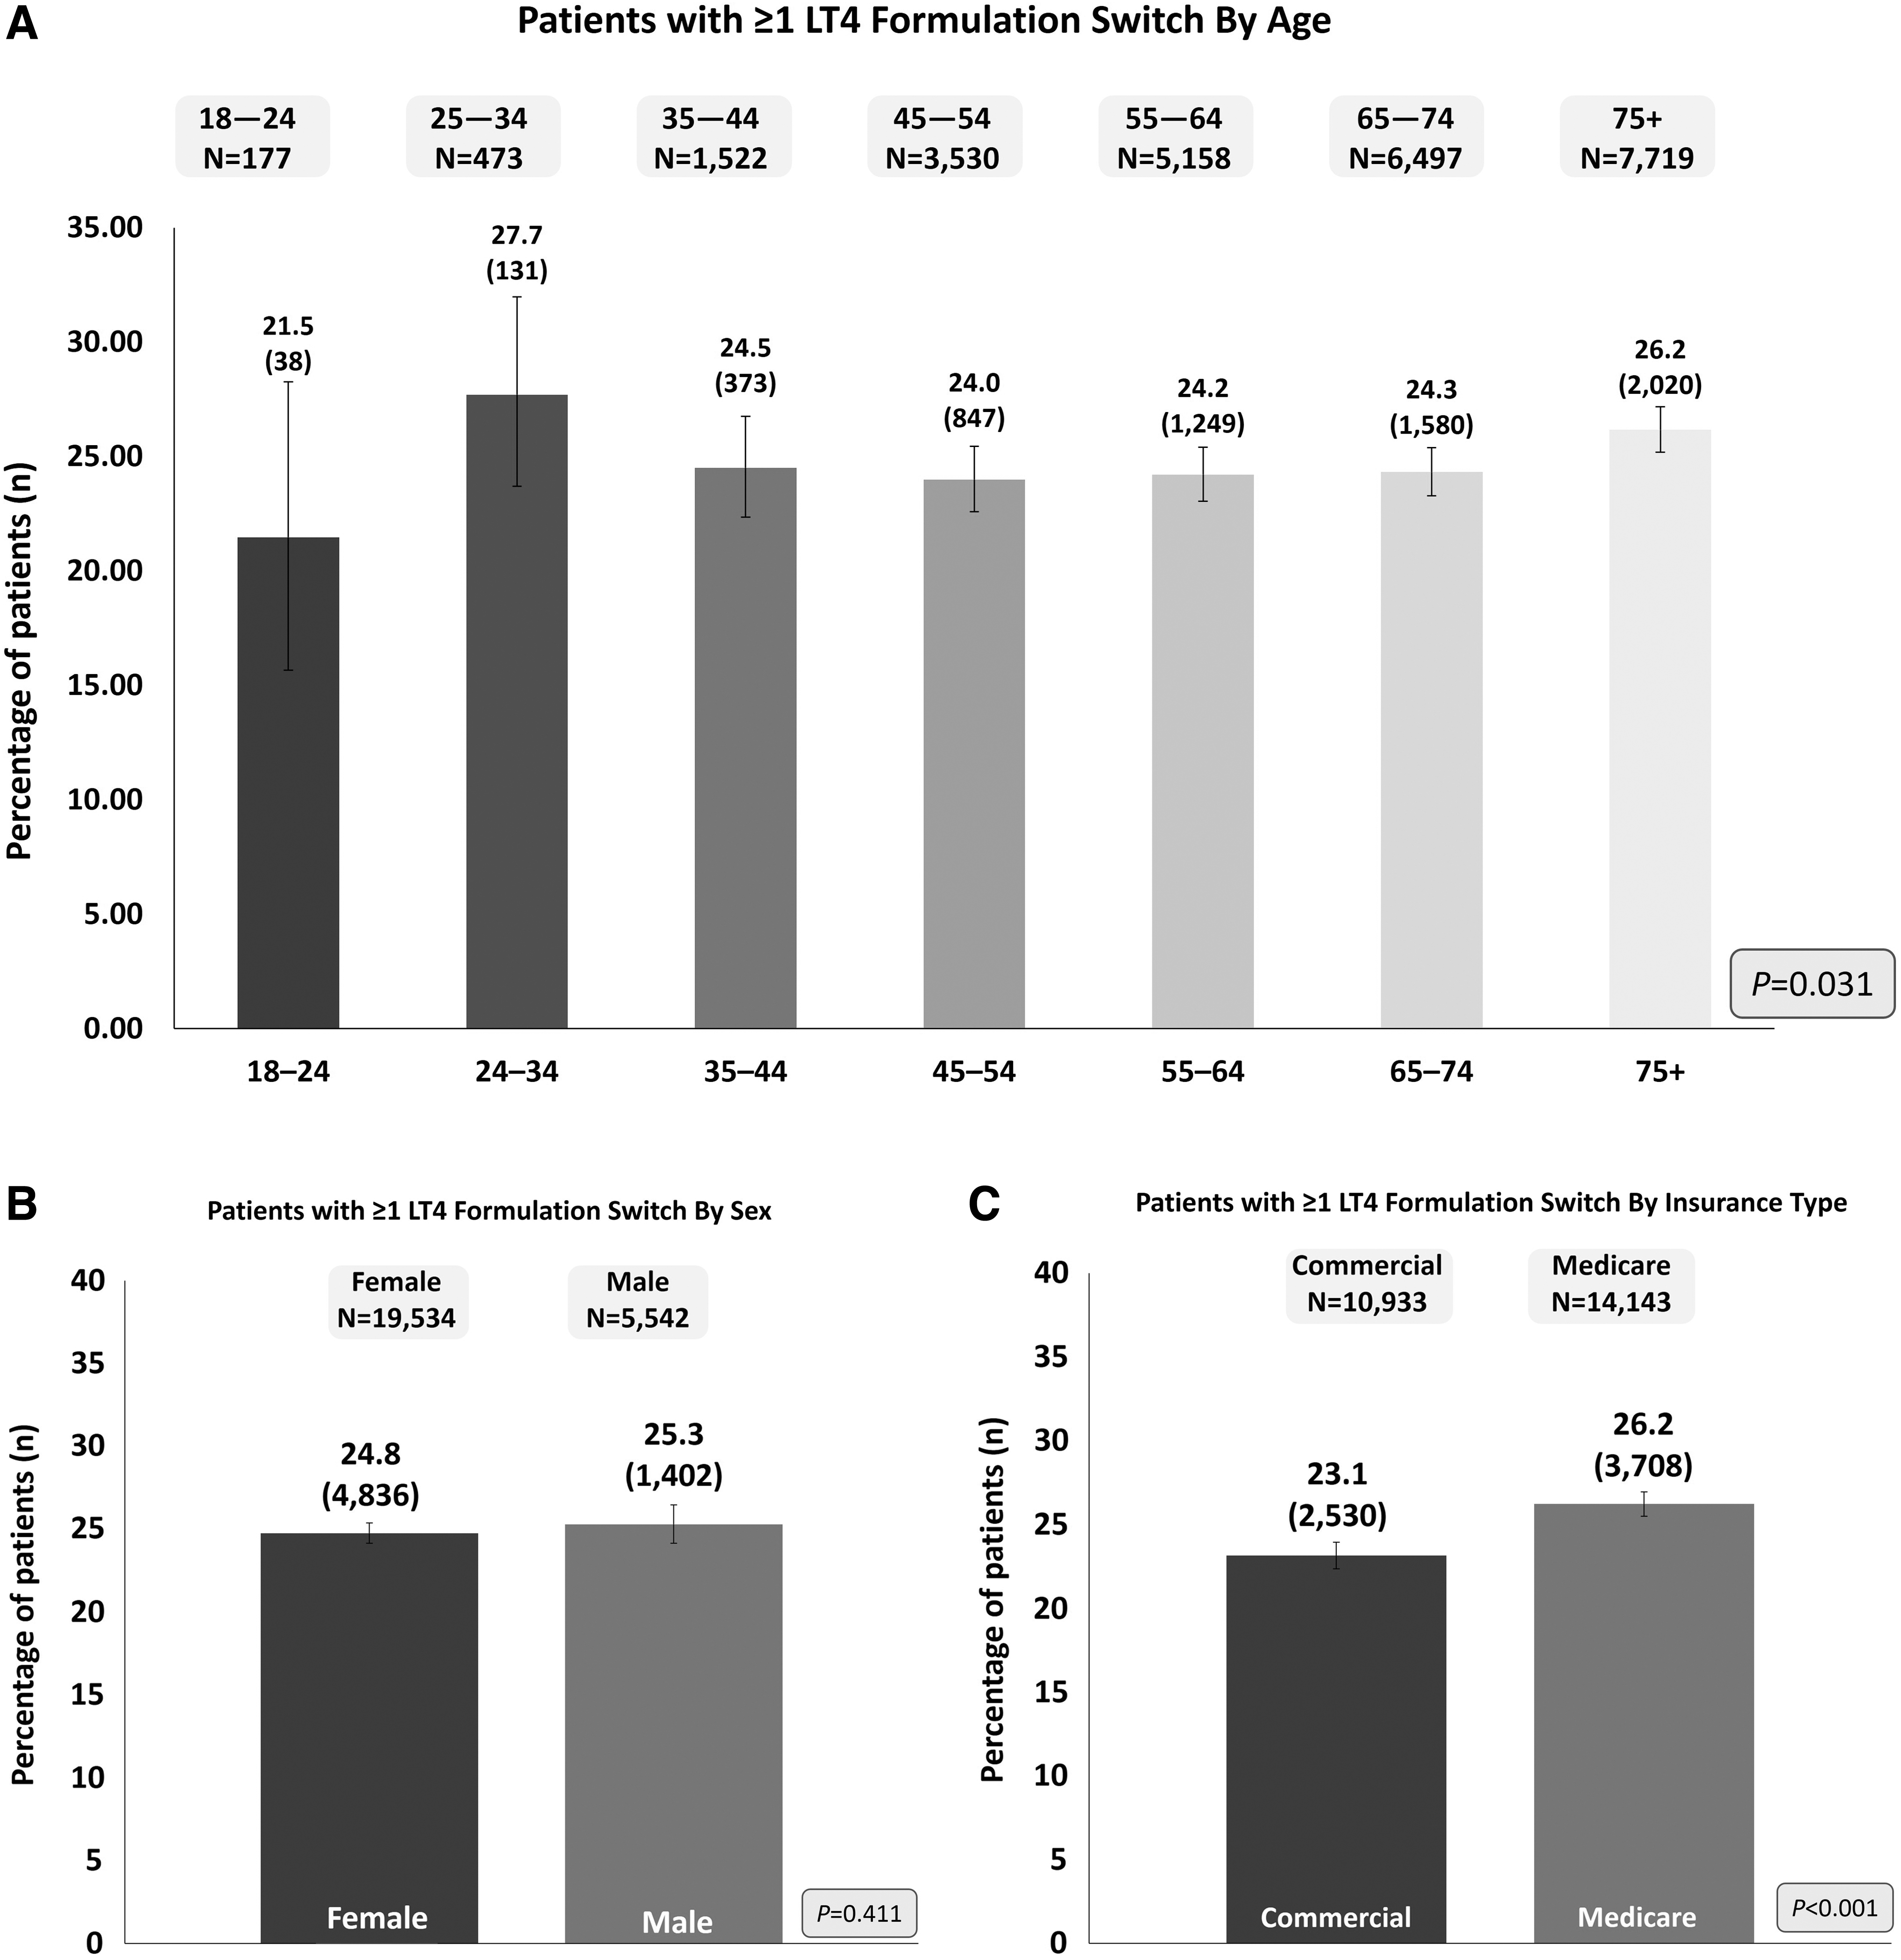
Of 25,076 patients assessed, 24.9% [CI: 24.3–25.4; N = 6238] had one or more switches between LT4 formulations during the first 12 months of the follow-up period. During the variable follow-up period, 41.4% (N = 10,370) of patients had at least one formulation switch at a maximum of 24 months. A statistically significant difference in patients with ≥1 LT4 formulation switch across age groups was observed (range 21.5–27.7%, p = 0.031; Fig. 4A). When stratified by sex, 25.3% of males switched formulations at least once compared with 24.8% of females (p = 0.411; Fig. 4B). A statistically significantly higher proportion of patients insured by Medicare, as compared with those insured by commercial insurance, experienced at least one formulation switch (26.2% vs. 23.1%; p < 0.001; Fig. 4C).
The majority of patients with ≥1 formulation change switched among generic formulations (93.3%; N = 5820); 7.5% (N = 470) of patients who switched had ≥1 switch from branded to generic formulations and <1% (N = 28) had ≥1 switch among branded formulations. A small proportion of patients (1.3%; N = 80) had ≥1 switch in multiple categories.
Discussion
Among patients in the TSH-indexed group, 81.1% had normal mean TSH values during the variable (12–24 month) follow-up period. A higher percentage of females versus males had normal or low mean TSH levels with treatment and a higher percentage of patients insured by Medicare Advantage with Part D had normal mean TSH values compared with commercially insured patients. Although inability to maintain an on-target serum TSH reached almost 20%, these data represent a substantial improvement over previous U.S. populational assessments. 7 Whether switching among LT4 formulations impacts treatment efficacy remains a controversial topic. Nonetheless, in this study, we found switching to be prevalent; a quarter of patients receiving LT4 had one or more formulation switches in the first 12 months of follow-up, a number that increased to 41.4% over the variable follow-up period (i.e., up to 24 months).
The Colorado Study, a cross-sectional study of patients at a statewide health fair in 1995 (N = 25,862), found that only 60% of HT patients receiving replacement therapy had normal TSH levels. 7 Two recent U.S. studies showed an improvement, with 79–85% of patients on LT4 therapy maintaining TSH values within the normal range. 9,12 These findings are in agreement with our results, in which 81% of patients achieved normal levels at 12–24 months. Our subanalysis of patients aged ≥60 years, with both standard and age-specific cutoffs, also identified a marked improvement from 43% of LT4-treated patients aged ≥65 years in 2009 who achieved normal TSH levels to >82% from 2014 to 2020. 8
When comparing adequacy of serum TSH levels over time (even between studies during a similar time frame) one must consider possible changes in HT severity. As such, some patients may have only minimal TSH alterations and require small LT4 doses to supplement residual endogenous thyroid function, whereas others may have required much higher LT4 doses. Indeed, this is critically important because thyroid hormone therapy use has nearly doubled between 1997 and 2016, which may be attributed to increased treatment of subclinical HT. 12,13 Over time, the TSH threshold for initiating thyroid hormone therapy has decreased markedly. 4
In one study, more than half of patients initiating LT4 therapy had subclinical HT and nearly a third had normal TSH levels before therapy initiation. 12 While increased treatment of subclinical HT may have played a role in TSH level improvement in this study, we noted that, in both the TSH-indexed and LT4-indexed groups, ∼75% of patients were taking >50 mcg/LT4 day, with about 30% receiving >100 mcg/day. These LT4 doses are substantially higher than those reported in a recent large study also analyzing TSH levels in LT4-treated patients, where 58% of patients were taking 50 mcg LT4/day or less, and only 13% were taking >100 mcg/day. 12
Maintaining an off-target serum TSH level (>10 mIU/L or <0.1 mIU/L) will likely result in altered systemic thyroid hormone action over time, which has been linked to increased risk of heart failure, stroke, and overall excess mortality. 6,14 –16 Furthermore, patients with prehospitalization TSH levels >10 mIU/L were found to have a longer length of stay (+1.2 days), 49% higher risk of 30-day readmission, and 43% higher rate of 90-day readmission compared with balanced controls. 17
Several factors may contribute to the inability to preserve serum TSH levels within normal reference range, such as variable LT4 absorption due to interference by food and/or medications or other gastrointestinal conditions (e.g., inflammatory bowel disease or surgical bypass). 2,18 Indeed, LT4 should be consistently taken on an empty stomach for optimal absorption, yet some patients are unable or unwilling to fast. 19 Patient noncompliance is considered the most common cause of refractory HT, but often takes substantial time, and requires exclusion of all other possibilities, to reach that conclusion. 18,19 Other treatment procedures, such as weekly bolus dosing, have been assessed and were shown to be effective and well tolerated in patients with HT who received a once-weekly LT4 bolus treatment. 19 The inactive ingredients used to prepare various forms of LT4 can also impact absorption, thus formulations such as fast-dissolving soft gels or liquid LT4, have also been assessed and demonstrated promising results. 18,20
Rate of LT4 formulation switching detected in this study is unexpectedly high given the 2014 American Thyroid Association (ATA) recommendations against switching. 2 While the ATA concluded that no evidence of superiority existed among branded or generic formulations, consistent usage of the same formulation was encouraged. 2 In this study, we found that nearly a quarter of patients switched formulations, which is especially concerning given the rate is higher than that previously reported, in which 20% of adults newly prescribed a generic LT4 (N = 483,390) switched preparations at least once during the first treatment year. 21
Switching LT4 formulations has been linked to higher HT-related total and non-drug-related medical costs, 22 but the major issue raised by the ATA is that different LT4 formulations might not be bioequivalent, a definition that has been challenging and controversial to establish. 20 In 2018, it was estimated that up to 85% of patients prescribed LT4 received generic preparations, a marked increase from 60% observed in 2007. 5,21 It is notable that a recent large retrospective study found that switching among generic LT4 preparations did not interfere with the ability to achieve and/or maintain normal TSH levels 12 (although, as noted earlier, most patients were taking ≤50 mcg LT4/day).
Although it would have been interesting to examine the relationship between switching LT4 formulations and keeping an off-target TSH (i.e., contrasting the TSH-indexes and LT4-indexed groups), our study was designed to prevent findings from being interpreted as a causal relationship between TSH levels and LT4 switching. Multiple independent factors exist that could greatly impact the outcome, which could not be accounted for in this analysis. For example, patient traits, such as poor compliance with taking LT4, may be associated with inconsistent TSH monitoring and/or consistent use of a particular LT4 formulation.
While more studies are needed in this area, we should also consider that switching among LT4 formulations may be influenced by type of health care dispensed to patients and/or patient-perceived importance of receiving care. In addition, the dispensing pharmacist can switch LT4 formulation without the physician's knowledge, a practice that is preventable if physicians explicitly state switching is not acceptable. 2,20,23
Although this study assessed LT4 treatment switch rates for up to two years, most HT patients take LT4 for life. Hence, it is logical to assume that high rates of formulation switching observed in this study would continue to increase over time. To our knowledge, very little research exists on the rate of treatment switching past 24 months. However, overall lack of longitudinal data makes it difficult to further generalize our results. More research with a longer follow-up period is needed.
A strength of this study design is the examination of clinical details and health outcomes from a large sample size of patients with diverse medical histories in a real-world setting away from the highly controlled environment of clinical trials. This study also has important limitations. In this study, we utilized de-identified, EHR-linked claims data; thus, measurements are subject to the data recorded. Likewise, data are reported descriptively and should be cautiously interpreted. These were cross-sectional cohorts; thus, patients were not identified at initial HT diagnosis or LT4 initiation.
Diagnosis codes from claims only reflect what was submitted for reimbursement and does not equal a confirmed diagnosis. Pharmacy claims data indicate only that a claim was submitted, but they do not indicate whether the patient used the medication as prescribed. Moreover, reasons for formulation switches were not available. Data used for this study come from a managed-care population; therefore, the results of this analysis are primarily applicable to drug utilization in managed-care settings, and thus may not apply to all patients.
Conclusions
This retrospective study showed that, despite most patients achieving normal TSH levels, nearly 20% of patients do not. These findings suggest further patient and provider education is needed to enhance awareness and understanding of the factors that influence normalization of TSH levels. This study also showed that one quarter of patients receiving LT4 had one or more formulation switches in the 12-month follow-up period, a number that increased to >40% within 12–24 months. Future studies should address whether such a high LT4 switching rate plays any detrimental role in achieving normalization of serum TSH.
Footnotes
Acknowledgments
We thank Samantha D. Francis Stuart, PhD, of Fishawack Facilitate Ltd, part of Fishawack Health, for medical writing services, funded by AbbVie.
Authors' Contributions
A.C.B. substantially contributed to study conception and design, analysis and interpretation of data, and drafting/revising the article critically for intellectual content. Y.B. substantially contributed to study conception and design, acquisition, analysis, and interpretation of data, and drafting/revising the article critically for intellectual content. O.A.F. substantially contributed to study conception and design, interpretation of data, and drafting/revising the article critically for intellectual content. R.H. substantially contributed to study conception and design, acquisition, analysis, and interpretation of data, and drafting/revising the article critically for intellectual content. L.L. and S.S. substantially contributed to data analysis and interpretation. T.F. substantially contributed to study conception and design, interpretation of data, and drafting/revising the article critically for intellectual content.
Author Disclosure Statement
A.C.B. is a consultant for AbbVie, Sentier, Synthonics, and Tyron. Y.B. and O.A.F. are full-time employees of AbbVie and may hold AbbVie stock and/or stock options. R.H. and L.L. are full-time employees of Optum, Inc., and were contracted by AbbVie, Inc., to execute this study and own UnitedHealth Group stock. S.S. is a former employee of Optum, Inc.; all contributions to this article were completed at the time of their employment at Optum, Inc. S.S. is currently a full-time employee of Panalgo and owns UnitedHealth Group stock. T.F. has received speaker and/or consultant fees from AbbVie, Inc.
Funding Information
This study was funded by AbbVie, Inc. AbbVie participated in the study design, research, data collection, analysis and interpretation of data, writing, reviewing, and approving the publication. All authors had access to the data results, and participated in the development, review, and approval of this abstract. No honoraria or payments were made for authorship.
Supplementary Material
Supplementary Table S1
Supplementary Table S2
Supplementary Table S3