
Abstract
Background:
Hyper- and hypothyroidism are prevalent in Western countries and often go unnoticed for long periods. Thyrotropin (TSH) as a biomarker of thyroid dysfunction is regularly measured in venous plasma/serum. In newborn screening for congenital hypothyroidism, TSH is measured from dried blood spots (DBSs). DBS enables minimally invasive (at-home) sampling of a small blood volume that can be sent to diagnostic laboratories by regular mail.
Methods:
In this study, we included 109 patients who presented to the outpatient clinic of the University Medical Center Utrecht. Capillary finger stick was used to spot blood on a filter paper card and was dried. After extraction of TSH from DBS, method comparison with venous TSH was performed on an automated high-throughput immunoassay analyzer. Additional validation steps regarding stability, effect of hematocrit (Hct), precision, and limits of blank and quantitation were conducted according to corresponding Clinical and Laboratory Standards Institute evaluation protocol.
Results:
Method comparison of TSH from venous plasma versus finger stick DBSs showed an R 2 [95% confidence interval] = 0.988 [0.986–0.990]. This enabled correct diagnosis of hypothyrotropinemia and hypothyroidism in 12 of 14 and 6 of 7 cases, respectively, with no false positives. Furthermore, TSH from DBS was stable for at least 4 days at temperatures between −20°C and +30°C, and the maximum decrease of eluate TSH was 1.13% for 1% increase in Hct.
Conclusions:
TSH from DBS may be accurately measured on an automated high-throughput immunoassay analyzer and could be used to diagnose hypothyroidism and, for the first time, hypothyrotropinemia. This method, when confirmed in larger field studies, may enable individuals to engage in (at-home) sampling of blood on DBSs for telediagnostics, screening programs, patient follow-up, and medication management.
Introduction
Thyrotropin (TSH) is widely implemented as a biomarker of thyroid dysfunction 1 and medication management 2 in routine diagnostics. Dried blood spot (DBS) collection is minimally invasive and enables self-sampling of small blood volumes at home or work that can easily be sent by mail, thereby limiting the need of traveling to medical centers or taking leave from work. This, therefore, makes TSH an interesting target for DBS analysis. DBS uses filter paper to absorb blood that, after drying, can be shipped and handled without special conditions as it has a reduced risk of infection from contaminated samples. 3
In addition, there is no need for a laboratory close by as DBS can be sent by regular mail to virtually any location, making it possible to centralize analysis. DBS technology was introduced in 1971, 4 but despite the mentioned benefits, clinical applications are still very limited. Some of the limitations are differences in concentration of some metabolites between capillary and venous samples, stability of some metabolites in filter paper, too low sample volumes, and inability to implement DBSs in routine diagnostics. 3,5,6
In the literature, TSH measurement from DBSs has mainly been described for one widely used clinical application, neonatal heel prick screening. Some studies have had success with accurately measuring TSH from DBSs. However, these studies use analyzers specifically developed for neonatal screening or specialized immunoassay kits that require significant amounts of time and manual labor. 7,8 Furthermore, for neonatal heel prick screening, specific equipment, reagents, and reference intervals are required.
In this pilot study, we addressed the question whether TSH measured from finger stick DBSs could be implemented on an automated immunoassay analyzer used in routine diagnostics. Therefore, we validated the analysis of TSH from DBSs on a Siemens Atellica IM analyzer and tested the capability of this method to diagnose patients with hypothyrotropinemia and hypothyroidism.
Materials and Methods
Participants
Four groups of patients were used, group 1 consisted of 11 patients used for capillary calibration line, group 2 consisted of 109 patients used for TSH method comparison of venous heparin plasma and capillary finger stick DBSs, group 3 consisted of 32 patients used for venous (ethylenediaminetetraacetic acid [EDTA]) calibration line, and group 4 consisted of 100 patients used for TSH method comparison of venous heparin plasma and venous EDTA DBSs.
For finger stick DBSs, blood samples were collected from patients, presenting to the outpatient clinic of the University Medical Center (UMC) Utrecht for TSH analysis, after giving written informed consent. The number of participants included in the method comparison complies with the Clinical and Laboratory Standards Institute evaluation protocol EP09c that instructs a sample size of ≥100 for the validation of a measurement procedure.
For venous DBSs, anonymized leftover blood samples were collected from outpatient and hospitalized patients that were sent for analysis to the central diagnostic laboratory of the UMC Utrecht (Utrecht, The Netherlands).
The study was performed under the tenets of the Helsinki Declaration (as revised in 2013) and all relevant national regulations and institutional policies. The study protocol was approved by the authors' institutional review board (METC 20–676/C).
Time and temperature stability of TSH from DBSs
EDTA whole blood of 20 individual patients was spotted and left to dry at room temperature for 3 hours. Thereafter, paper cards were stored at temperatures of −20°C, +4°C, +20°C, +30°C, and +37°C for 1, 2, 3, 4, 14, and 31 days. DBSs were extracted and samples were subsequently analyzed in one run. During DBS extraction of −20°C samples, repeated freeze–thaw cycles were analyzed simultaneously. Therefore, day 1 samples were freeze–thawed once, day 2 samples were freeze–thawed twice.
Effect of hematocrit on TSH concentration from DBSs
EDTA whole blood patient pools of 5 patient samples per pool were centrifuged at 2500 g for 7 minutes. The plasma fraction was removed and aliquoted to obtain samples with equal TSH concentration. Thereafter, the cell fraction of the centrifuged pool was added to create a hematocrit (Hct) range. After mixing samples by inversion, Hct values were analyzed using a Cell-Dyn Sapphire Hematology Analyzer (Abbott, Abbott Park, Illinois, USA). All samples were spotted, extracted, and analyzed as already described and plotted against measured Hct values.
Materials and methods of “sample collection,” “DBS extraction,” “calibration, method comparison, and quality control,” and “limit of blank and limit of quantitation” are described in Supplementary Methods and Materials.
Statistical analysis
The calibration line was generated using linear regression analysis in GraphPad Prism 9 (Version 9.3.0 [463]; GraphPad Software, LLC, San Diego, USA). Method comparison data were analyzed using EP Evaluator® (Data Innovations, VT, USA; version 12.2). 95% confidence interval (CI) for R
2 data was calculated according to R
2 ± 2 × SE
R2, where
Limit of blank (LoB), limit of quantitation (LoQ), and precision data were calculated and analyzed using EP Evaluator (Data Innovations; version 12.2) following software instructions.
Storage stability study data were normalized against day 1 and a mean percentage of all samples was calculated according to
Statistical analysis for the Hct experiment was performed in GraphPad Prism 9 by creating a linear regression line. With the linear regression line, an absolute and percentage of TSH decrease per 1% increase in Hct were calculated for a baseline Hct of 45%.
Results
Precision
Optimal extraction of TSH from DBSs was evaluated with different protocols and buffers (Supplementary Figs. S1 and S2). Precision results are given in Table 1. Within run was 0 and between run, between day, and total coefficients of variation of maximally 5.9% were observed (Table 1). LoB and LoQ were both established at 0.146 mIU/L.
Dried Blood Spot Thyrotropin Precision
When using raw response values (RLU), instead of TSH concentrations converted to plasma values, total CV for low, middle, and high patient pools was 3.6%, 4.1%, and 5.4%, respectively.
CV, coefficient of variation; RLU, relative light units; TSH, thyrotropin.
Validation of TSH measurement from finger stick DBSs on a Siemens Atellica IM high-throughput immunochemistry analyzer
An overview of the study population characteristics is presented in Table 2 and participant flow diagram is shown in Supplementary Figure S3. To convert TSH concentrations from DBSs to plasma-equivalent concentrations, a linear calibration line was created with R 2 [CI] = 0.94 [0.91–0.96], slope [CI] = 0.04605 [0.04186–0.05025], and y-intercept [CI] = 0.00 [0.00–0.00] (Fig. 1A).

TSH method comparison between venous (lithium heparin) plasma and capillary DBS TSH. (

Overview of Study Population Characteristics
For the method comparison of venous heparin plasma versus finger stick DBS extracts, 109 patients were analyzed. Paper cards were dried and stored for 1 to 4 days after validating TSH stability (Fig. 2). The method comparison showed R 2 [CI] = 0.988 [0.986–0.990], slope [CI] = 0.920 [0.901–0.939], and y-intercept [CI] = 0.053 [−0.046 to 0.151] (Fig. 1B) with a bias [CI] of 0.130 [−1.061 to 1.321] (Fig. 1C).
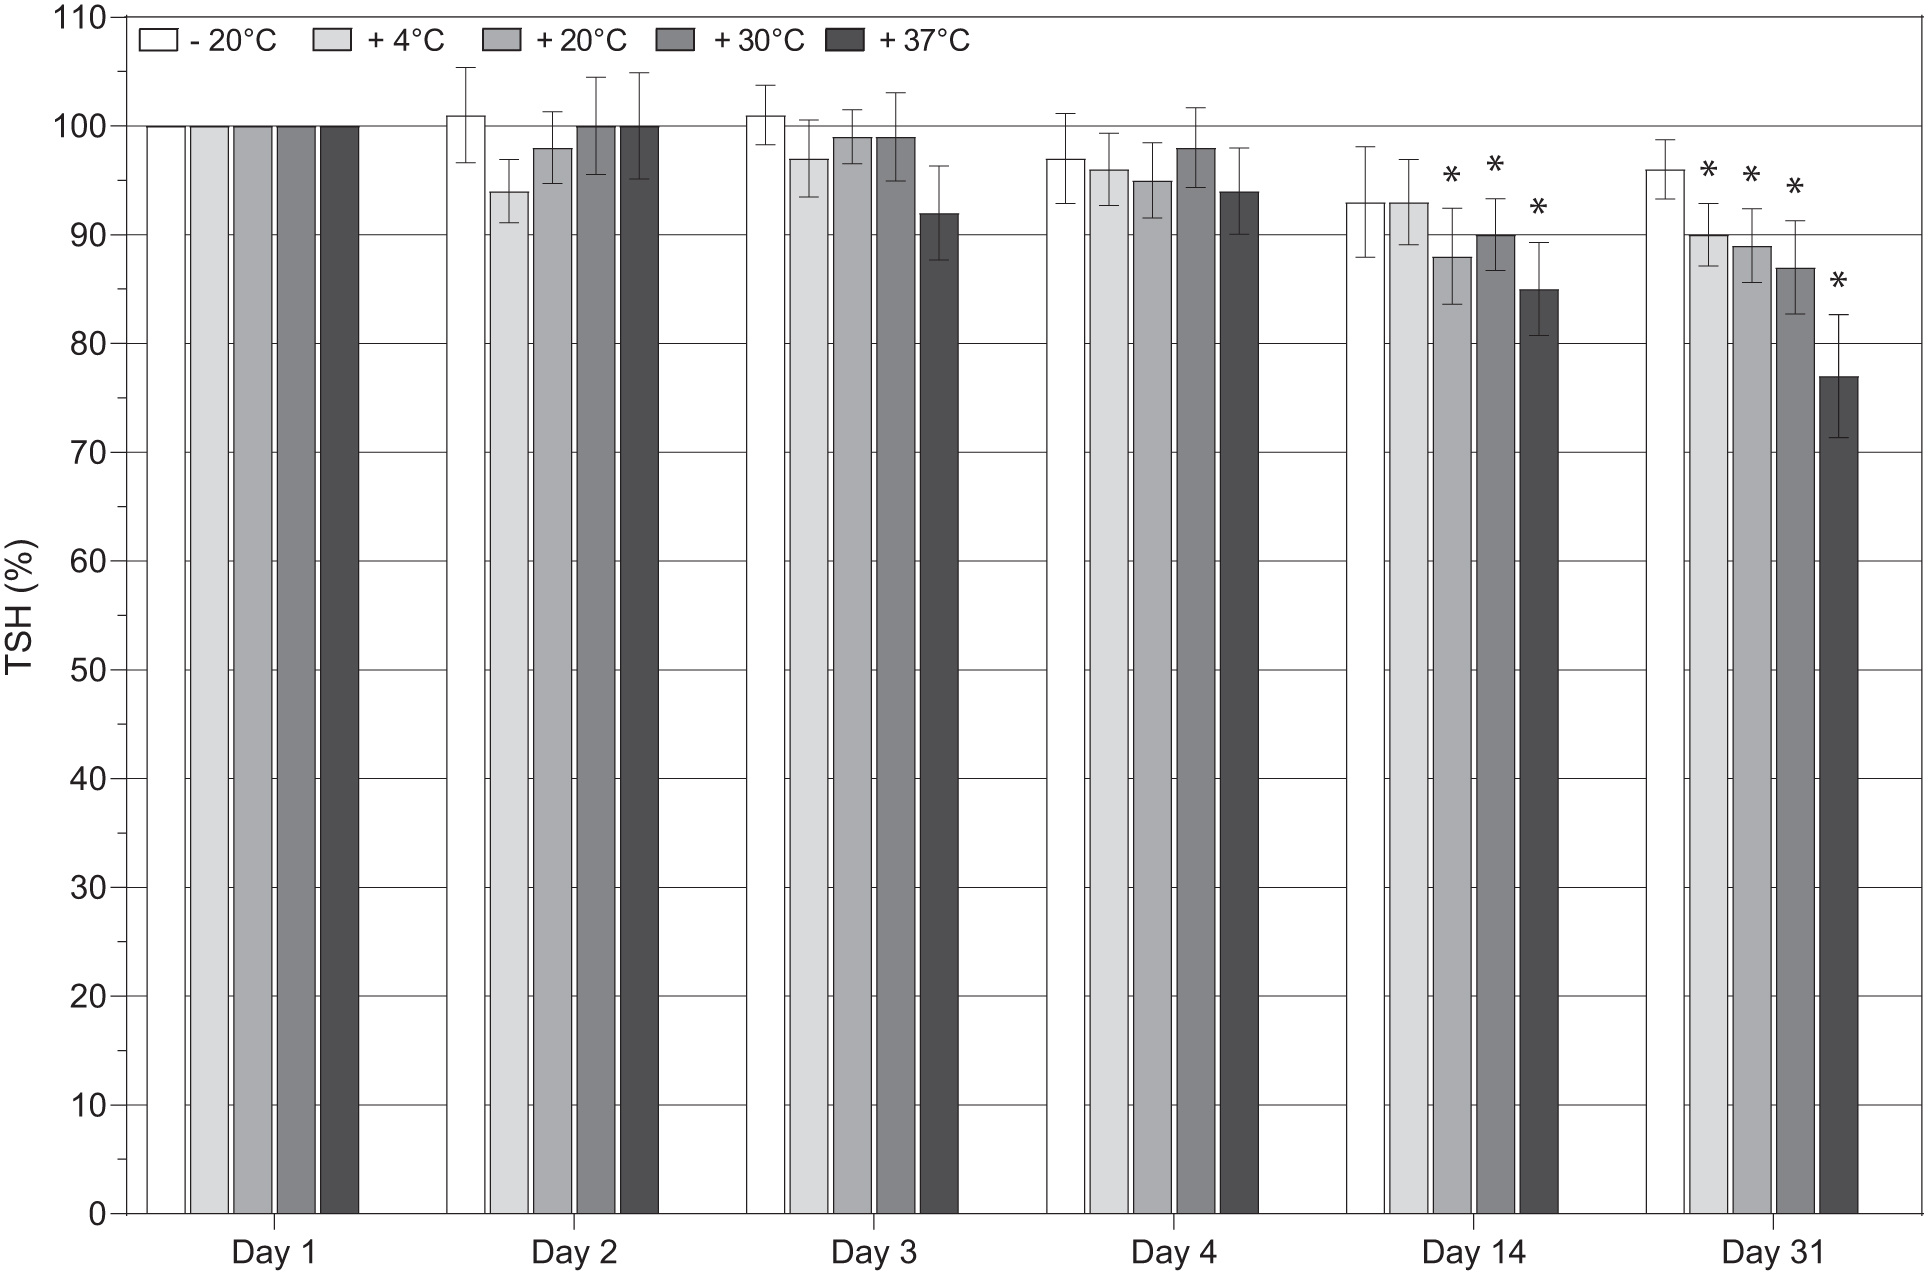
Stability of TSH from DBS. Whole blood spotted on DBS cards was stored for a varying number of days (1 to 31 days, x-axis) under varying storage temperatures (−20°C to +37°C, color of bars). Data were normalized to day 1 data for each patient. Each bar represents mean values (±95% CI of mean) of normalized data from 20 patients. Two-way ANOVA was performed and significant differences are compared with day 1, *p < 0.05.
When excluding high TSH measurements (TSH >10 mIU/L), we observed R 2 [CI] = 0.905 [0.888–0.921], slope [CI] = 0.876 [0.823–0.929], and y-intercept [CI] = 0.119 [−0.006 to 0.245] (Fig. 1D) with a bias [CI] of 0.098 [−0.885 to 1.082] (Fig. 1E). Analyzing the data with TSH <1.0 mIU/L resulted in R 2 [CI] = 0.944 [0.929–0.959], slope [CI] = 0.925 [0.802–1.048], and y-intercept [CI] = 0.103 [0.035–0.170] (Fig. 1F) with a bias [CI] of 0.100 [−0.381 to 0.182] (Fig. 1G).
When using the clinical reference interval of 0.35–5.0 mIU/L for TSH, it was possible to determine hypothyrotropinemia (TSH <0.35 mIU/L) and hypothyroidism (TSH >5.0 mIU/L) in the studied population and calculate diagnostic sensitivity and specificity compared with paired TSH plasma samples. For hypothyrotropinemia, sensitivity (CI) was 0.86 (0.67–1.04) and specificity was 1.00 (1.00–1.00), whereas for hypothyroidism sensitivity was 0.86 (0.60–1.12) and specificity was 1.00 (1.00–1.00).
Regression analyses of the venous calibration line (n = 32) and method comparison (n = 100) of venous heparin plasma versus venous (EDTA) DBS extract yielded similar results (Supplementary Fig. S4).
TSH stability at temperatures ranging from −20°C to +37°C up to 31 days
Results of the stability experiment are shown in Figure 2. Statistically significant differences were found on day 14 for +20°C, +30°C, and +37°C and on day 31 for +4°C, +20°C, +30°C, and +37°C compared with day 1 (all p < 0.05). Categorized individual measurements of all 20 patients are shown in Supplementary Figure S5.
Influence of Hct on the measurement of TSH from DBSs
One of the limitations of DBSs is the inability to separate blood cells from plasma. Therefore, Hct may affect metabolite concentration only when present in the plasma fraction. 9 Therefore, samples with a Hct range of 14%–56% were examined (Fig. 3). At a TSH concentration of 15.7 mIU/L, eluate TSH decreased by 0.12 mIU/L when Hct increased by 1%. At other TSH concentrations, a similar decrease in TSH (%) was observed, regardless of TSH concentration (Supplementary Table S1).

Effect of hematocrit on the concentration of TSH from DBS. Pools from five patients with three different target concentrations were made. From each pool, a Hct dilution range was created and Hct was measured using a Cell-Dyn Sapphire Hematology Analyzer Sapphire. Then, blood was spotted on DBS cards and dried overnight before analysis. Hct, hematocrit.
Discussion
In this study, we showed that TSH from finger stick DBSs can be easily extracted from DBSs (Supplementary Figs. S1 and S2) and subsequently measured on an automated high-throughput immunochemistry analyzer with great accuracy and precision (Fig. 1 and Table 1), using the same equipment, reagents, and reference intervals as in routine diagnostics. Furthermore, TSH remained stable in DBSs for at least 4 days under varying temperatures (Fig. 2) and was minimally affected by Hct (Fig. 3 and Supplementary Table S1). Our data suggest the possibility for implementation of DBS TSH measurements in routine diagnostics so that (worldwide) telediagnostics, screening programs, patient follow-up, and medication management can be made less invasive, easier, and more cost-effective for both laboratories and patients.
TSH from DBSs can be measured with high precision and results were similar to the precision data of the assay manual. 10 In addition, established LoQ makes it possible to clearly discriminate between hypothyrotropinemia and euthyroidism. Finally, test volume can easily be increased by proportionally adding more spots and extraction buffer. This is of importance when, in the future, a panel of tests may be offered by DBS technology. Based on the performed quality control (QC) and results of the method comparison, we demonstrated that TSH extraction from DBSs is robust. For use in clinical practice, when a paired venous sample is not available, it is recommended to use whole blood from DBS for QC.
Diagnosis of hypothyrotropinemia from DBSs has not yet been successful 11,12 and is also not implemented in the neonatal heel prick screening programs. Hashemipour et al. reported that in a systematic review, 40% of the studies investigating neonatal TSH screening of premature and low birth weight babies included a recommendation for retesting for diagnosis of congenital hypothyroidism. 13 In this study, 86% of both hypothyrotropinemia and hypothyroidism cases were diagnosed correctly without false positives. Although larger studies are warranted, it can be concluded that TSH from DBSs can be used to diagnose not only hypothyroidism but also hypothyrotropinemia more accurately than Bellisario et al., 11 Hofman et al., 12 and the current neonatal heel prick screening. 13
TSH stability has been examined by Waite et al. and concluded that TSH was stable “at temperatures likely to be encountered during storage or transport.” 14 However, because method of TSH analysis was radically different compared with our study, we decided to re-examine its stability. In temperatures from −20°C to +37°C, TSH from DBSs is not significantly different for at least 4 days. However, temperatures of 30°C and 37°C seemed to influence TSH recovery at 14 and 31 days of storage. A recent DBS TSH stability study showed good stability up to 30 days but did not investigate temperatures >22°C. 15
In addition, repeated freeze–thaw cycles up to 6 times did not affect TSH stability in samples stored at −20°C. These results might not only enable application of TSH measurement from DBSs in current clinical practices but also permit screening of people living in underdeveloped areas of the world in which (cooled) sample transport to laboratories takes longer than a few days. However, to certify TSH stability in DBSs under various climatological conditions, additional experiments, for example, with varying percentages of atmospheric humidity, are required.
Hct is known to affect DBS data in some metabolites 9,16 and also TSH results are influenced in this way. For all TSH concentrations tested, the maximum decrease of eluate TSH [CI] was 1.13% [0.52%–1.75%] for 1% increase in Hct. These results are in line with Butler et al. who showed that TSH eluate decreased by 0.95% and 0.79% for a 1% increase in Hct at a TSH concentration of 6.3 mIU/L and 26.6 mIU/L, respectively. 17 Therefore, we conclude that, until DBS measurements can be corrected for Hct variance, patient DBS samples with TSH results near reference cutoff values should be retested in plasma to ensure correct diagnosis.
Multiple (clinical) studies already used DBS for TSH analysis, 14,18,19 however, to our knowledge, none has tried implementing DBSs in combination with an automated high-throughput immunoassay analyzer used in routine diagnostics. Integrating TSH from DBSs in routine clinical immunoassay analyzers enables upscaling of DBS measurements with the usage of current automated equipment and, in combination with an automated extraction station, is fully automatable. This permits patients to perform at-home sampling and save time and transport costs. It also saves the laboratory transport costs as DBS does not necessitate specialized transport conditions, 3 and hospitals can possibly save costs by employing fewer phlebotomists.
These data are promising for the use of this DBS method in a routine setting. The next step will be to validate TSH analysis from DBSs in practice with patients, including the self-sampling at home. Moreover, the investigated application paves the way for validation of other analytes measured from DBSs on routine automated (immuno)chemistry analyzers to expand the panel of analytes with the benefits of DBSs for purposes of screening, telediagnosis, follow-up, and managing medication in a cost-effective and time-efficient manner.
In conclusion, we showed that deploying DBSs to measure TSH on an automated high-throughput diagnostic platform, which is readily available in most, if not all, medical diagnostic laboratories, may be possible and reliable. TSH from DBS could be used to diagnose hypothyroidism and, for the first time, hypothyrotropinemia. When this study is reproduced in larger field studies, it opens the way for increasing the panel of analytes measured from DBSs on routine high-throughput (immuno)chemistry analyzers.
Footnotes
Authors' Contributions
M.Y.S. contributed to conceptualization, formal analysis, investigation, validation, visualization, writing—original draft preparation, and writing—review and editing. E.G.W.M.L. was involved in writing—review and editing. T.S.Q.V. carried out investigation. A.H.S. carried out writing—review and editing. I.E.H. was involved in writing—review and editing. W.M.T.G. carried out conceptualization, funding acquisition, project administration, resources, supervision, validation, and writing—review and editing.
Disclaimer
The funder had no role in study design, data collection and analysis, decision to publish, or in preparation of the article.
Author Disclosure Statement
The authors declare no conflict of interest.
Funding Information
This study was supported by a grant of Siemens Healthineers.
Supplementary Material
Supplementary Methods and Materials
Supplementary Table S1
Supplementary Figure S1
Supplementary Figure S2
Supplementary Figure S3
Supplementary Figure S4
Supplementary Figure S5