
Abstract
Background:
While the diagnosis of papillary thyroid carcinomas (PTCs) with tall cell features (PTCtcf) is often made for carcinomas with histological features intermediate between classic and tall cell subtypes of PTC (tcPTC), its comparative signature to that of either tcPTC or classic PTC is less clear. The objective of this study was to perform an integrative clinicopathologic and genomic analysis elucidating the spectrum of tcPTC, PTCtcf, and classic PTC.
Methods:
We analyzed all consecutive patients with tcPTC and PTCtcf evaluated at a tertiary academic referral center between 2005 and 2020, as well as a comparative cohort of classic PTC, in a retrospective observational cohort analysis. Clinicopathologic data were compared among the three groups, including progression-free survival (PFS), recurrent/persistent disease, and a negative composite outcome of death, progression, or need for advanced therapy. To specifically understand differences between tcPTC and PTCtcf, targeted next-generation sequencing was performed in a subset of these cohorts.
Results:
A total of 292 patients were analyzed (81 tcPTC, 65 PTCtcf, 146 classic PTC). Thirteen percent of tcPTC versus 8% of PTCtcf versus 1% of classic PTC had the advanced American Joint Committee on Cancer stage (p = 0.002). Similarly, macroscopic extrathyroidal extension was observed in 38% of tcPTC, 14% of PTCtcf, and 12% of classic PTC (p < 0.001). The 5-year PFS was 76.5%, 81.5%, and 88.3% for tcPTC, PTCtcf, and classic PTC, respectively, while the rates of the negative composite outcome 40.2% for tcPTC, 20.7% for PTCtcf, and 11.2% for classic PTC (p < 0.001). In a multivariable Cox regression analysis, the negative composite outcome was independently associated with tcPTC (HR 4.3 [confidence interval 1.1–16.1], p = 0.03). tcPTC demonstrated substantially more hotspot TERT promoter mutations than PTCtcf (44% vs. 6%, p = 0.012).
Conclusions:
Our study demonstrates a continuum of disease-specific risk of PTC, pointing at PTCtcf as an intermediate entity between tcPTC and classic PTC. These data provide a more refined understanding of risk at time of presentation, while better elucidating the diversity of genomic drivers.
Introduction
Papillary thyroid carcinoma (PTC) is the most common well-differentiated thyroid cancer, although diverse in its subtypes. In addition to the classic PTC, notable other subtypes have been described. Higher risk subtypes include tall cell (tcPTC), columnar cell, and hobnail, 1 with tcPTC the most common of the three. 2 Crucially, there remains considerable variability among experienced pathologists as to the reproducibility of tcPTC diagnosis. 3 Making this more complex is awareness that the World Health Organization (WHO) definitions of tcPTC have also shifted throughout the years 4 –6 and that current criteria for defining PTC with tall cell features (PTCtcf), that is, PTCs not meeting the threshold to be characterized as tcPTC, have been more loosely defined.
While tcPTC has been associated with poorer outcomes than classic PTC, 7 fewer reports are available regarding PTCtcf. Some studies have suggested that PTCtcf exhibits clinicopathologic features similar to that of tcPTC, with both being more aggressive than classic PTC. 8,9 However, a full and unselected clinicopathologic characterization coupled with genomic data of the three groups has not been performed. Clinical and genomic knowledge would better elucidate if these subtypes represent a histological continuum of the same disease, advancing from milder to more aggressive, likely via the acquisition and/or clonal expansion of key genomic events.
The landmark genomic study by The Cancer Genome Atlas (TCGA) defined our overall knowledge on the genomic landscape of PTC. 10 The TCGA included a tcPTC cohort, identifying distinct mRNA and microRNA signatures of this subtype, which may contribute to its aggressive nature. BRAFV600E mutations have been described in 80–100% of tcPTC, 2 while TERT promoter mutations are found in ∼30% of tcPTC (compared with 12% of classic PTC). 11 No prior investigations to our knowledge have used next-generation sequencing (NGS) to perform a comprehensive genomic analysis on PTCtcf and to explore genomic differences between tcPTC and PTCtcf.
Better defining the comparative risk of tcPTC versus PTCtcf versus classic PTC would help clinicians better individualize treatment, especially in an era of more conservative overall oncological management of well-differentiated thyroid carcinoma. Furthermore, genomic comparison of these three groups may explain why comparative risk differs. Thus, our goal was to provide a comprehensive analysis of clinicopathologic data and determine if a spectrum of risk logically evolved from through these histological subtypes. Broader genomic understanding of these classes may further allow additional clinical tools to define risk when histological interpretation alone is borderline or unclear.
Materials and Methods
We identified all consecutive patients diagnosed with tcPTC and PTCtcf between 2005 and 2020, as well as a comparative equal size cohort of consecutive classic PTC diagnosed between 2014 and 2020. This was a retrospective observational cohort analysis. To address selection bias, all patients diagnosed with tcPTC and PTCtcf were included in the analysis, as well as an equal size cohort of consecutive classic PTCs. All clinical and histological data were obtained at time of diagnosis, specifically, age, biological sex, the tumor's pathological characteristics (e.g., TNM staging, extrathyroidal extension, tumor size), and all available data on each patient's disease course (type of treatment, recurrence/persistence, mortality). Data collection was performed through the electronic medical record system.
The American Thyroid Association (ATA) risk for disease recurrence, the American Joint Committee on Cancer (AJCC) stage of disease at diagnosis, and the ATA response to therapy were defined in accordance with the 2016 ATA guidelines on thyroid cancer and the eighth AJCC edition staging system. 1,12 Patients with structural evidence of disease after thyroidectomy (and radioactive iodine [RAI] ablation [when RAI was administered]) within one year were defined as having persistent disease. Recurrence was defined as new structural findings after thyroidectomy (and RAI ablation [when RAI was administered]) at later follow-up.
Use of systemic therapy included tyrosine kinase inhibitors, chemotherapy, and/or immunotherapy for advanced disease, while progression of disease was defined as the presence of new structural findings on follow-up, or a >20% increase in the disease burden necessitating treatment intervention such as surgery, external beam radiation therapy (XRT), or systemic therapy. Low burden of disease was defined as stable/decreasing but detectable levels of thyroglobulin and/or thyroglobulin antibodies with or without neck nodal disease that necessitated no intervention. We also defined a negative composite outcome to capture all disease-related morbidity given the low mortality of the disease, when patients had any of the following: disease progression, PTC-related death, and/or treatment with XRT or systemic therapy.
Pathology specimens were reviewed by endocrine pathologists with expertise in thyroid neoplasia (J.A.B. and K.W.). At least one section per centimeter of tumor was submitted as a starting point for each tumor (per standard protocol), 13 while more than half of tumors (56%) were examined in their entirety. Entirely and not entirely submitted tumors were very similar in terms of clinicopathologic characteristics, treatment received, and outcomes (Supplementary Tables S4 and S5). tcPTC was defined as >50% of the tumor harboring a tall cell morphology (cells 2–3 × taller than wide).
The 50% cutoff was used for this study, as well in our clinical practice, because of data from our institution that the 2017 WHO change in the tcPTC definition (decrease in both percent of tall cells and required height of cells) would lead to 3 × the diagnoses of tcPTC and could lead to overtreatment in an era where more conservative management is favored. 14 PTCtcf was diagnosed when 10–50% of the tumor harbored tall cell morphology. However, we also performed a separate analysis of our data using the 2022 WHO classification (tall cell subtype ≥30% tall cells with a height 3 × taller than wide, tall cell features 10–29% tall cells).
A subset of our cohort (inclusive of all three histological subtypes), who were enrolled in 2014 or thereafter, was interrogated for somatic genomic alterations using the OncoPanel platform at Brigham and Women's Hospital/Dana Farber Cancer Institute. OncoPanel is a custom-targeted NGS assay, targeting 447 genes for mutation and copy number alterations analysis, and an additional 60 selected genes for rearrangement detection. Only impactful alterations were considered in our genomic analysis, after extensive review of the relevant literature as well as cancer mutation databases (such as OncoKB;
Continuous variables are described as the mean and standard deviation, while categorical variables are described as frequencies and percentages (%). Continuous variables between the two groups were compared with Student's t-test, the Mann–Whitney, or one-way analysis of variance. Categorical variables were compared using the Pearson chi-squared test. A pairwise deletion was used for missing data. For survival analysis, a Kaplan–Meier curve was built, and the log-rank test was used to assess statistical significance. Multivariable Cox regression analysis was used to identify the factors independently associated with the negative composite outcome. Mutation plots were generated using the OncoPrinter tool, available at the cBioPortal. 17,18 Approval from the Brigham and Women's Hospital Institutional Review Board (IRB) was obtained (IRB#1999P02899 and 2000P000167).
Results
Our cohort included 292 patients: 81 with tcPTC, 65 PTCtcf, and 146 with classic PTC. The schematic algorithm for selection and inclusion of patients in the current study is presented in Figure 1. Representative images of the histological subtypes, as well as tall cell characteristics used for the diagnosis are presented in Figure 2. Patient and tumor characteristics are shown in Table 1. On average, patients with classic PTC were younger than those with either tcPTC (46.8 years vs. 56.2 years; p < 0.001) or PTCtcf (46.8 years vs. 52.3 years, p = 0.027), while sex distribution was similar among all the three groups.
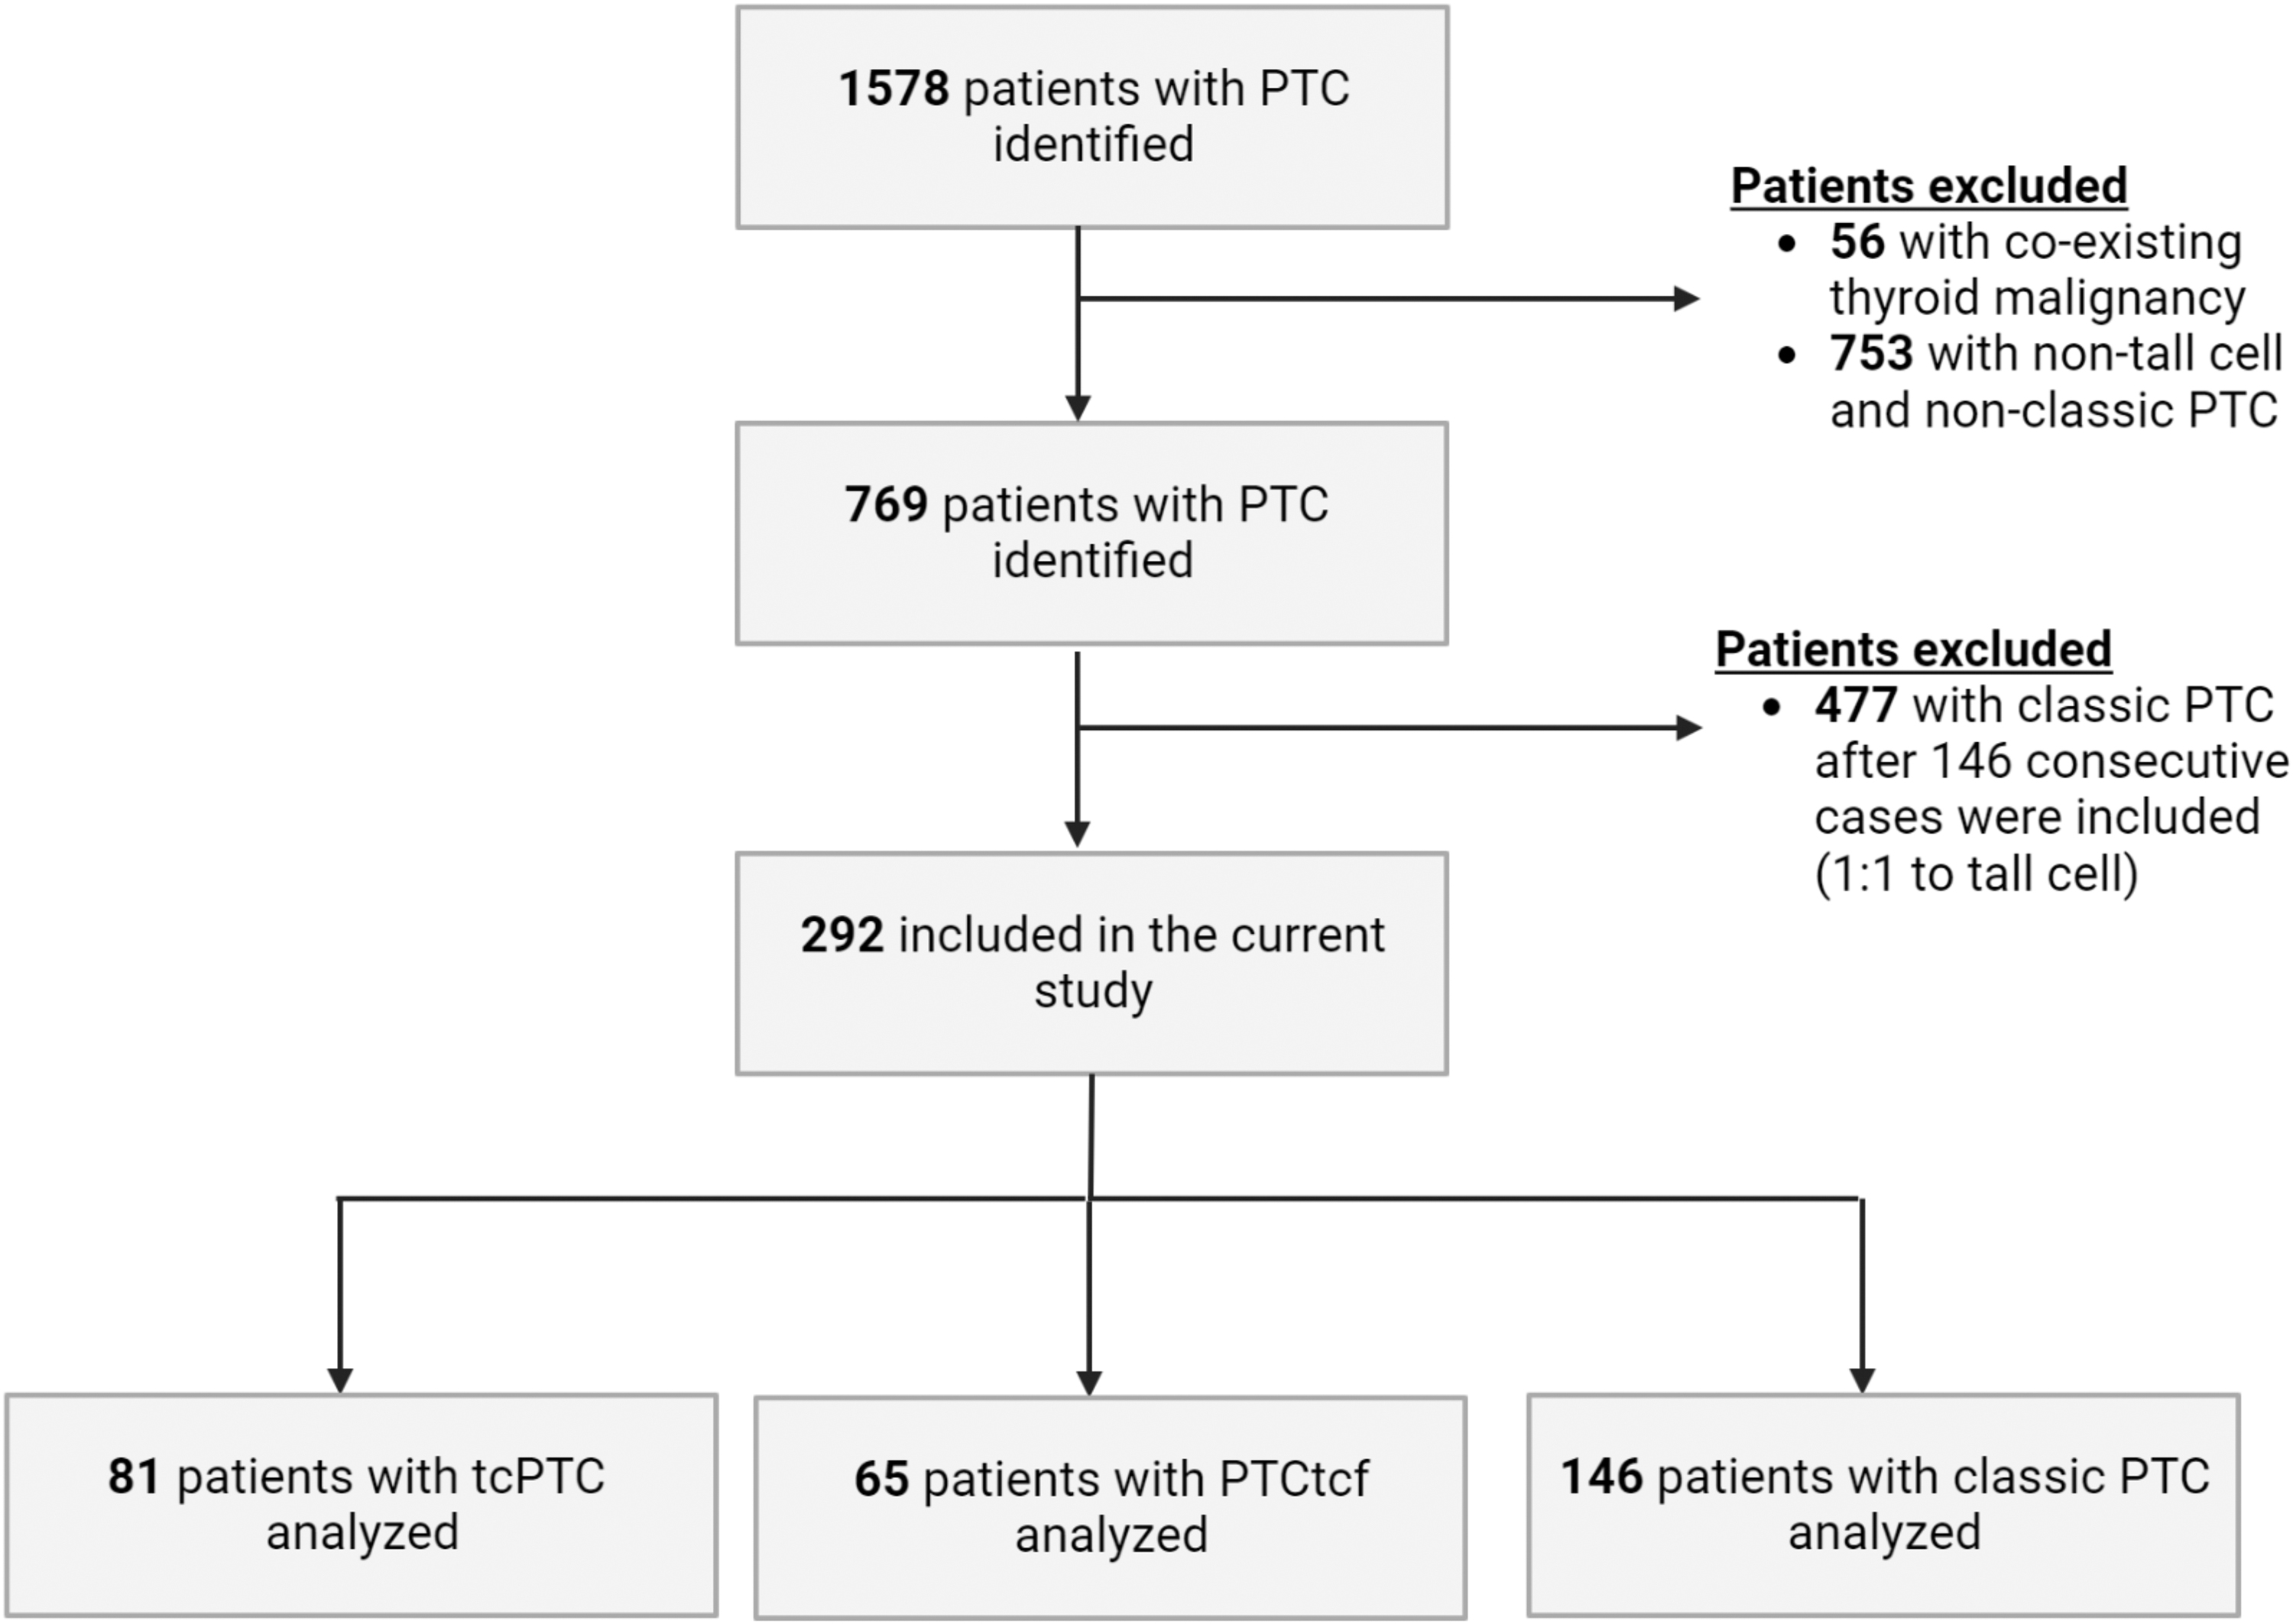
Schematic algorithm for selection and inclusion of patients in the current study. A flow diagram for the 1578 patients with PTC with follow-up at Brigham and Women's Hospital, and the 292 patients who were analyzed. PTC, papillary thyroid carcinoma.
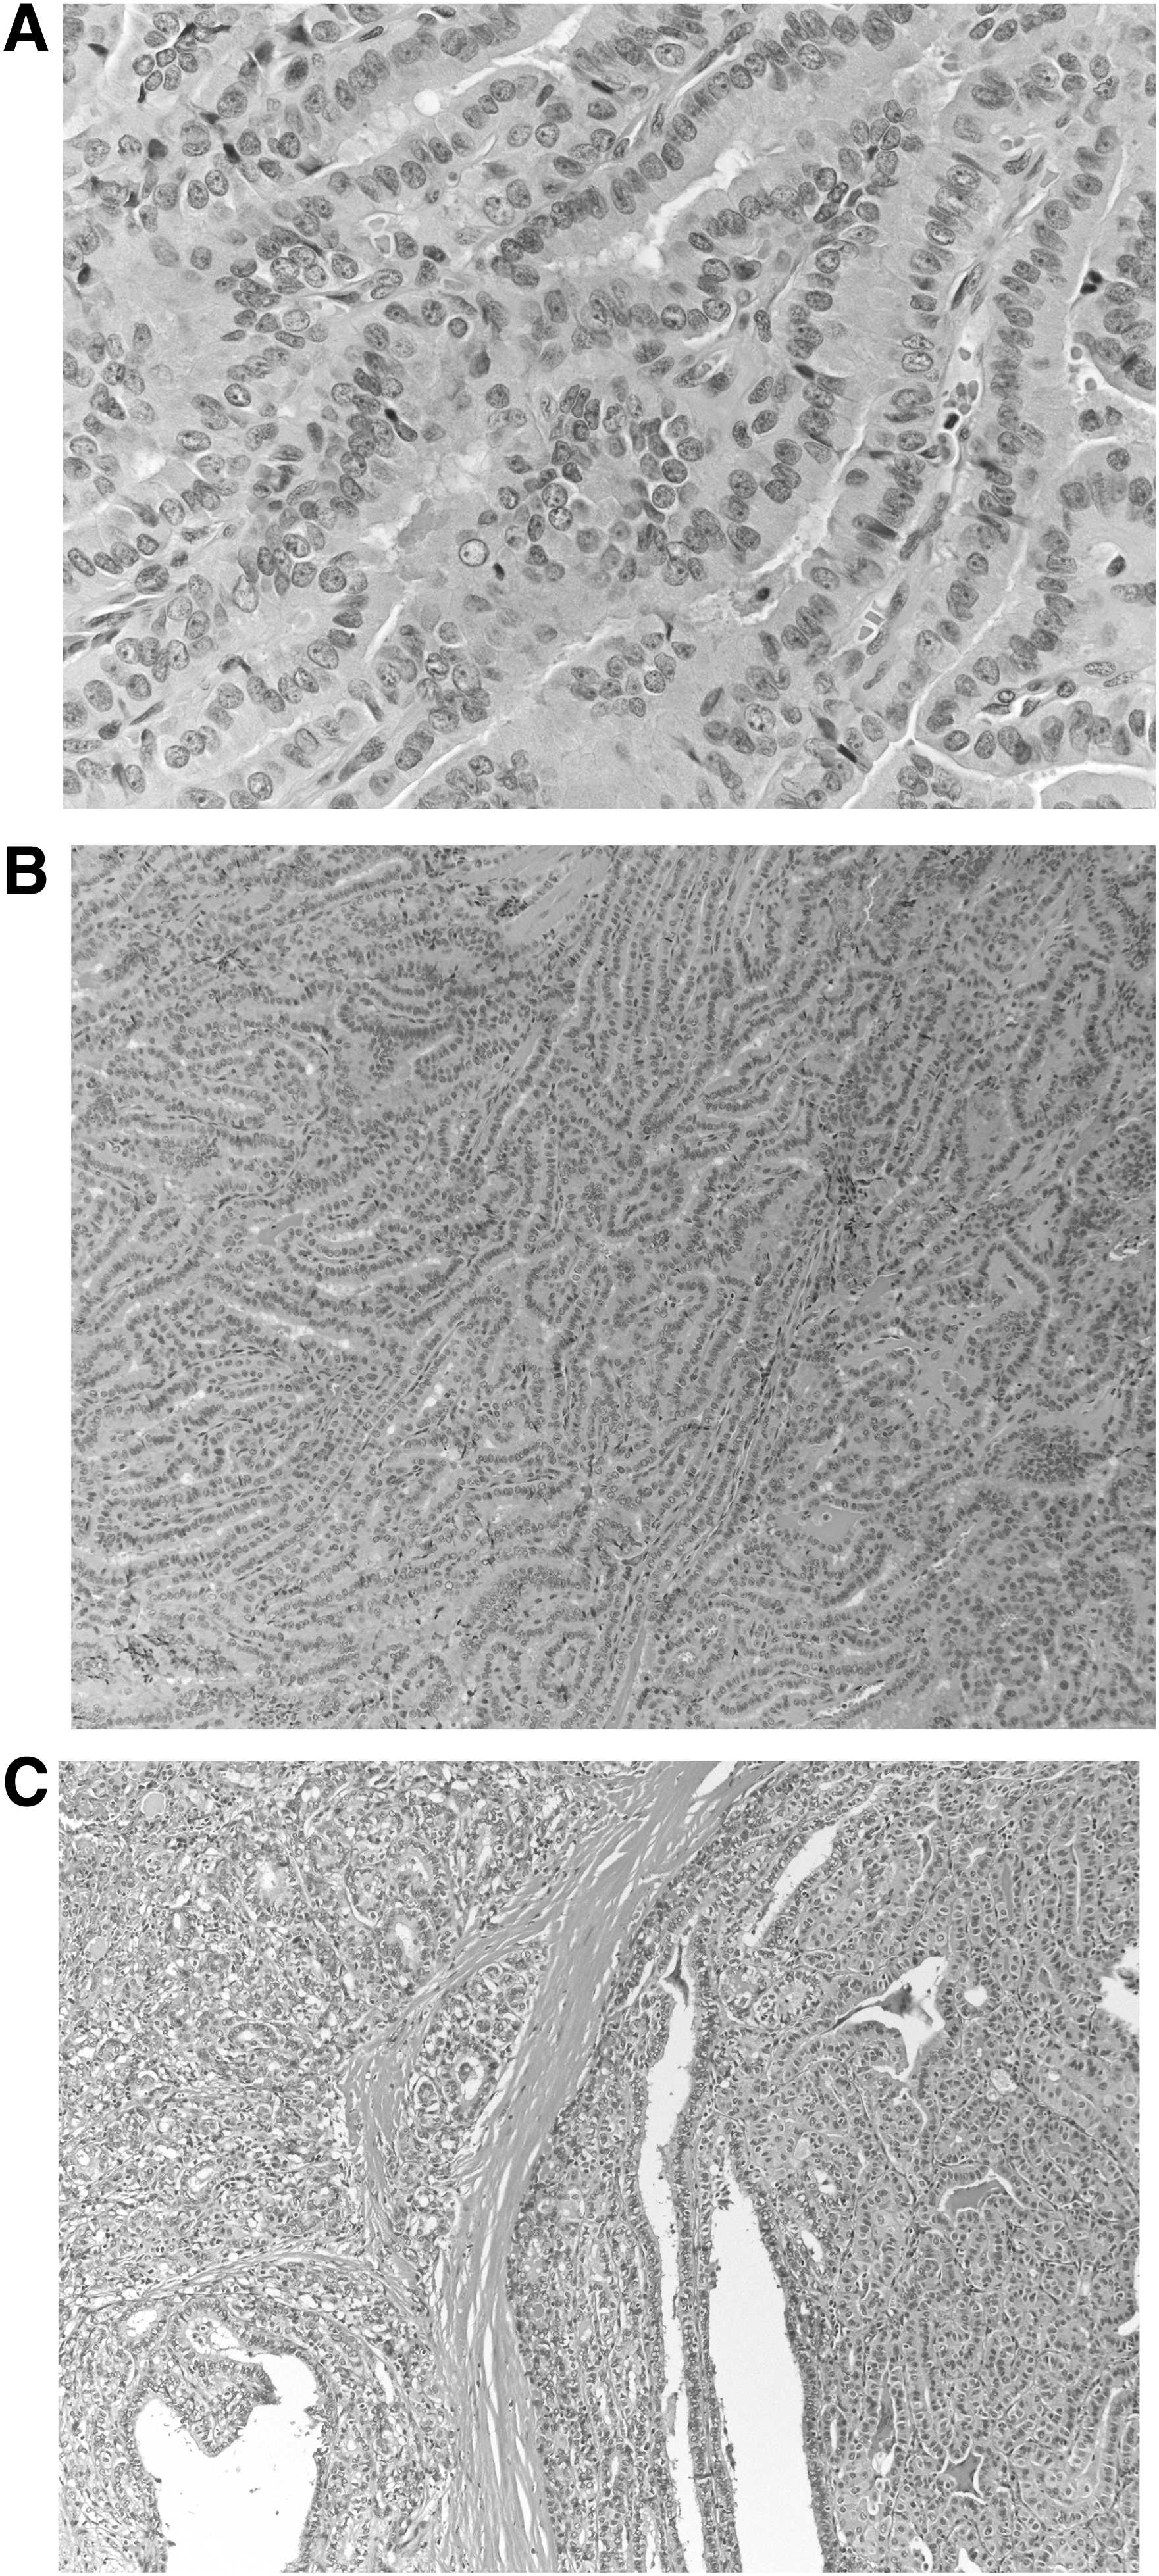
Histological images of PTC with tall cells. Representative H&E-stained sections of PTCs, including: (
Baseline and Pathological Characteristics of the Study Cohort, and Three Groups of Papillary Thyroid Carcinoma
Statistically significant difference between tcPTC and classic PTC.
Statistically significant difference between PTCtcf and classic PTC.
Statistically significant difference between tcPTC and PTCtcf.
AJCC, American Joint Committee on Cancer; PTC, papillary thyroid carcinoma; PTCtcf, PTC with tall cell features; SD, standard deviation; tcPTC, tall cell subtype of PTC.
However, thyroid cancer risk profiles differed significantly between groups at the time of clinical presentation and displayed a range from moderate to aggressive disease as classic PTC was compared with PTCtcf and tcPTC. Twenty-four percent of tcPTC and 16% of PTCtcf were initially classified as ATA high risk compared with 12% of classic PTC patients (p < 0.001) who were classified as high risk. Similarly, the size of primary tumors trended from larger to smaller (2.4 cm in tcPTC vs. 2.0 cm in PTCtcf vs. 1.7 cm in classic PTC, p = 0.001).
Although rates of multifocality, lymph node involvement, and distant metastasis at presentation were similar between all three groups, 41% of tcPTC patients were classified as pT3 or pT4 versus 20% of the PTCtcf and classic PTC groups (p = 0.003). The percentage of patients diagnosed at advanced AJCC stage III or IV was 13% tcPTC versus 8% PTCtcf versus 1.4% classic PTC (p = 0.002). Macroscopic extrathyroidal extension was observed in 38% of the tcPTC group in comparison to 14% and 12% from the PTCtcf and classic PTC groups, respectively (p < 0.001).
The recommended course of treatment proved different between the three subgroups, likely reflecting differences of perceived risk from disease as shown in Table 2. More than 90% of both the tcPTC and PTCtcf groups received RAI therapy, in comparison to 70% of patients in the classic PTC group (p < 0.0001). A higher percentage of patients in the tcPTC group received systemic therapy for advanced disease (11% tcPTC vs. 2% PTCtcf vs. 2% classic PTC, p = 0.01). Thirteen percent of patients with tcPTC versus 5% of PTCtcf versus 1% of classic PTC (p = 0.002) received XRT.
Comparison of Clinical Management and Follow-Up Among the Three Papillary Thyroid Carcinoma Groups
Statistically significant difference between tcPTC and classic PTC.
Statistically significant difference between PTCtcf and classic PTC.
Statistically significant difference between tcPTC and PTCtcf.
Genomic characterization was performed in 30 patients with tcPTC and 37 patients with PTCtcf, as shown in Figure 3. tcPTC and PTCtcf had similar rates of BRAFV600E mutations (86.7% in tcPTC vs. 89.2% in PTCtcf, p = 0.75), while RAS mutations were observed in only a small portion of the tumors (3.3% of tcPTC vs. 5.4% of PTCtcf, p = 0.68). Remarkably, 44.4% (8/18) of tcPTC harbored a TERT promoter mutation at either c.-124C>T (7/18) or c.-146C>T (1/18) hot spots, in comparison to only 6.3% (1/16; at c.-124C>T) of PTCtcf (p = 0.012).

Summary of genomic events in tcPTC and PTCtcf. OncoPrint showing the distribution of oncogenic genetic alterations in the tcPTC (n = 30) and PTCtcf (n = 37) cohorts. Tumor histopathology is color-coded on the top row.
Additional secondary mutations with proven oncogenic potential (other than TERT) were uncommon in both groups, accounting for a total of 6.7% and 5.4% in the tcPTC and PTCtcf groups, respectively. These mutations were found in single tumors and targeted AKT2 and RBM10 genes in the tcPTC group, and TP53 and PIK3CA in the PTCtcf group. Tumors with secondary mutations (including at the TERT promoter), compared with tumors with only driver mutations (BRAF or RAS), showed higher AJCC stage (stage III or IV in 25% vs. 6.3%, p = 0.034) and more distant metastases at presentation (25% vs. 2.1%, p = 0.005).
Three disease-specific deaths were identified: two in the tcPTC cohort and one in the classic PTC group. During follow-up, recurrent/persistent disease was identified in 29% tcPTC, 22% PTCtcf, and 13% classic PTC, and the Kaplan–Meier analysis showed shorter progression-free survival (PFS) for the tcPTC when compared with classic PTC (log rank p = 0.037) (Fig. 4). The 5-year PFS was 76.5% for tcPTC, 81.5% for PTCtcf, and 88.3% for classic PTC. At the last documented follow-up, evidence of disease (i.e., progressive disease, PTC-related death, or low burden disease) was detected in 32%, 22%, and 9% of the tcPTC, PTCtcf, and classic PTC (Table 2, p < 0.001), respectively.
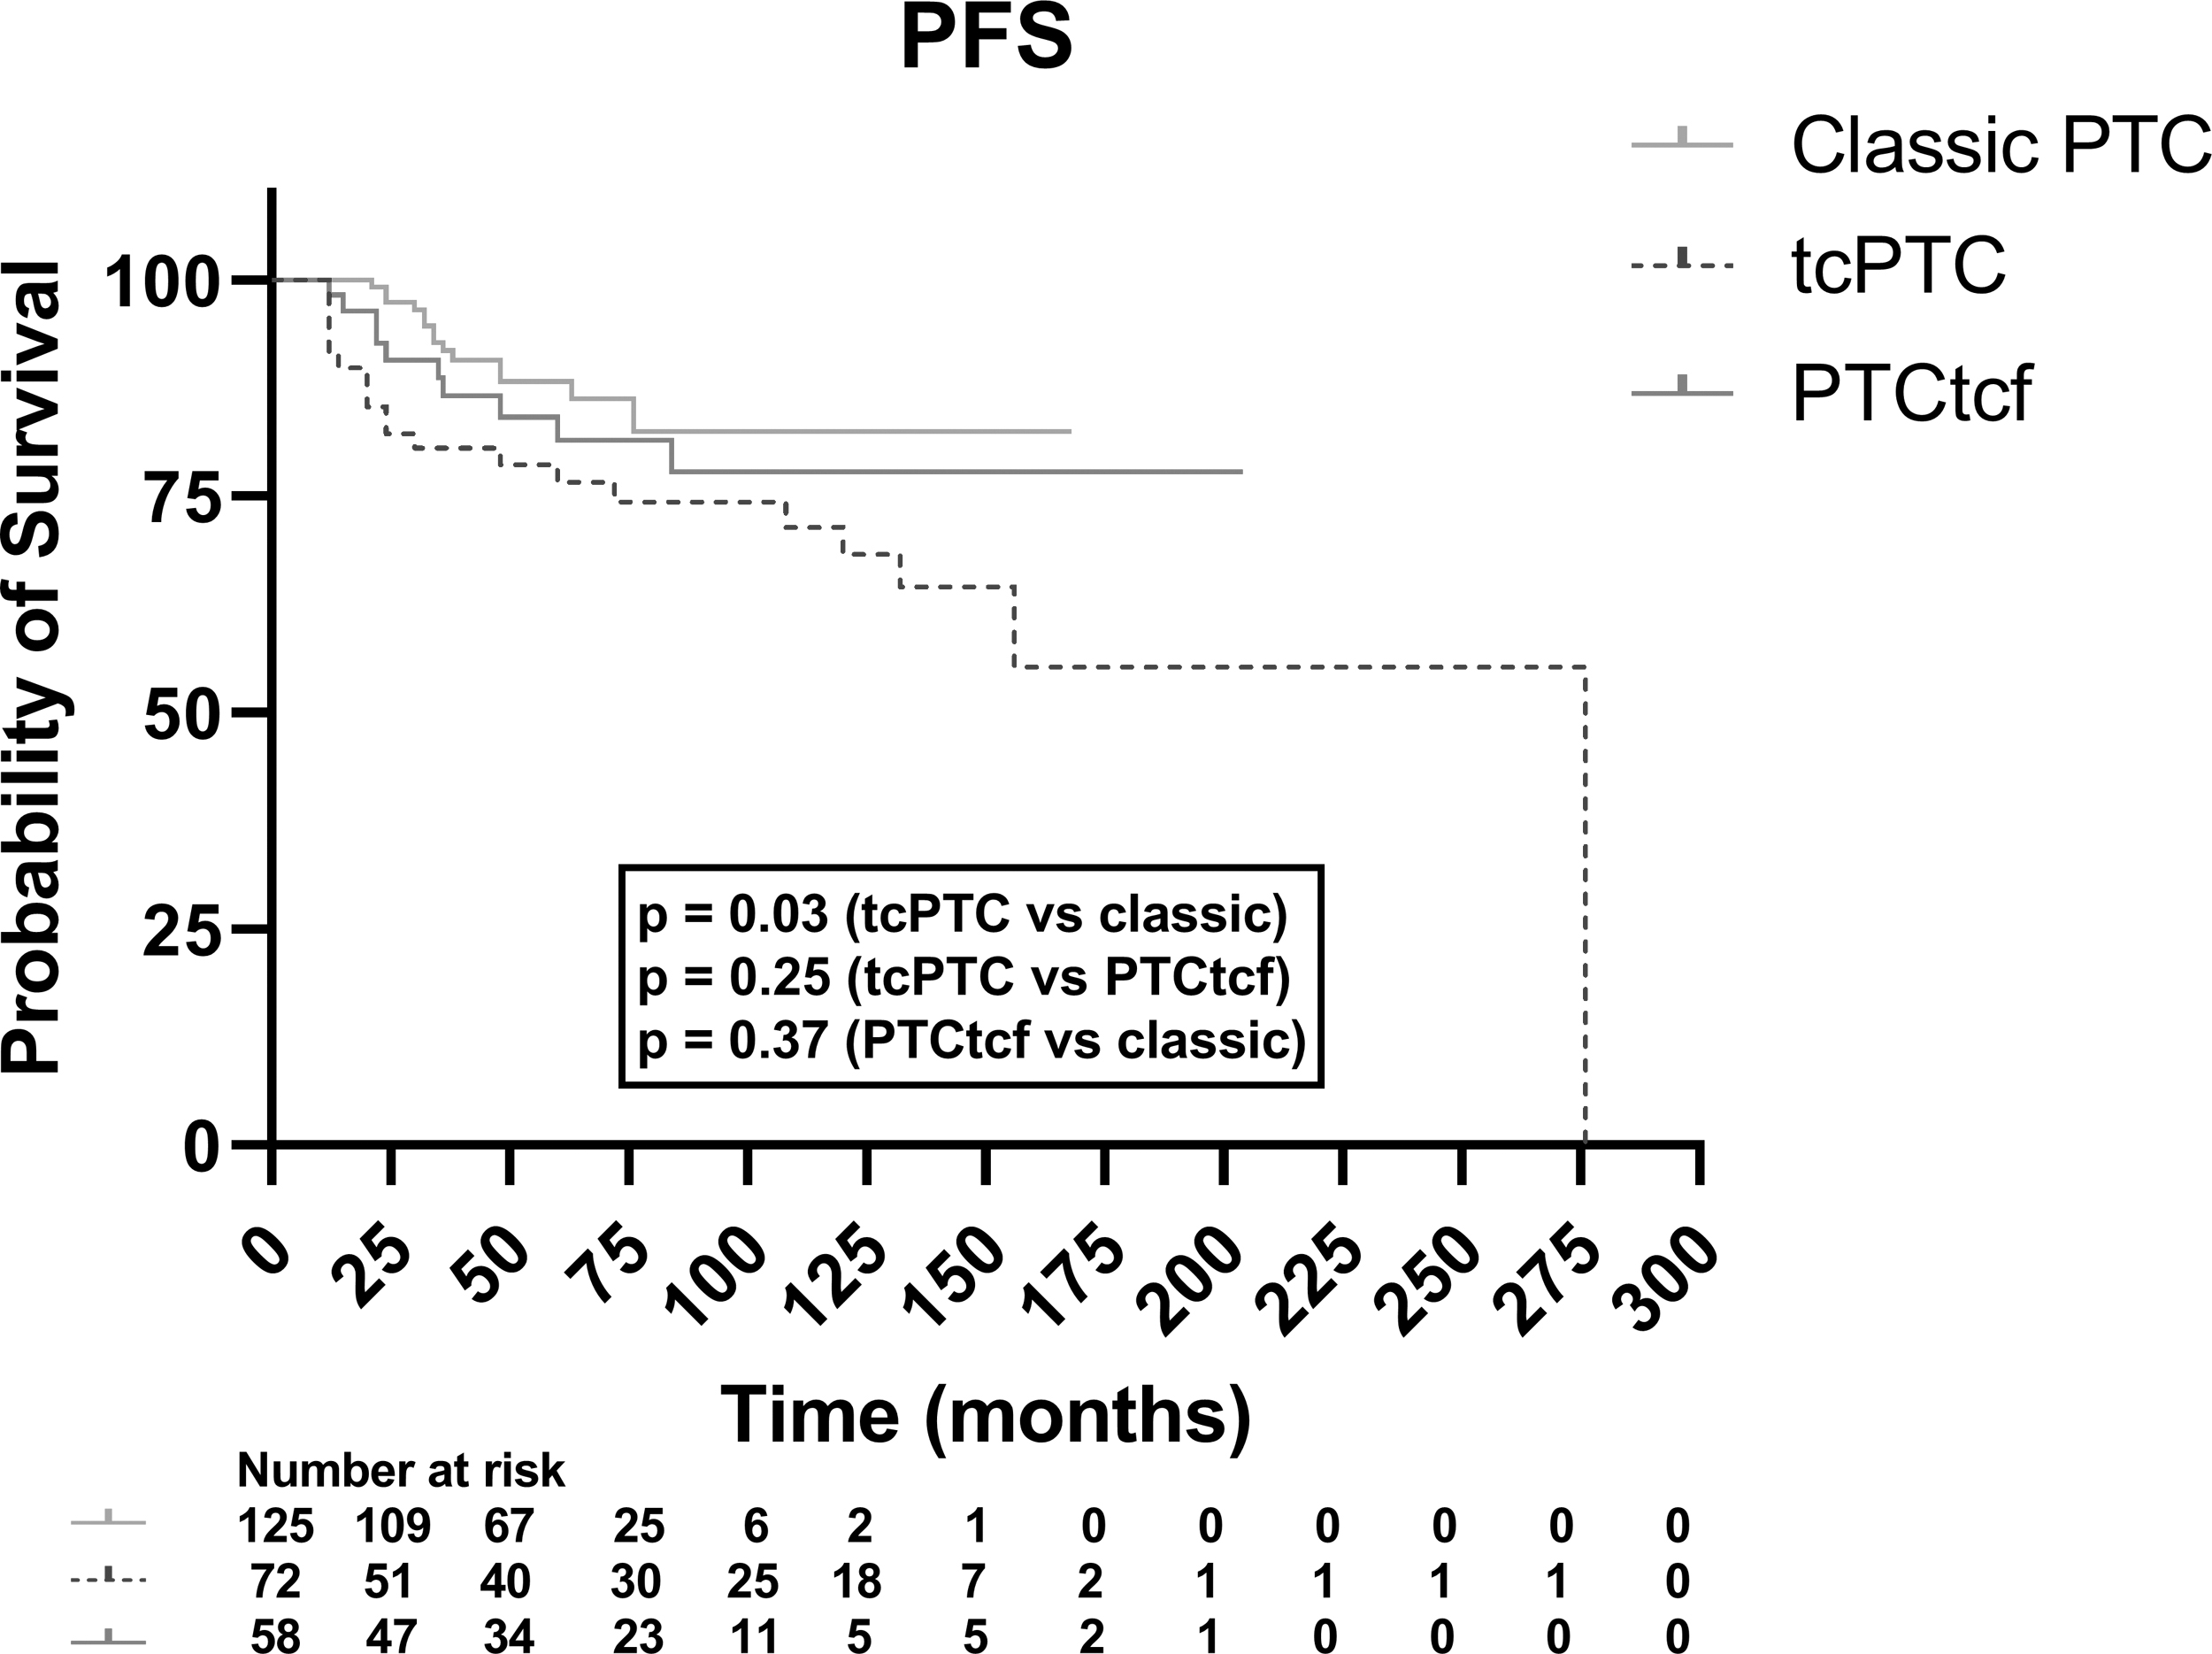
The Kaplan–Meier curve for PFS in tcPTC, PTCtcf, and classic PTC. The Kaplan–Meier curve showing PFS in the three indicated histological groups. Among all the three groups, the log-rank test (Mantel–Cox) approached statistical significance (p = 0.07), while the log-rank test for trend was statistically significant (p = 0.02). PFS, progression-free survival.
The negative composite outcome was observed in 40.2% tcPTC, 20.7% PTCtcf, and 11.2% classic PTC (p < 0.001). TERT promoter status and the presence of secondary mutations were not associated with a negative composite outcome (p > 0.05). We performed a multivariable Cox regression analysis to identify variables independently associated with the negative composite outcome. The variables entered in the model included the histological subtype (tcPTC, PTCtcf, and classic PTC), sex, and AJCC stage (which includes both tumor aggressiveness and age). As shown in Table 3, tcPTC (HR = 4.3, p = 0.03) was independently associated with a negative composite outcome, along with the well-established risk factors of advanced AJCC stage (stage III or IV) and male sex (HR = 3.01, p = 0.03 and HR = 2.6, p = 0.04; respectively).
Multivariable Cox Regression Analysis of Factors Associated with the Negative Composite Outcome
CI, confidence interval.
Finally, we performed a separate analysis of our data, after classifying the tall cell tumors according to the 2022 WHO guidelines (tcPTC ≥30% tall cells, PTCtcf 10–29% tall cells). Using that classification, 10 tumors were reclassified from the PTCtcf to the tcPTC group, bringing the number of cases to 91 tcPTC and 55 PTCtcf. As shown in Supplementary Tables S1 and S2, there continued to be a gradient of aggressiveness from classic PTC to PTCtcf to tcPTC. Genomically, the percentage of tcPTC with TERT promoter mutations decreased from 44% (8/18) to 33% (8/24), and the percentage of PTCtcf increased from 6% (1/16) to 10% (1/10).
The 5-year PFS was 74% for tcPTC, 86% for PTCtcf, and 88.3% for classic PTC (log rank p-values [tcPTC vs. classic PTC] = 0.01; p [PTCtcf vs. classic PTC] = 0.86; p [tcPTC vs. PTCtcf] = 0.06). Similarly, the negative composite outcome was present in 40.5% tcPTC, 17.6% PTCtcf and 11.2% classic PTC (p < 0.001), and tcPTC was independently associated with the negative composite outcome (p = 0.013) (Supplementary Table S3). While the change in the threshold for tcPTC diagnosis caused a slight decrease in the heterogeneity and aggressiveness of the PTCtcf cohort, there was still a well-documented gradient in increased risk from classic PTC to PTCtcf to tcPTC.
Discussion
Subtyping PTC is a routine part of histological evaluation, yet the comparative understanding of implied risk for tumors with a tall cell component remains uncertain. Our data, evaluating 292 patients (146 with tcPTC or PTCtcf; 146 patients with classic PTC), demonstrate for the first time a continuum of cancer risk as PTC ranges from classic, to PTCtcf, and ultimately tall cell subtype. Genomic analysis provides further evidence as to what mutations could be driving such changes in risk, noting the important association of TERT promoter mutations in advanced disease. Our consecutive cohort had minimal selection or sampling bias and had a median follow-up of six years from diagnosis, allowing an accurate understanding of disease recurrence while also assessing the need for advanced treatment. Together, these data provide greater understanding of risk stratification of PTCtcf. Furthermore, they optimally delineate the implied meaning of PTCtcf, identifying it as an intermediate step between both tcPTC and classic PTC, and supporting its identification and reporting.
Others have investigated this area, although not to the extent, we demonstrated through an integrated clinical, histological, and genomic analysis. Some have defined PTCtcf as 10–49% tall cells, with the tall cells at least 3 × as tall as wide, 19 while others defined PTCtcf as 30–49% tall cells. 9,20 In following, some studies then suggested that PTCtcf had similar clinicopathologic features and behaved similar to tcPTC, 8,9,19,21 while others have reported that PTCtcf is not as aggressive or an independent prognostic factor for disease-free survival in patients, and therefore, its prognostic impact is limited. 20 Thus, not surprisingly, PTCtcf has been variably considered with either the more aggressive tcPTC or the less aggressive classic PTC, as opposed to defining such as an intermediary, which our data clearly demonstrate. Furthermore, our data demonstrate the genomic evolution underpinning the clinicopathologic differences.
A clear delineation of differences between tcPTC, PTCtcf, and classic PTC is important as clinicians increasingly seek to individualize management decisions. Furthermore, a consistent classification schema is critical for the broad application of these data worldwide. In 2017, the WHO changed the tcPTC definition (decrease in both percent of tall cells and required height of cells) leading to 3 × the diagnoses of tcPTC. 14 Similar results were reported in another study that showed that under the new WHO definition the number of tcPTC would increase by 28%. 22 However, that would have significant clinical ramifications and could potentially negate recent efforts to decrease overtreatment of thyroid cancers. 23
Based on these concerns, in our institution, we use a cutoff of 50% tall cells to define tcPTC. In the current study, we have, however, used both cutoffs to provide some uniformity to the data and facilitate comparisons to the literature and increase generalizability of our results. Also, recognizing and reporting PTCtcf as an intermediate entity can provide guidance as clinicians can follow patients more closely, but at the same time avoid overtreatment. Hence, it is necessary that clinicians employ all available means at their disposal, such as the presence/absence of other aggressive clinicopathologic features, or the utilization of genomic information, when making a management decision.
Previous studies have mostly examined the BRAFV600E mutational status, but the current report is the first one, to our knowledge, with extensive data from an NGS panel including hundreds of genes specifically comparing the genomic profiles of PTCtcf and tcPTC. The results of the current study are consistent with results of previous studies that reported a BRAFV600E mutation in 80–100% of cases in both tcPTC and PTCtcf groups. 24 We found a significantly higher percentage of TERT promoter mutations in our tcPTC cohort (44%) than in a recent series (16%) of targeted NGS in 25 cases of tcPTC, 25 which could be explained by the more conservative definition of tcPTC used at our institution (≥50% cells as tall as wide). When we performed an analysis with tcPTC classified as ≥30% tall cells, the percentage of TERT promoter mutations dropped to 33%, further supporting our hypothesis of the continuum of disease.
Importantly, the TERT hot spot promoter mutations were significantly higher in our tcPTC group when compared with PTCtcf, and it remains to be investigated if those are driving the presence of more tall cells, and hence aggressiveness. Secondary oncogenic alterations, and especially in PI3K signaling pathway, have been found to confer worse prognosis in BRAFV600E PTCs. 16 In the current study, secondary oncogenic alterations (including TERT promoter mutations) were found to be associated with the presence of distant metastases and advanced AJCC stage, but neither TERT promoter mutations alone nor secondary mutations were associated with a negative composite outcome. The lack of consistent associations could be attributed to the low numbers (total of 13 patients), but there could also be unknown factors contributing to the aggressiveness of those tumors that are yet to be discovered.
We acknowledge limitations to our study. Initially, the design of this study was retrospective. However, the inclusion of consecutive patients provided a fair representation of the patient population in a tertiary referral center. Separately, not all tumors in our study were submitted entirely for histological evaluation beyond what is recommended by the WHO criteria, 26 and therefore, this could introduce sample bias. However, one section per centimeter of tumor was submitted for all cases, per standard grossing protocol, 13 and the two groups (fully submitted and those not) were very similar in a separate comparative analysis. Our cohort size, although one of the largest published of tumors with tall cell morphology, remains relatively modest especially as we attempted to define subgroups with TERT promoter and other oncogenic mutations.
Larger studies may be needed to examine the association between genomic alterations and negative outcomes in patients with tcPTC and PTCtcf. Moreover, the size of our cohort did not allow for a propensity score matching between patients with classic PTC and patients with tcPTC and PTCtcf. Next, although we recorded high-quality follow-up data, outcome information was not available for 15% of subjects. These two factors limit the statistical power of our findings, and thus, it would be very important to confirm them in larger patient cohorts. We acknowledge that the tcPTC and PTCtcf that were submitted for NGS by clinicians could have been more aggressive clinically; however, that should not affect the comparative nature of this study as both tcPTC and PTCtcf were examined, and our study is the first, to our knowledge, to report NGS data on the difference between those two cohorts.
Conclusions
In conclusion, these data provide the most extensive clinicopathologic and genomic characterization of tcPTC and PTCtcf, more clearly defining PTCtcf as an intermediate subgroup between tcPTC and classic PTC not only in terms of histology but also aggressive biology potential. TERT promoter mutations appear to be enriched in tcPTC, and thus, interrogation of TERT status could provide useful for cases that are histologically borderline for tcPTC versus PTCtcf. As such, genomic characterization could help guide management and follow-up clinical decisions. We certainly acknowledge the cost and availability issues in clinical practice, but that would be another step toward a personalized care-delivery model for patients with thyroid cancer.
Footnotes
Acknowledgment
The authors would like to thank Wei Wang, PhD, for biostatistical support.
Authors' Contributions
A.B.: Conceptualization (equal), data collection (lead), writing—original draft (lead), formal analysis (lead), writing—review and editing (equal). K.W.: Data collection (lead), formal analysis (lead), writing—review and editing (equal). T.P.: Data collection (equal), formal analysis (equal), review and editing (equal). S.A. and C.B.W.: Data collection (equal), writing—review and editing (equal). E.M., P.X., B.A., and J.H.: Writing—review and editing (equal). J.A.B.: Formal analysis (equal), review and editing (equal). I.L.: Conceptualization (equal), formal analysis (lead), writing—original draft (equal), writing—review and editing (equal). E.K.A.: Conceptualization (lead), writing—original draft (equal), writing—review and editing (equal).
Author Disclosure Statement
E.K.A.: Consultant, Veracyte, Inc., and Roche Diagnostics, Inc. All other authors have nothing to disclose.
Funding Information
No funding was received for this article.
Supplementary Material
Supplementary Table S1
Supplementary Table S2
Supplementary Table S3
Supplementary Table S4
Supplementary Table S5