
Abstract
Background:
Low levels of triiodothyronine (T3) are common in patients with heart failure (HF). Our aim was to evaluate the effects of supplementation with low and replacement doses of T3 in an animal model of HF with preserved ejection fraction (HFpEF).
Methods:
We evaluated four groups: ZSF1 Lean (n = 8, Lean-Ctrl), ZSF1 Obese (rat model of metabolic-induced HFpEF, n = 13, HFpEF), ZSF1 Obese treated with a replacement dose of T3 (n = 8, HFpEF-T3high), and ZSF1 Obese treated with a low-dose of T3 (n = 8, HFpEF-T3low). T3 was administered in drinking water from weeks 13 to 24. The animals underwent anthropometric and metabolic assessments, echocardiography, and peak effort testing with maximum O2 consumption (VO2max) determination at 22 weeks, and a terminal hemodynamic evaluation at 24 weeks. Afterwhile myocardial samples were collected for single cardiomyocyte evaluation and molecular studies.
Results:
HFpEF animals showed lower serum and myocardial thyroid hormone levels than Lean-Ctrl. Treatment with T3 did not normalize serum T3 levels, but increased myocardial T3 levels to normal levels in the HFpEF-T3high group. Body weight was significantly decreased in both the T3-treated groups, comparing with HFpEF. An improvement in glucose metabolism was observed only in HFpEF-T3high. Both the treated groups had improved diastolic and systolic function in vivo, as well as improved Ca2+ transients and sarcomere shortening and relaxation in vitro. Comparing with HFpEF animals, HFpEF-T3high had increased heart rate and a higher rate of premature ventricular contractions. Animals treated with T3 had higher myocardial expression of calcium transporter ryanodine receptor 2 (RYR2) and α-myosin heavy chain (MHC), with a lower expression of β-MHC. VO2max was not influenced by treatment with T3. Myocardial fibrosis was reduced in both the treated groups. Three animals died in the HFpEF-T3high group.
Conclusions:
Treatment with T3 was shown to improve metabolic profile, myocardial calcium handling, and cardiac function. While the low dose was well-tolerated and safe, the replacement dose was associated with increased heart rate, and increased risk of arrhythmias and sudden death. Modulation of thyroid hormones may be a potential therapeutic target in HFpEF; however, it is important to take into account the narrow therapeutic window of T3 in this condition.
Introduction
Thyroid hormones are important modulators of cardiovascular function. 1,2 Hypothyroidism has been associated with an increased risk of myocardial dysfunction and heart failure (HF). 3,4 Several guidelines propose the screening of thyroid dysfunction in HF and the correction of thyroid function to improve prognosis in HF. 5,6
Patients with HF frequently have low triiodothyronine (T3) levels related to a high prevalence of nonthyroidal illness syndrome. 4,7 –10 In these patients, the cardiovascular dysfunction and the proinflammatory systemic status change deiodinase activity, leading to lower conversion of thyroxine (T4) into T3 and higher thyroid hormone breakdown. 11 Even in patients with normal plasma thyroid hormone levels, local imbalances in deiodinase activity may lead to local myocardial hypothyroidism. 12 Previous studies have evaluated the effects of thyroid hormone supplementation in animal models of HF with reduced ejection fraction (HFrEF), 13 postmyocardial infarction, 14 experimental diabetes mellitus, 15 and hypertensive heart disease, 16,17 in which most studies suggested benefits, but some showed evidence for potential harm with thyroid hormone supplementation, particularly at higher doses. 16,18,19
Randomized clinical trials (RCTs) in humans have also suggested a potential benefit of supplementation of T3 in HFrEF, 20 after acute myocardial infarction 21 and in patients undergoing cardiac surgery. 22 However, these studies had limited follow-up and were underpowered to detect potential adverse effects.
Few studies have assessed the effects of thyroid hormone supplementation in HF with preserved ejection fraction (HFpEF). The evaluation of thyroid hormone supplementation in HFpEF is relevant because (1) HFpEF is responsible for at least half of the cases of HF 23 ; (2) diastolic dysfunction and systemic metabolic dysfunction are central elements of the pathophysiology of HFpEF 24 ; and (3) thyroid hormones improve diastolic function and systemic metabolic function. 12
Therefore, the aim of this study was to evaluate the effects of treatment with low dose and replacement dose of T3 in an animal model of HFpEF.
Materials and Methods
Experimental model
Two independent cohorts of male ZSF1 Lean (Lean-Ctrl, n = 8) and ZSF1 Obese (HFpEF groups, n = 29) rats were purchased from Charles River Laboratories (Barcelona, Spain) at the age of 12 weeks. The sample size was decided according to previous studies and preliminary data. 15,25 The animals were housed in groups of two per cage in an isolated ventilated cage system (IVC), and maintained on a 12-hour light–dark cycle, with full access to the recommended diet (LabDiet® 5008; International Product Supplies Ltd.) and water. ZSF1 Obese Rat is an experimental rat model of HFpEF associated with metabolic syndrome. The detailed characterization of this animal model was previously described. 26,27
All procedures were reviewed and approved by the Ethics Committee of the Faculty of Medicine of University of Porto (FMUP), FMUP Animal Welfare and Ethics Review Body (Orgão de Bem-Estar e Ética Animal [ORBEA]), and the Portuguese competent authority (Direção Geral de Alimentação e Veterinária [DGAV], process No. 010334) and were done according to the Guide for the Care by the National Institutes of Health (NIH Publication No. 85–23, revised 2011), EU Directive 2010/63/EU and Decreto-lei 113/2013 national legislation. All procedures were carried out by properly trained and licensed researchers.
Experimental procedure
At 13 weeks of age, ZSF1 Obese rats were randomly allocated to receive T3 (T6397; Sigma-Aldrich) supplementation in drinking water in replacement dose (HFpEF-T3high, n = 8), low dose (HFpEF-T3low, n = 8), or solo drinking water (HFpEF, n = 13), as described in the Supplementary Data. Replacement dose T3 was calculated to normalize myocardial T3 levels according to the literature and preliminary data (data not shown). 28 In the HFpEF-T3high group, animals received an initial T3 concentration in the water of 0.04 μg/mL (40 μg/mL T3, 50% ethanol, 48.5% glycerol) from 13 to 16 weeks of life, increasing after that to 0.06 μg/mL (60 μg/mL T3, 50% ethanol, 48.5% glycerol). HFpEF-T3low received half of the maximum dose used for HFpEF-T3high groups (0.03 μg/mL of T3 concentration in the drinking water—30 μg/mL T3, 50% ethanol, 48.5% glycerol, starting at 13 weeks until the end of the protocol).
Oral glucose tolerance testing, insulin resistance, metabolic cage studies, and peak effort testing
At 22 weeks, animals underwent oral glucose and insulin resistance (IR) testing as previously described. 25 On the following day, animals underwent a 24-hour acclimatization period in metabolic cages. Water and food intake and urine output were registered for 24 hours (Techniplast, Buguggiate, Italy). The maximum oxygen consumption (VO2max) by maximum effort test was evaluated at 22 weeks of age as described in the Supplementary Data.
Echocardiographic evaluation
Echocardiography evaluation was performed at 22 weeks of age using a 15-MHz linear probe and an echocardiography system (Acuson Sequoia C512; Siemens). Structural and functional evaluation was performed as previously described. 29 At least three stable cardiac cycles were averaged for all measurements.
Hemodynamic and electrocardiographic evaluation
At 24 weeks of age, animals were sedated, anesthetized, and mechanically ventilated as previously described. 29 The surgical preparation consisted of a left thoracotomy, and placement of a pressure-volume catheter in the left ventricle (LV) through the apex (SPR-847; Millar Instruments) and a flow probe (2.5PS; Transonic) in the ascending aorta. Hemodynamic recordings were made after a stabilization period of 15 minutes, as previously described. 25 Electrocardiographic (ECG) recordings were also obtained. Detection of premature ventricular contractions (PVCs) was based on the distance between two R waves (RR)-interval signal during stable periods. The RR interval features were normalized by the mean value of all RR intervals within the same ECG recording. 30 Classification of PVCs was performed as previously described. 31
At the end, the animals were euthanized under anesthesia by exsanguination. Once concluded, the heart was removed, and the apex was cut for molecular studies. The remaining heart was quickly used for cardiomyocyte isolation. Blood samples were collected, and the remaining organs were excised, weighed, and stored at −80°C. The weights were normalized to tibia length.
Serum and tissue thyroid hormone evaluation
At 24 weeks, circulating thyrotropin (TSH) concentration was evaluated by enzyme-linked immunosorbent assay (ELISA; E-EL-R0976). T4 and T3 were quantified by specific and highly sensitive radioimmunoassays in the serum, LV, adipose tissue, and skeletal muscle (gastrocnemius), after appropriate extraction and purification of tissue extracts as described. 32 High specific activity T4 and T3 labeled with 125I were synthesized as described. 33
Histological evaluation of myocardium
We evaluated LV myocardial fibrosis using Sirius red staining as described in the Supplementary Data.
Single cardiomyocyte evaluation
The hearts were enzymatically perfused to isolate cardiomyocytes, as described in the Supplementary Data. Cardiomyocytes were placed in temperature-controlled MatTek dishes at 37°C, containing 1.8 mM Ca2+ Tyrode's buffer. Platinum electrodes were immersed in the solution for stimulation, coupled to a MyoPacer. Ca2+ transients and sarcomere shortening were simultaneously recorded in an inverted microscope by an IonOptix system (IonOptix, Milton, MA) similar to what has been previously described. 34,35 Briefly, cardiomyocytes were placed in a heated chamber mounted on the stage of an Olympus AE31 inverted microscope. After selection of an isolated, rod-shaped cardiomyocyte with clear striation and that did not spontaneously contract, the analysis was initiated.
Before measuring, the solution containing the intact isolated cardiomyocytes was incubated for 20 minutes with a Ca2+-sensitive dye, 1mM FURA-2AM (F1221; Thermo Fisher Scientific®, Waltham, MA). Loaded cells were electrically stimulated at different frequencies with 14 ms bipolar pulse waves. The fluorescence emitted at 340 and 380 nm was alternately recorded and a ratiometric fluorescence/fluorescence ratio was the indicator of cytosolic Ca2+ concentration.
Real-time quantitative polymerase chain reaction
RNA was extracted from the LV after tissue disruption with zirconium beads and TRIzol. Following centrifugation, RNA in the aqueous phase was precipitated with isopropanol and washed with 70% ethanol. After resuspension, quantification of RNA concentration was performed in the NanoDrop (Thermo Fisher Scientific) and integrity was evaluated by electrophoresis. Synthesis of complementary DNA (cDNA; 100 ng/μL) was executed using the SensiFAST™ cDNA Synthesis Kit (Meridian Bioscience, Inc.®, Cincinnati, OH), with reactions conducted in a T100 thermal cycler (Bio-Rad®, Hercules, CA). Quantitative polymerase chain reactions (qPCRs) were run in triplicate following the protocol of SEnsiFAST SYBR Hi-ROX Mix (Biolone) using the PikoReal™ Real-Time PCR System (Thermo Fisher Scientific), as previously described. 36,37 Sequences of the specific PCR primer pairs used are in Supplementary Table S2.
The β-actin gene was used to normalize target gene expression. Initial mRNA expression data were log-transformed using the 2−ΔΔCT method and expressed as relative to the mean obtained for the Lean-Ctrl group.
Immunoblotting
Immunoblotting was performed as previously described. 38 Briefly, protein extracts from the heart were separated by sodium dodecyl sulfate–polyacrylamide gel electrophoresis (SDS-PAGE) using 4–20% gradient polyacrylamide gels (Criterion™ TGX™ Precast Gels, No. 5671095; Bio-Rad) and then electroblotted into nitrocellulose membranes (Trans-Blot® Turbo; Bio-Rad). Blots were blocked and incubated with primary antibodies to phospholambam (MA3-922; Thermo Fisher Scientific), phospho-phospholambam (8496; Cell Signaling) ATPase sarcoplasmic/endoplasmic reticulum Ca2+ transporting 2 (SERCA2a; PA1-211A/IRDye 800; ab3625; Abcam), and thyroid hormone receptors α (PA1-211A; Thermo Fisher Scientific) and β (ab180612; Abcam) overnight at 4°C. The immunoblots were subsequently washed and incubated with 700 or 800 nm infrared dye-conjugated antibodies (Nos. 926-68020 and 926-32211; LI-COR Biosciences). The membrane was imaged by scanning at 800 and 700 nm with an Odyssey Infrared Imaging System (LI-COR Biosciences). Glyceraldehyde-3-phosphate dehydrogenase (GAPDH) was used as an internal control (ab8245; Abcam) and the control group was set as reference.
Statistical analysis
Statistical analysis was performed using GraphPad Prism (version 9.4.1; Dotmatics) and Stata (version 17.0; StataCorp). For normally distributed variables, we performed a one-way analysis of variance test, followed by Tukey's multiple comparisons test to assess differences between groups. For non-normally distributed variables, we performed the Kruskal–Wallis test, followed by Dunn's multiple comparison test. Group data are presented as mean ± standard error mean or as median (interquartile range). Statistical significance was set at a p-value <0.05.
Results
Serum and tissue thyroid hormones
HFpEF animals were shown to have lower serum and myocardial thyroid hormone levels than Lean-Ctrl (Fig. 1A, B). Treatment with both low and replacement dose of T3 did not normalize serum T3 levels, but increased myocardial T3 levels, with correction of myocardial T3 levels in the HFpEF-T3high group. TSH levels were higher in HFpEF than Lean-Ctrl and were normalized by replacement-dose but not low-dose T3 (Fig. 1A). Serum and tissue T4 levels were decreased in HFpEF-T3low and HFpEF-T3high (Fig. 1A, B). Levels of T3 at adipose level were higher in the HFpEF-T3high than in the HFpEF (Fig. 1C), and at skeletal muscle level were higher in HFpEF-T3high and HFpEF-T3low groups, compared with Lean-Ctrl and HFpEF (Fig. 1D).
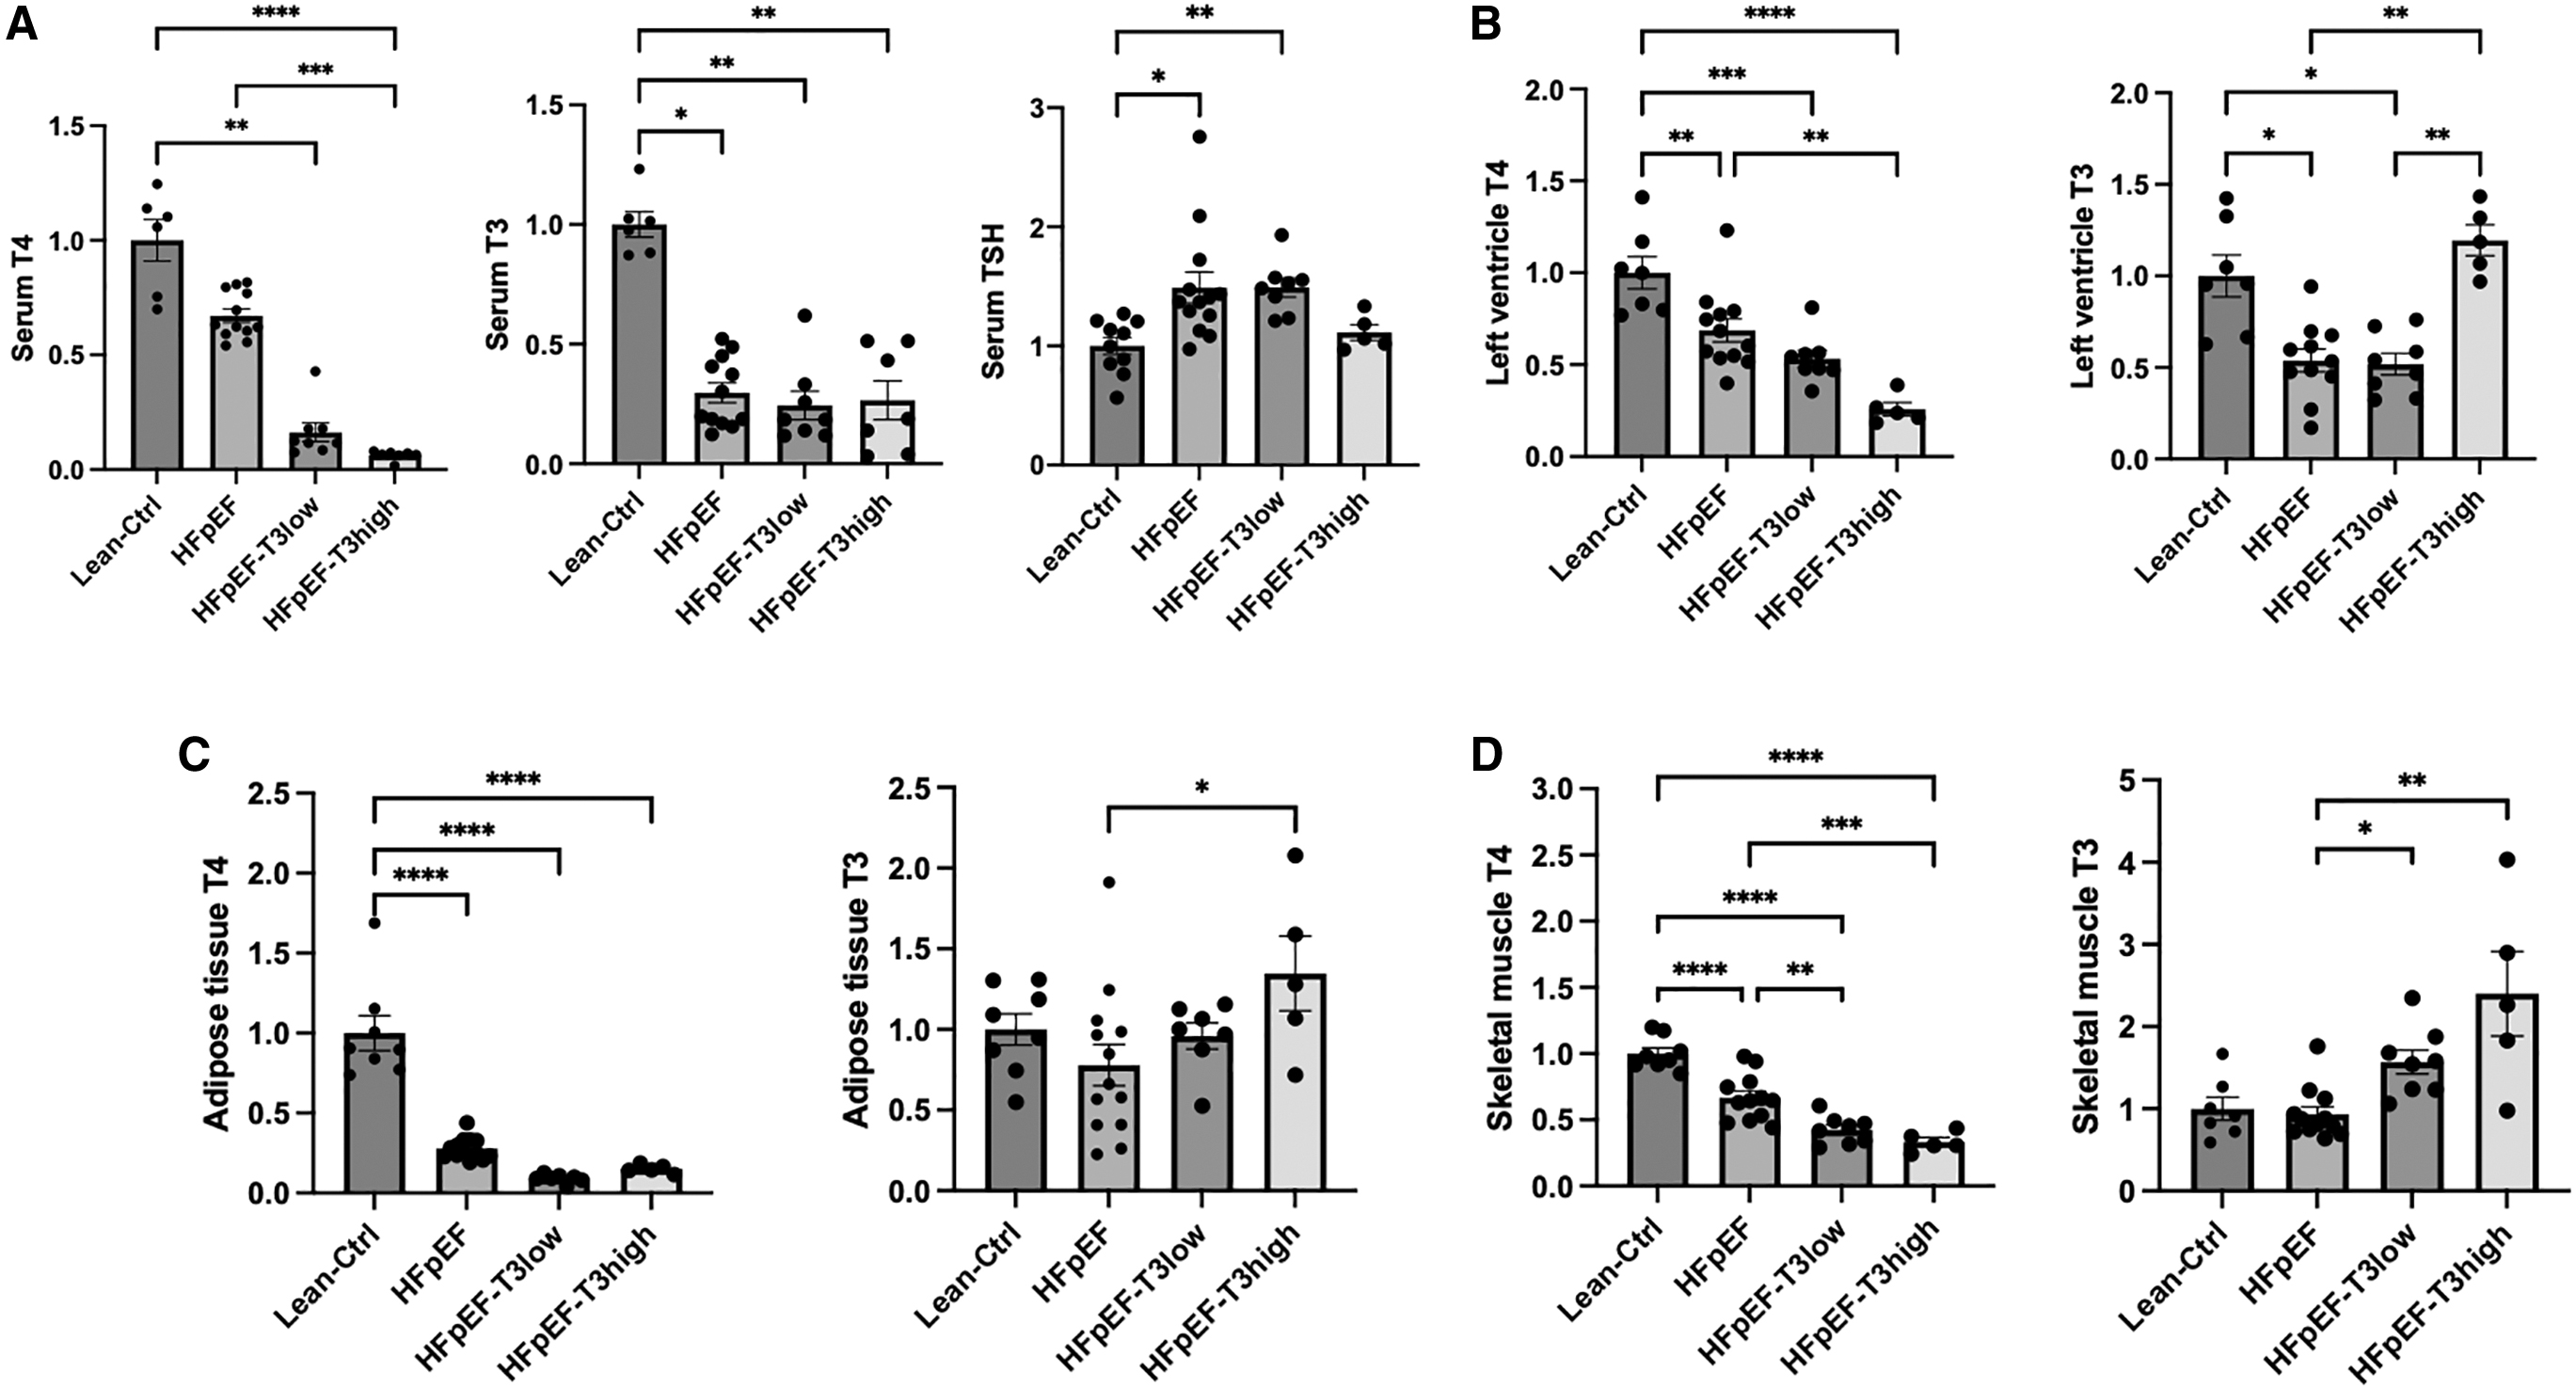
Serum and tissue thyroid hormones at 24 weeks from Lean-Ctrl (n = 8), HFpEF (n = 13), HFpEF-T3low (n = 8), and HFpEF-T3high (n = 5). TSH was evaluated by ELISA and T4 and T3 were quantified by specific and highly sensitive radioimmunoassay. Results are expressed as relative fold increase above the mean value of thyroid hormone levels from the Lean-Ctrl group arbitrarily fixed at 1. (
Anthropometric parameters, metabolic effects, and peak effort testing
HFpEF had higher body weight, perigonadal fat, perirenal fat, and liver weight than Lean-Ctrl. In comparison with HFpEF, body weight was significantly decreased in HFpEF-T3low and HFpEF-T3high groups (Table 1).
Anthropometric, Metabolic Parameters and Peak Effort Testing
Anthropometric parameters at week 24. IR test, glucose tolerance test and peak effort testing were conducted at week 22. Organs weight were normalized for tibial length. Significant differences between HFpEF-T3low or HFpEF-T3high groups vs. HFpEF are highlighted in bold.
p < 0.05 vs. Lean-Ctrl.
p < 0.05 vs. HFpEF.
p < 0.05 vs. HFpEF-T3low.
AUC, area under the curve; HFpEF, heart failure with preserved ejection fraction; IR, insulin resistance; OGTT, oral glucose tolerance test; T3, triiodothyronine; VO2max, maximum oxygen consumption.
Area under the curve in the oral glucose tolerance test (OGTT AUC) and IR (IR AUC) were significantly higher in the HFpEF compared with Lean-Ctrl. An improvement in both OGTT AUC and IR AUC was observed in the HFpEF-T3high group but not in the HFpEF-T3low group.
Compared with Lean-Ctrl, HFpEF animals had lower VO2max, and lower distance run. Treatment with T3 did not significantly change VO2max or distance run.
Echocardiography
In the echocardiographic evaluation at 22 weeks of age, HFpEF had a higher LV mass, isovolumetric relaxation time (IVRT), E/e′ (ratio between peak E wave velocity and peak E′ wave velocity), left atrial (LA) area, and lower S′ (peak systolic velocity of tissue Doppler at the lateral mitral annulus) than the Lean-Ctrl (Table 2). HFpEF-T3high and HFpEF-T3low groups had echocardiographic evidence of improved diastolic and systolic function. Both the treated groups had improved IVRT, ejection time, and S′ compared with HFpEF. HFpEF-T3high showed higher heart rate (315.5 ± 9.9 vs. 297.8 ± 9.1 bpm, p < 0.05) and lower E/e′ than HFpEF. The LV mass and LA area were not significantly different between the HFpEF and treated groups.
Echocardiographic Evaluation at 22 Weeks of Age
Significant differences between HFpEF-T3low or HFpEF-T3high groups vs. HFpEF are highlighted in bold. E/A: ratio between peak E and A waves of pulsed-wave Doppler mitral flow velocity; E/e′: ratio between peak E wave velocity of pulsed-wave Doppler mitral flow and peak E′ wave velocity of tissue Doppler at the lateral mitral annulus; S′: peak systolic velocity of tissue Doppler at the lateral mitral annulus.
p < 0.05 vs. Lean-Ctrl.
p < 0.05 vs. HFpEF.
p < 0.05 vs. HFpEF-T3low.
ET, ejection time; HR, heart rate; IVCT, isovolumetric contraction time; IVRT, isovolumetric relaxation time; LAA, left atrial area; LV, left ventricle.
Hemodynamic and ECG evaluations
In the hemodynamic evaluation at 24 weeks of age, HFpEF had an increased LV stiffness as assessed by the β (chamber stiffness constant derived from exponential), LV end-diastolic pressure, and arterial elastance (Table 3). A trend for a prolonged time constant of isovolumetric relaxation (Tau) in HFpEF was also present (p = 0.061). LV systolic function was confirmed to be normal in HFpEF rats, evident from LV ejection fraction, LV end-systolic pressure, dP/dt max, and end-systolic pressure–volume relationship Eesi (slope of indexed linear end-systolic pressure–volume relationship). Treatment with T3 decreased Tau and arterial elastance in both groups compared with HFpEF, and normalized the LV stiffness to the levels of Lean-Ctrl group.
Hemodynamic Evaluation at 24 Weeks of Age
Significant differences between HFpEF-T3low or HFpEF-T3high groups vs. HFpEF are highlighted in bold.
β: β chamber stiffness constant derived from exponential end-diastolic pressure–volume relationship; dP/dtmax: maximum rate of pressure rise; dP/dtmin: maximum rate of pressure fall; Eesi: slope of indexed linear end-systolic pressure–volume relationship; Tau: exponential decay of the ventricular pressure during isovolumic relaxation.
p < 0.05 vs. HFpEF.
p < 0.05 vs. Lean-Ctrl.
CI, cardiac index; DBP, diastolic blood pressure; Eai, indexed arterial elastance; EDVi, end-diastolic volume index; EF, ejection fraction; LVEDP, left ventricle end-diastolic pressure; LVESP, left ventricle end-systolic pressure; MAP, mean arterial pressure; SBP, systolic blood pressure.
HFpEF-T3high group also had higher cardiac index (158.0 ± 9.5 vs. 121.3 ± 4.9 μL/min/cm2, p < 0.05) and ejection fraction (76.7% ± 5.9% vs. 63.2% ± 2.3%, p < 0.05) than the HFpEF group, as well as a lower diastolic blood pressure than the Lean-Ctrl (p < 0.05) and HFpEF (p = 0.070) groups. HFpEF-T3 low group showed a trend for a lower β compared with the HFpEF group (p = 0.066), and a lower end-diastolic pressure (9.2 ± 1.3 vs. 12.0 ± 0.9 mmHg, p < 0.05) and dP/dt min (−14,289 ± 1395 vs. -9947 ± 525 mmHg/s; p < 0.05) than the HFpEF group.
Concerning ECG recording during the hemodynamics (Fig. 2), a higher rate of PVCs per minute was found in the HFpEF-T3high group in comparison with the Lean-Ctrl and HFpEF groups.
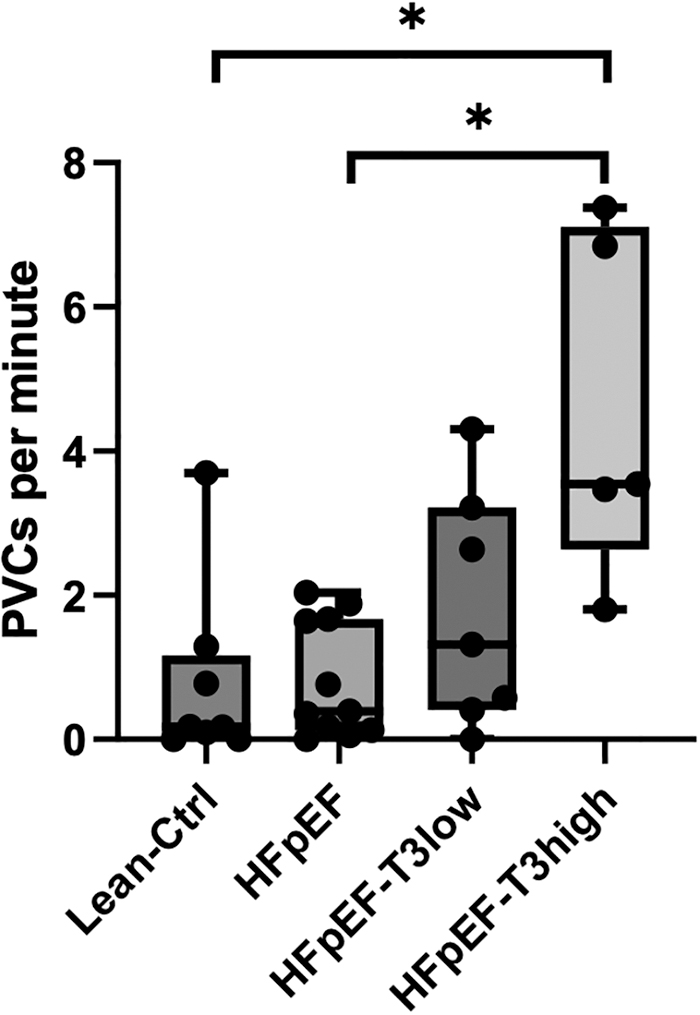
Rate of PVCs during electrocardiographic monitoring performed in hemodynamic evaluation for the different experimental groups: Lean-Ctrl (ZSF1 Lean, n = 8), HFpEF (placebo-treated ZSF1 Obese, n = 11), HFpEF-T3low (ZSF1 Obese+low T3, n = 7), and HFpEF-T3high (ZSF1 Obese+replacement T3 dose, n = 5). Extreme outliers were removed (n = 2 for HFpEF; n = 1 for HFpEF-T3low). Error bars express the maximum and minimum value. The box plot bold lines represent the median and the first and third quartiles. Statistical analysis was performed using Kruskall–Wallis with post hoc comparisons by Dunn's multiple comparisons test. *p < 0.05. PVCs, premature ventricular contractions.
Single cardiomyocyte sarcomere shortening and cytosolic Ca2+ transients
Comparing with Lean-Ctrl, Ca2+ transients were delayed in HFpEF group both in contraction, as assessed by time to peak Ca2+, and in relaxation, as measured in half-time of Ca2+ decay (Fig. 3A–C). HFpEF also had a shorter sarcomere length at baseline, a longer time to full contraction, and time to half-relaxation (Fig. 3E–G). Treatment with T3 improved Ca2+ transients and sarcomere shortening and relaxation. Both the treated groups had improved half-time of peak Ca2+ decay compared wiht HFpEF (Fig. 3C), but only HFpEF-T3high had improved time to peak Ca2+ (Fig. 3B). Both HFpEF-T3high and HFpEF-T3low had improved sarcomere length, time to full contraction, and time to half-relaxation compared with HFpEF (Fig. 3D–G).

Single cardiomyocite evaluation. (
LV fibrosis
Fibrosis was increased in HFpEF in comparison with Lean-Ctrl. Compared with HFpEF, both low and replacement dose of T3 decreased myocardial fibrosis (Fig. 4). HFpEF-T3low group showed less fibrosis than HFpEF-T3high group (p < 0.01).
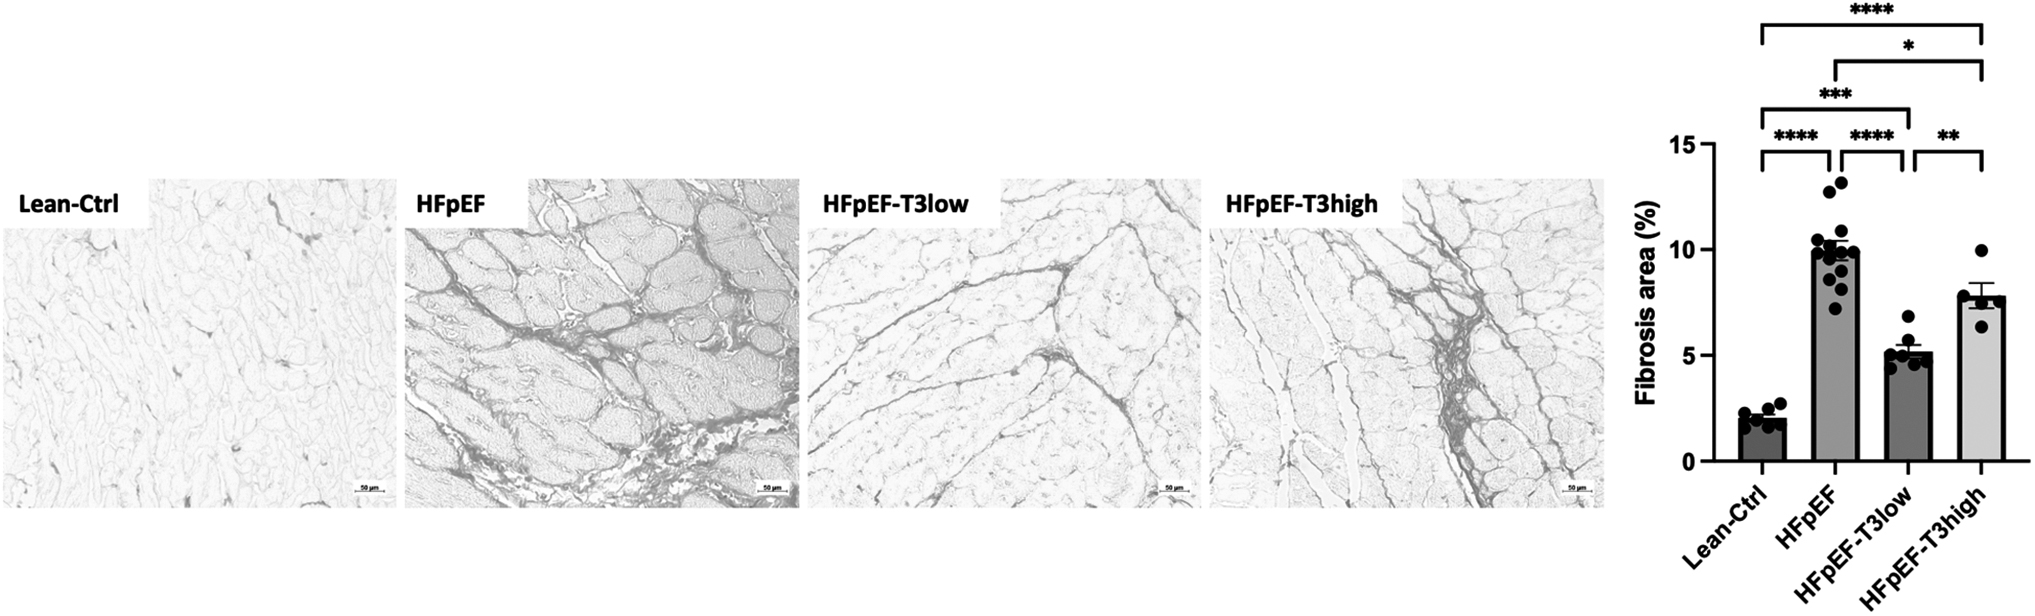
Sirius red-stained histological sections ( × 100 magnification) of myocardium from Lean-Ctrl (ZSF1 Lean, n = 6), HFpEF (placebo-treated ZSF1 Obese, n = 13), HFpEF-T3low (ZSF1 Obese+low T3 dose, n = 8), and HFpEF-T3high (ZSF1 Obese+replacement T3 dose, n = 5), and the corresponding statistical analysis. Fibrosis was increased in HFpEF in comparison with Lean-Ctrl and the treatment of ZSF1 Obese with T3 (low and replacement doses) attenuated fibrosis. Data are represented by mean ± SEM. *p < 0.05, **p < 0.01, ***p < 0.001, ****p < 0.0001. Statistical analysis was performed using one-way ANOVA with post hoc comparisons by Tukey's multiple comparisons test. ANOVA, analysis of variance.
Gene expression and immunoblotting
Treatment with replacement dose of T3 decreased the expression of β-myosin heavy chain (β-MHC) and increased the expression of α-MHC (Fig. 5B); increased the expression of the calcium handling proteins (Fig. 5C); of several antioxidant proteins (Fig. 5D); and of proinflammatory genes interleukin (IL)-1α, IL-6 (p = 0.053), and tumor necrosis factor (TNF)-α (p = 0.061) (Fig. 5F). Treatment with low-dose T3 also decreased the expression of β-MHC (p = 0.094), and increased the expression of ryanodine receptor 2; of antioxidant proteins methylmalonate semialdehyde dehydrogenase (ALDH6A1; p = 0.082) and aldehyde dehydrogenase 2 (ALDH2; p = 0.084); and of the extracellular matrix regulators matrix metalloproteinase (MMP) 2 and tissue inhibitor of metalloproteinases 2 (TIMP2) (Fig. 5E). No significant changes were found on the LV expression of brain natriuretic peptide (BNP) with T3 supplementation (Fig. 5A).
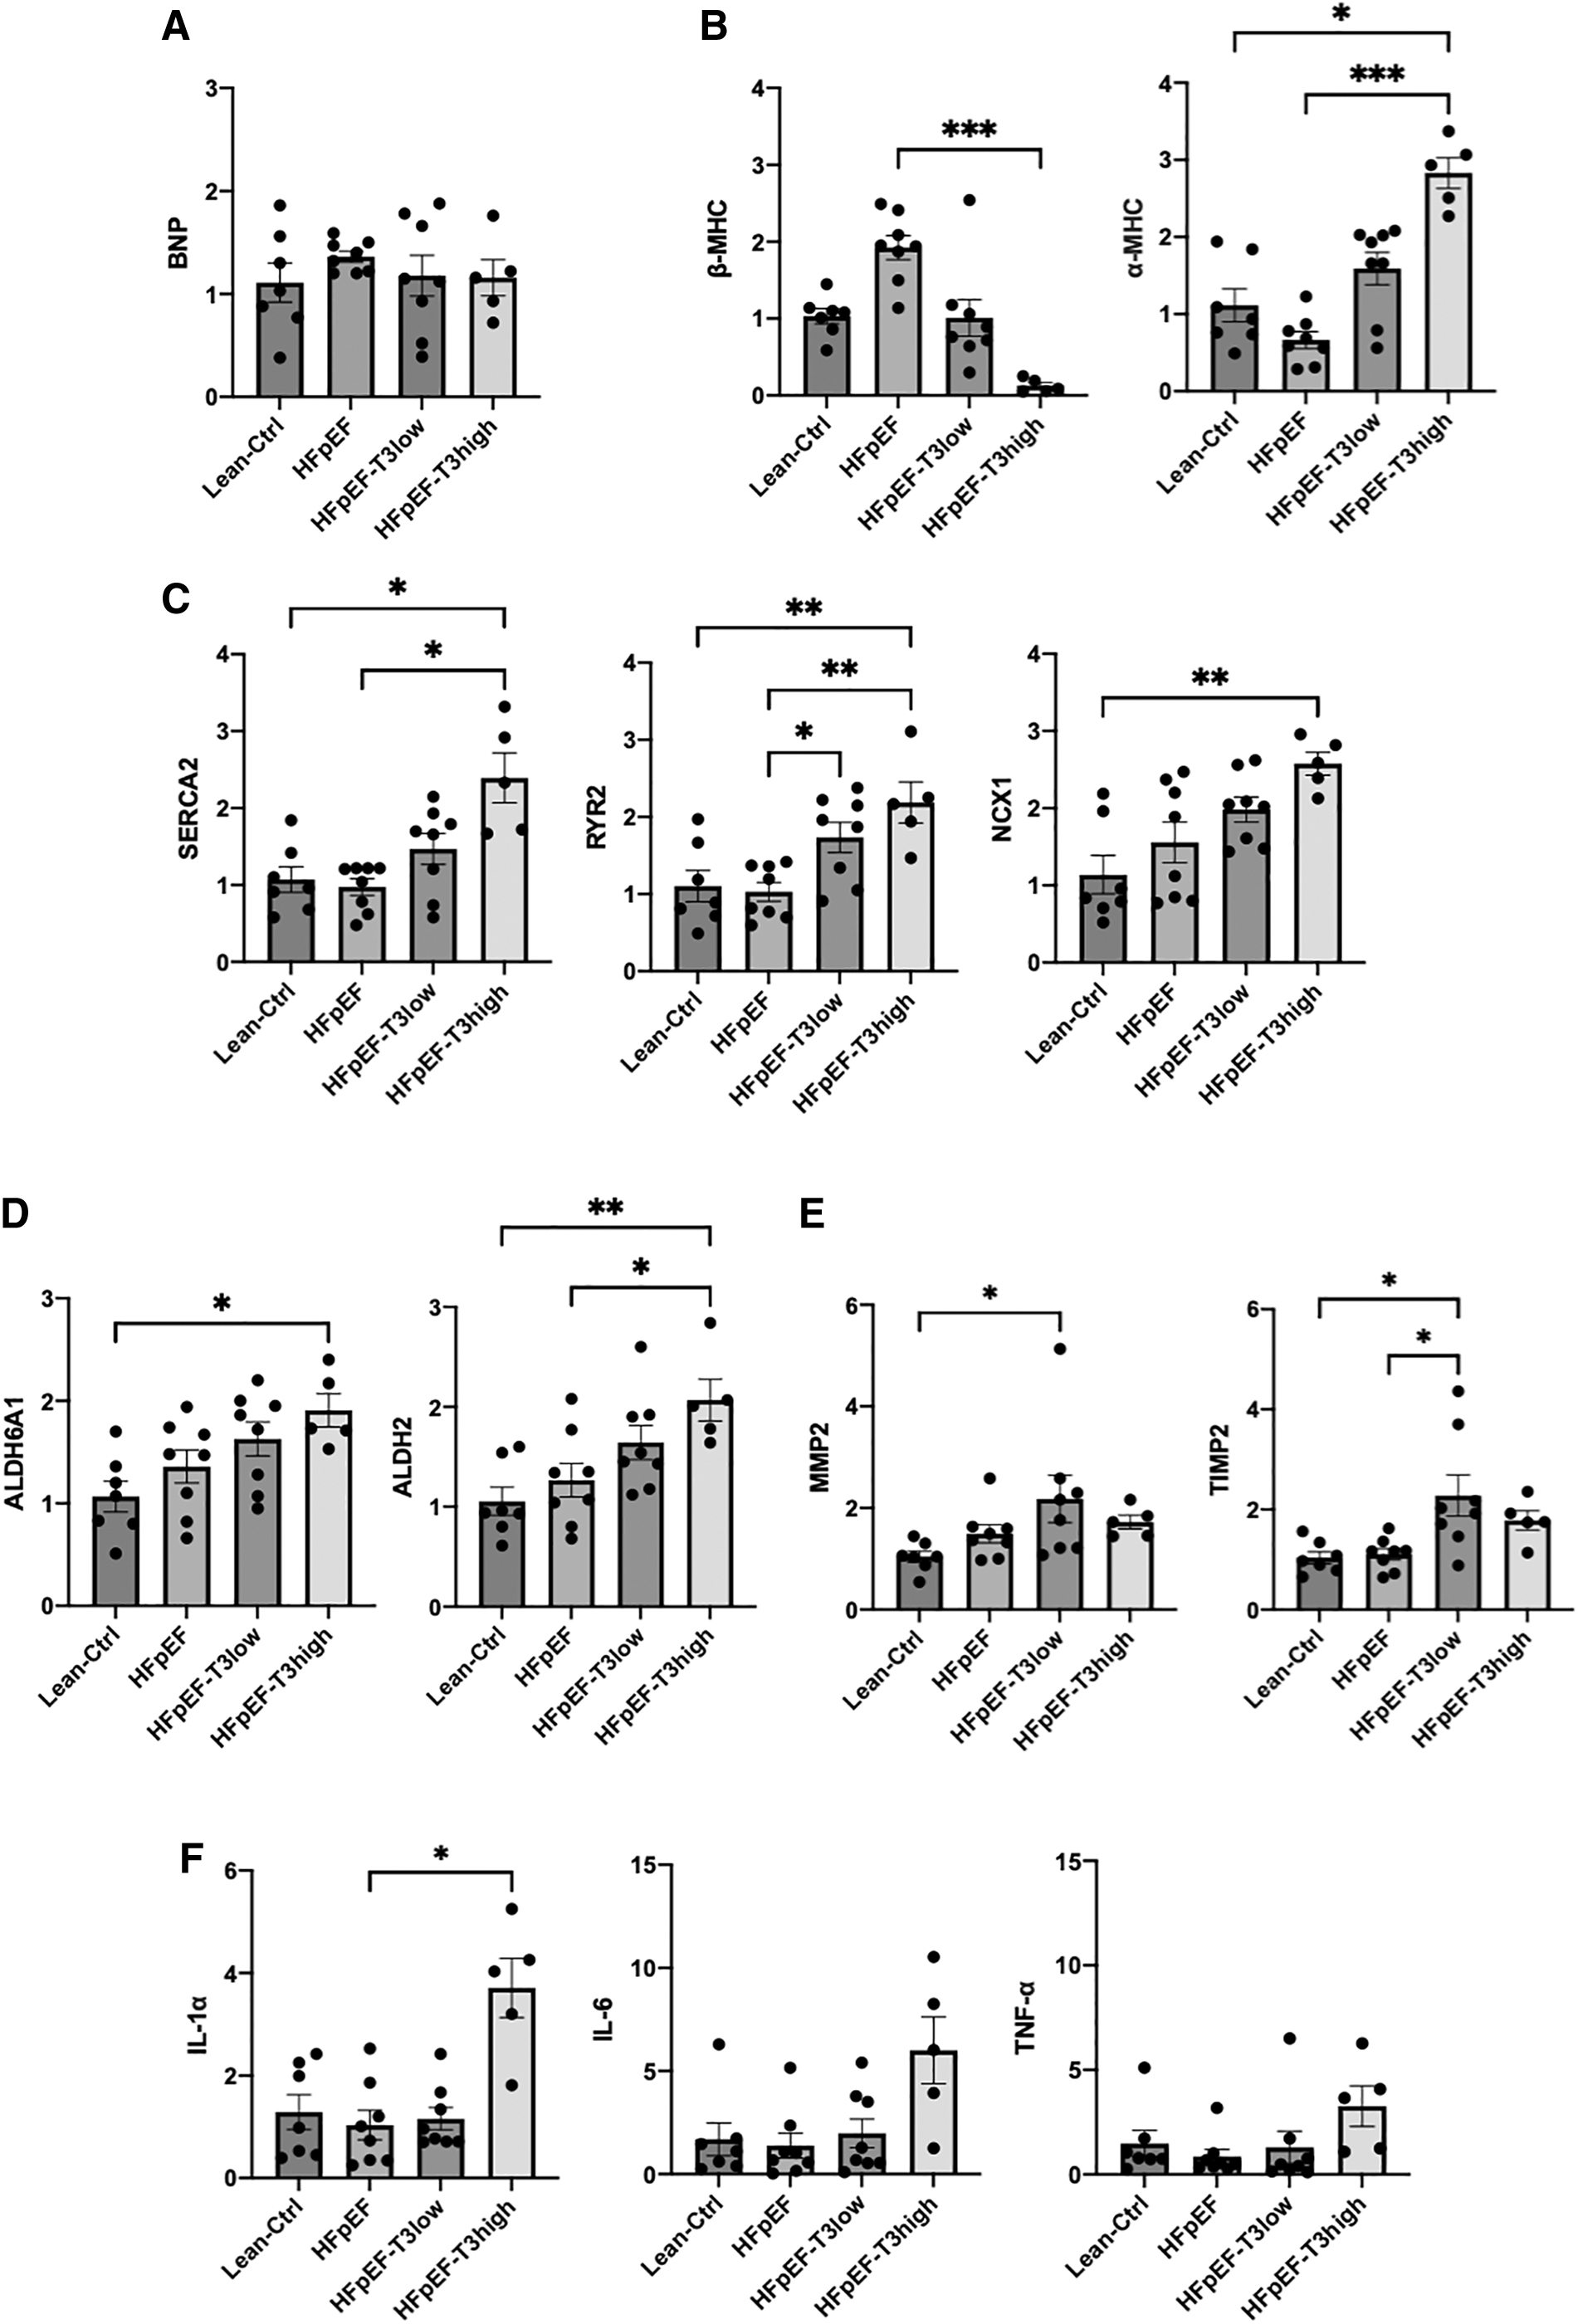
LV myocardial mRNA expression from Lean-Ctrl (ZSF1 Lean, n = 7), HFpEF (placebo-treated ZSF1 Obese, n = 8), HFpEF-T3low (ZSF1 Obese+low T3 dose, n = 8), and HFpEF-T3high (ZSF1 Obese+replacement T3 dose, n = 5). (
Western immunoblotting showed that SERCA2a protein content was similar between groups (Fig. 6B), but an increase in the phosphorylation of phospholamban in HFpEF-T3high group compared with HFpEF (Fig. 6A), and a decrease in the levels of thyroid hormone receptor β in both the treated groups (Fig. 6C).
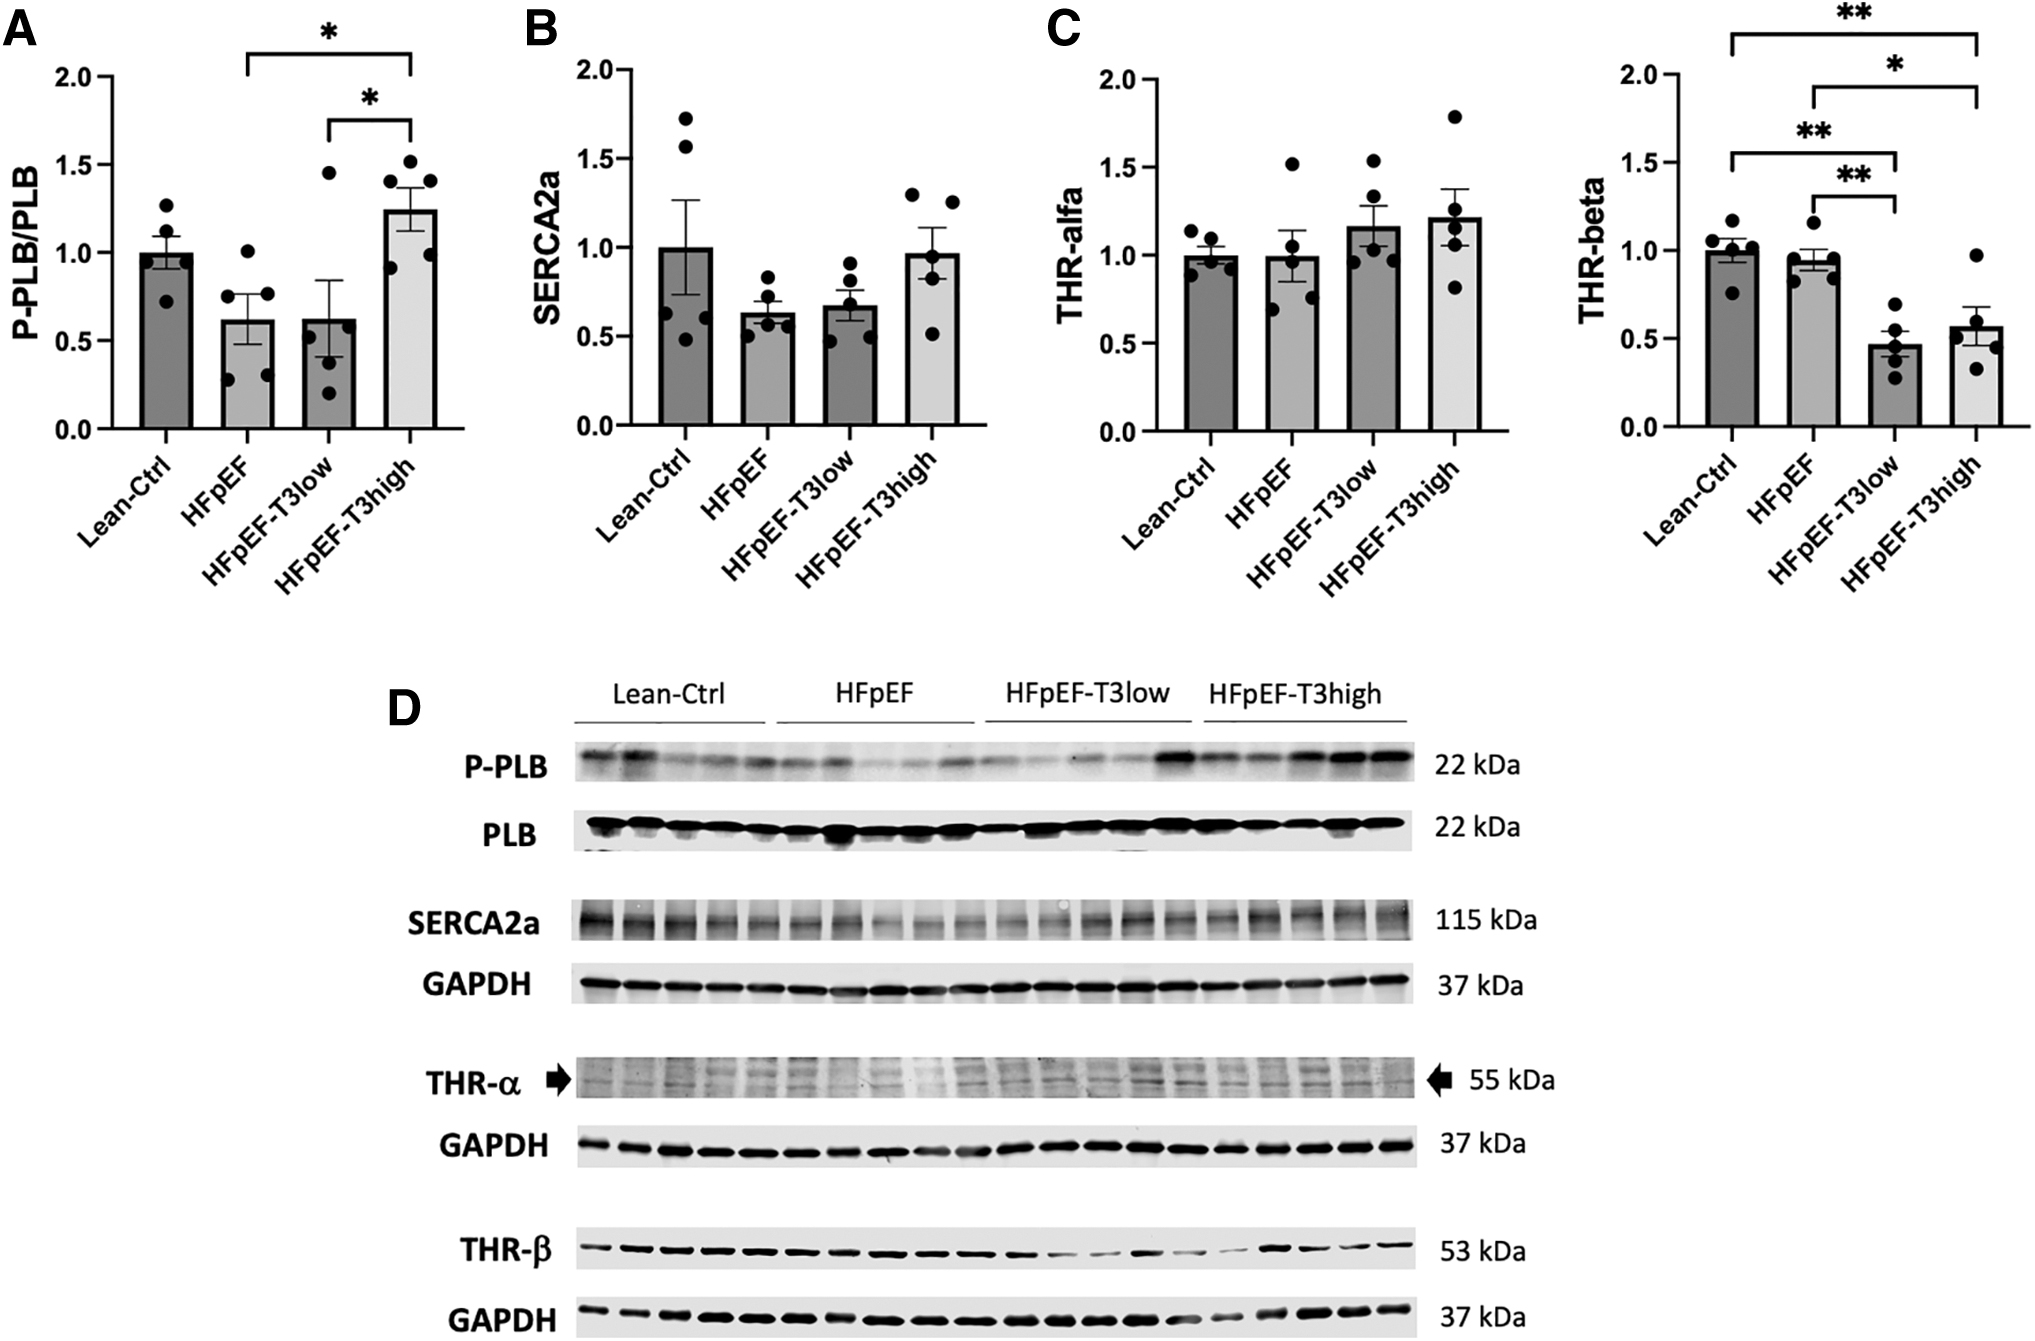
Protein expressions by immunoblotting of LV samples from Lean-Ctrl (ZSF1 Lean, n = 5), HFpEF (placebo-treated ZSF1 Obese, n = 5), HFpEF-T3low (ZSF1 Obese+low T3 dose, n = 5), and HFpEF-T3high (ZSF1 Obese+replacement T3 dose, n = 5). (
Mortality
Mortality was increased in the HFpEF-T3high. No animals died in the Lean-Ctrl, HFpEF, and HFpEF-T3low groups. In the HFpEF-T3high group, three animals had sudden death at week 18 (one animal) and week 21 (two animals). Autopsy of the three animals with sudden death did not reveal myocardial infarction or other evident cause for death; an arrhythmic event was assumed as the probable cause of death.
Discussion
In an animal model of HFpEF with metabolic syndrome, treatment with T3 improved metabolic and cardiac functions. While low-dose treatment was well tolerated, treatment with replacement dose was associated with increased risk of sudden cardiac death.
Previous studies had already showed that HF is associated with relevant changes in thyroid hormone level. 1,7 –10,39 Myocardial hypertrophy and HF have been shown to reduce myocardial T3 levels. 40,41 Furthermore, lower levels of serum T3 are associated with worse prognosis both in patients with HFrEF and HFpEF. 8 –10,42,43 Our study is unique in that an animal model of HFpEF with metabolic syndrome was used. In accordance with the previous studies, 15,17 HFpEF group also showed decreased serum and myocardial T3 levels, in comparison with the control group.
In our study, treatment with T3 was able to reduce body weight and improve insulin sensitivity, as well as the response to oral glucose test. At the myocardium level, the significant increase in the expression of calcium handling proteins and of MHC-β translated into improved calcium handling and improved sarcomere contraction and relaxation. While the replacement dose was able to improve the contraction and relaxation of the sarcomere to a greater extent than the low T3 dose, the lower dose reduced more the cardiomyocyte hypertrophy and the myocardial fibrosis. This suggests that, while some benefits of thyroid hormones at cardiac level are more pronounced with increasing doses, other effects may attenuate with higher doses. This is in line with the known risk of adverse cardiovascular effects of both low and high thyroid hormone levels. 1,2,4
The improvement of cardiac function with T3 supplementation is in accordance with most previous studies performed in different animal models of cardiovascular disease. In an animal model of myocardial-infarction-induced HFrEF, treatment with T3 improved systolic and diastolic function. 13 In animal models of hypertensive heart disease, treatment with T3 improved diastolic function, attenuated cardiac dysfunction, and reduced adverse ventricular remodeling. 16,17 There is also limited evidence of potential benefits of treatment with T3 in humans. In a randomized double-blind study of 50 patients with HFrEF and low T3 syndrome, supplementation with low-dose T3 for 6 weeks increased the LV ejection fraction and improved the 6-minute walk distance. 20
One of the main findings of our study was the increased risk of sudden death with replacement doses of T3. HF is a condition with high risk of sudden death, mostly due to arrhythmic events. 44,45 Thyroid hormones increase the sensitivity to catecholamines and modulate the activity of multiple cardiac ion transporters, thus increasing the heart rate and the risk of both atrial and ventricle arrhythmic events. 46,47 While correction of hypothyroidism is not associated with an increased risk of arrhythmic events, 48 in a susceptible heart, normalization of T3 levels may increase the susceptibility to arrhythmic events. Although we cannot definitely ascertain that the cause of death in the group treated with replacement dose of T3 was arrhythmic, this is plausible from a pathophysiological perspective and supported by our results. 49
In fact, we show that the high-dose treated group had an increased heart rate during in vivo echocardiographic evaluation and a higher rate of PVCs during hemodynamics. Also, the increased phosphorylation of phospholambam in this group enhances beta-adrenergic response. 50 The increased risk of arrhythmic events is well established for overt and subclinical hyperthyroidism. 51 Even within the euthyroid range, higher levels of T4 have also been associated with an increased risk of arrhythmia and sudden cardiac death. 52 –54 In an RCT of patients with acute myocardial infarction, treatment with intravenous T3 reduced infarct size at 6 months, but was associated with a tendency for increased risk of atrial fibrillation (19% vs. 5%). 21
In our study, the low dose was not associated with increased heart rate or sudden death. Low dose of T3 promoted greater decreases in myocardial fibrosis and was not associated with increased expression of proinflammatory interleukins. In agreement with our results for the low-dose treatment, in an animal model of myocardial infarction, treatment with physiological doses of T3 enhanced LV contractility, reduced fibrosis, and reduced the incidence of atrial tachyarrhythmias. 14
From a clinical perspective, our results do not support the use of T3 in replacement doses for HFpEF, given the potential risk of sudden cardiac death. On the contrary, supplementation with low doses of T3 may be a potential therapeutic approach in HFpEF. Future RCTs with thyroid hormones in cardiovascular disease should include a detailed assessment of arrhythmic events.
This study has limitations that we must acknowledge. Despite the well-established role of the ZSF1 Obese Rat as an animal model of HFpEF, this model may not fully replicate the pathophysiology of human HFpEF. Moreover, the complexity and multiple phenotypes of HFpEF in humans may further limit the translatability of our results to the entire spectrum of HFpEF presentations in humans. We have only used male ZSF1 rats, even though HFpEF is more prevalent in women. Nevertheless this HFpEF animal model was developed in males and studies showed similar functional cardiac outcomes in both sexes. 55 –57 T3 was administered in drinking water, which may contribute to variations of exposure to T3. While subcutaneous pellets for continuous release of T3 could have increased the stability of exposure to T3, the oral administration of T3 is more translatable to the expected effects of treatment with oral T3 in humans. 58
We did not monitor arrhythmic events during the study protocol, which precludes us from definitely stating the exact cause of the cases of sudden death. We only tested the effects of T3 supplementation; we cannot exclude that treatment with T4 could have been associated with greater benefits and/or lower risks.
Conclusions
In conclusion, treatment with T3 was shown to improve metabolic profile, myocardial calcium handling, as well as cardiac function in an animal model of HFpEF. While the low dose was well-tolerated and safe, the replacement dose was associated with increased heart rate and a higher risk of arrhythmias and sudden death. While modulation of thyroid hormones may be a potential therapeutic target in HFpEF, it is important to take into consideration the small therapeutic window of T3 in these patients.
Footnotes
Data Availability Statement
The data sets used during the current study are available from the corresponding author on reasonable request.
Acknowledgments
We acknowledge Dr. Ana Guadaño-Ferraz for financial support from the Spanish Ministry of Science and Innovation (MCIN).
Authors' Contributions
J.S.N.: conceptualization (lead), investigation (equal), formal analysis (equal), visualization (supporting), and writing—original article (lead); A.R.L.: investigation (equal), formal analysis (equal), visualization (lead), and writing—original article (supporting); G.C.: investigation (equal), formal analysis (equal), and writing—review and editing (equal); A.G.: investigation (equal), formal analysis (equal), and writing—review and editing (equal); M.B.-C.: investigation (equal), formal analysis (supporting), and writing—review and editing (equal); C.V.: investigation (equal), formal analysis (supporting), and writing—review and editing (equal); M.V.-H.: investigation (equal), formal analysis (supporting), and writing—review and editing (equal); D.M.: investigation (supporting), formal analysis (supporting), and writing—review and editing (equal).
D.M.-S.: investigation (supporting), formal analysis (supporting), and writing—review and editing (equal); S.L.: investigation (supporting), formal analysis (supporting), and writing—review and editing (equal); E.R.-O.: investigation (supporting), formal analysis (supporting), writing—review and editing (equal), and visualization (supporting); C.S.-M.: investigation (supporting) and writing—review and editing (equal).
J.C.: investigation (supporting) and writing—review and editing (equal); I.M.L.: investigation (supporting) and writing—review and editing (equal); C.G.-M.: investigation (supporting), formal analysis (supporting), and writing—review and editing (equal); S.B.-L.: investigation (supporting), formal analysis (supporting), and writing—review and editing (equal); I.M.M.: investigation (supporting) and writing—review and editing (equal); J.A.-C.: investigation (supporting) and writing—review and editing (equal); F.V.-N.: investigation (supporting), formal analysis (supporting), writing—review and editing (equal), and visualization (supporting); D.C.: supervision (supporting) and writing—review and editing (equal); A.L.: conceptualization (supporting), investigation (equal), formal analysis (equal), supervision (supporting), and writing—review and editing (equal); I.F.-P.: conceptualization (supporting), investigation (equal), formal analysis (equal), supervision (supporting), and writing—review and editing (equal); A.L.-M.: conceptualization (supporting), supervision (lead), and writing—review and editing (equal).
Author Disclosure Statement
No conflicts of interest are declared by the authors.
Funding Information
This study was supported by grants from the European Union (FP7-HEALTH-2010-MEDIA), and national funds through FCT—Portuguese Foundation for Science and Technology (UIDB/00051/2020, UIDP/00051/2020,
Supplementary Material
Supplementary Data