
Abstract
Background:
Thyroid hormone replacement with levothyroxine (LT4) is a recommended treatment for patients undergoing thyroidectomy. The starting LT4 dose is frequently calculated based on the patient's weight. However, the weight-based LT4 dosing performs poorly in clinical practice, with only ∼30% of patients achieving target thyrotropin (TSH) levels at the first thyroid function testing after treatment initiation. A better way to calculate the LT4 dose for patients with postoperative hypothyroidism is needed.
Methods:
In this retrospective cohort study we used demographic, clinical, and laboratory data for 951 patients after thyroidectomy and several regression and classification machine learning methods to develop an LT4 dose calculator for treating postoperative hypothyroidism targeting the desired TSH level. We compared the accuracy with the current standard-of-care practice and other published algorithms and evaluated generalizability with fivefold cross-validation and out-of-sample testing.
Results:
The retrospective clinical chart review showed that only 285/951 (30%) patients met their postoperative TSH goal. Obese patients were overtreated with LT4. An ordinary least squares regression based on weight, height, age, sex, calcium supplementation, and height:sex interaction predicted prescribed LT4 dose in 43.5% of all patients and 45.3% of patients with normal postoperative TSH (0.45–4.5 mIU/L). The ordinal logistic regression, artificial neural networks regression/classification, and random forest methods achieved comparable performance. LT4 calculator recommended lower LT4 doses to obese patients.
Conclusions:
The standard-of-care LT4 dosing does not achieve the target TSH in most thyroidectomy patients. Computer-assisted LT4 dose calculation performs better by considering multiple relevant patient characteristics and providing personalized and equitable care to patients with postoperative hypothyroidism. Prospective validation of LT4 calculator performance in patients with various TSH goals is needed.
Introduction
Thyroidectomy is a common procedure for treating thyroid cancer, hyperthyroidism, and large goiters with compressive symptoms. Approximately 130,000 thyroid operations are performed yearly in the United States, 1 60,000 in Germany, and 45,000 in France. 2 After total or completion thyroidectomy, patients are prescribed thyroid hormone replacement with the intent to either restore normal thyroid hormone function for benign or low-risk thyroid cancer or suppress thyrotropin (TSH) for intermediate and high-risk thyroid cancers. 3
Levothyroxine (LT4) is a recommended first-line thyroid hormone replacement therapy. 3,4 It is one of the most commonly prescribed medications. 5 The LT4 dose for patients undergoing thyroidectomy is frequently calculated based on the patient's weight. 3,4 The initial LT4 dose is estimated as ∼1.6 μg/kg/day to achieve euthyroidism or ∼1.8–2.2 μg/kg/day when TSH suppression is indicated in patients with thyroid cancer. 3,6 –8 The LT4 dose calculated based on weight is frequently inaccurate, and 60–70% of patients require dosing changes after their first postoperative visit. 9,10 It often takes more than a year to find the optimal LT4 dose 9 causing side effects from hypo- or hyperthyroidism, worse quality of life, 11 unnecessary clinic visits and laboratory tests, lost productivity, and up to a 2.5-fold increase in the total cost of care compared with patients requiring no dose adjustments. 12 The weight-based LT4 dose calculation leads to a systematic overdose in overweight and obese patients, 13 –15 causing hyperthyroid side effects such as the increased risk of accelerated bone loss and fractures, 16 heat intolerance, diarrhea, and cardiac dysrhythmias. 17
Many LT4 dosing schemas were proposed 9,10,18 –23 that utilize a combination of variables such as weight, calculated lean body mass (LBM), body mass index (BMI), age, sex, preoperative TSH, iron, or multivitamin supplementation. All published calculators aim to achieve normal postoperative TSH and, therefore, cannot be used for patients with thyroid cancer requiring TSH suppressive therapy per the American Thyroid Association (ATA) guidelines. 3
In this study, we: (1) evaluated the performance of the current practice and published dosing algorithms on a large cohort of patients treated with a thyroidectomy; (2) developed and retrospectively validated an LT4 dose calculator targeting a clinically indicated TSH level for patients undergoing thyroidectomy; and (3) published a database and software to enable the scientific community to improve LT4 dosing predictions and independently test algorithm performance. Our findings establish the superiority of the machine learning–based LT4 prescription over the weight-based dosing and pave the way for the prospective testing of computer-assisted management of postoperative hypothyroidism.
Materials and Methods
Data collection
This is a retrospective cohort study of machine learning for calculating LT4 dose in patients with postoperative hypothyroidism. The Colorado Multiple Institutional Review Board approved clinical chart reviews and data collection (protocol 20-1373, the waiver of informed consent was granted). We identified adult (≥18 years of age) patients treated with thyroidectomy or completion thyroidectomy at the UCHealth system (CO) in 2006–2022. The data on the type of thyroid surgery, histopathology reports, age at the time of surgery, sex, race, weight, height, BMI, history of Graves' disease, pregnancy status, reported nonadherence with LT4 prescription, preoperative and postoperative TSH, relevant medications such as estrogen-containing oral contraceptives, lithium, calcium, iron, and multivitamin supplements were collected using database queries and by clinical chart review. Biological sex was inferred from the gender reported in the electronic health records and confirmed by the chart review. These features were selected based on the known effects on thyroid hormone requirements. 24 –29
We stratified patients into underweight (<18.5 kg/m2), normal BMI (18.5–25 kg/m2), overweight (25–30 kg/m2), and obese (>30 kg/m2) categories. We reviewed histopathology reports for patients with thyroid cancer and estimated the ATA risk of structural disease recurrence and the TSH target range as described in the guidelines. 3 TSH goals were defined as 0.45–4.5, 0.5–2.0, 0.1–0.5, and ≤0.1 mIU/L for patients with benign disease, low-risk, intermediate-risk, or high-risk thyroid cancer, respectively.
We excluded pregnant women, nonadherent patients, individuals discharged on thyroid hormones other than LT4 or with inconsistent LT4 dosing, and those that did not have TSH measured between weeks 4 and 15 after the surgery. In addition, we excluded patients with hyperthyroidism and fully suppressed preoperative TSH (<0.05 mIU/L) because TSH may remain suppressed for a prolonged period after thyroidectomy and is not a reliable measure of thyroid function in this setting. 30 Finally, we removed patients with a high postoperative TSH value of >10.1 (more likely to be nonadherent), discharged on LT4 doses outside accepted weight-based ranges (>2.8 and <1.0 μg/kg), and patients on thyroid hormone replacement before the surgery (because historical data informs thyroid hormone replacement dose better than model-based calculation). Figure 1 illustrates our patient selection algorithm.
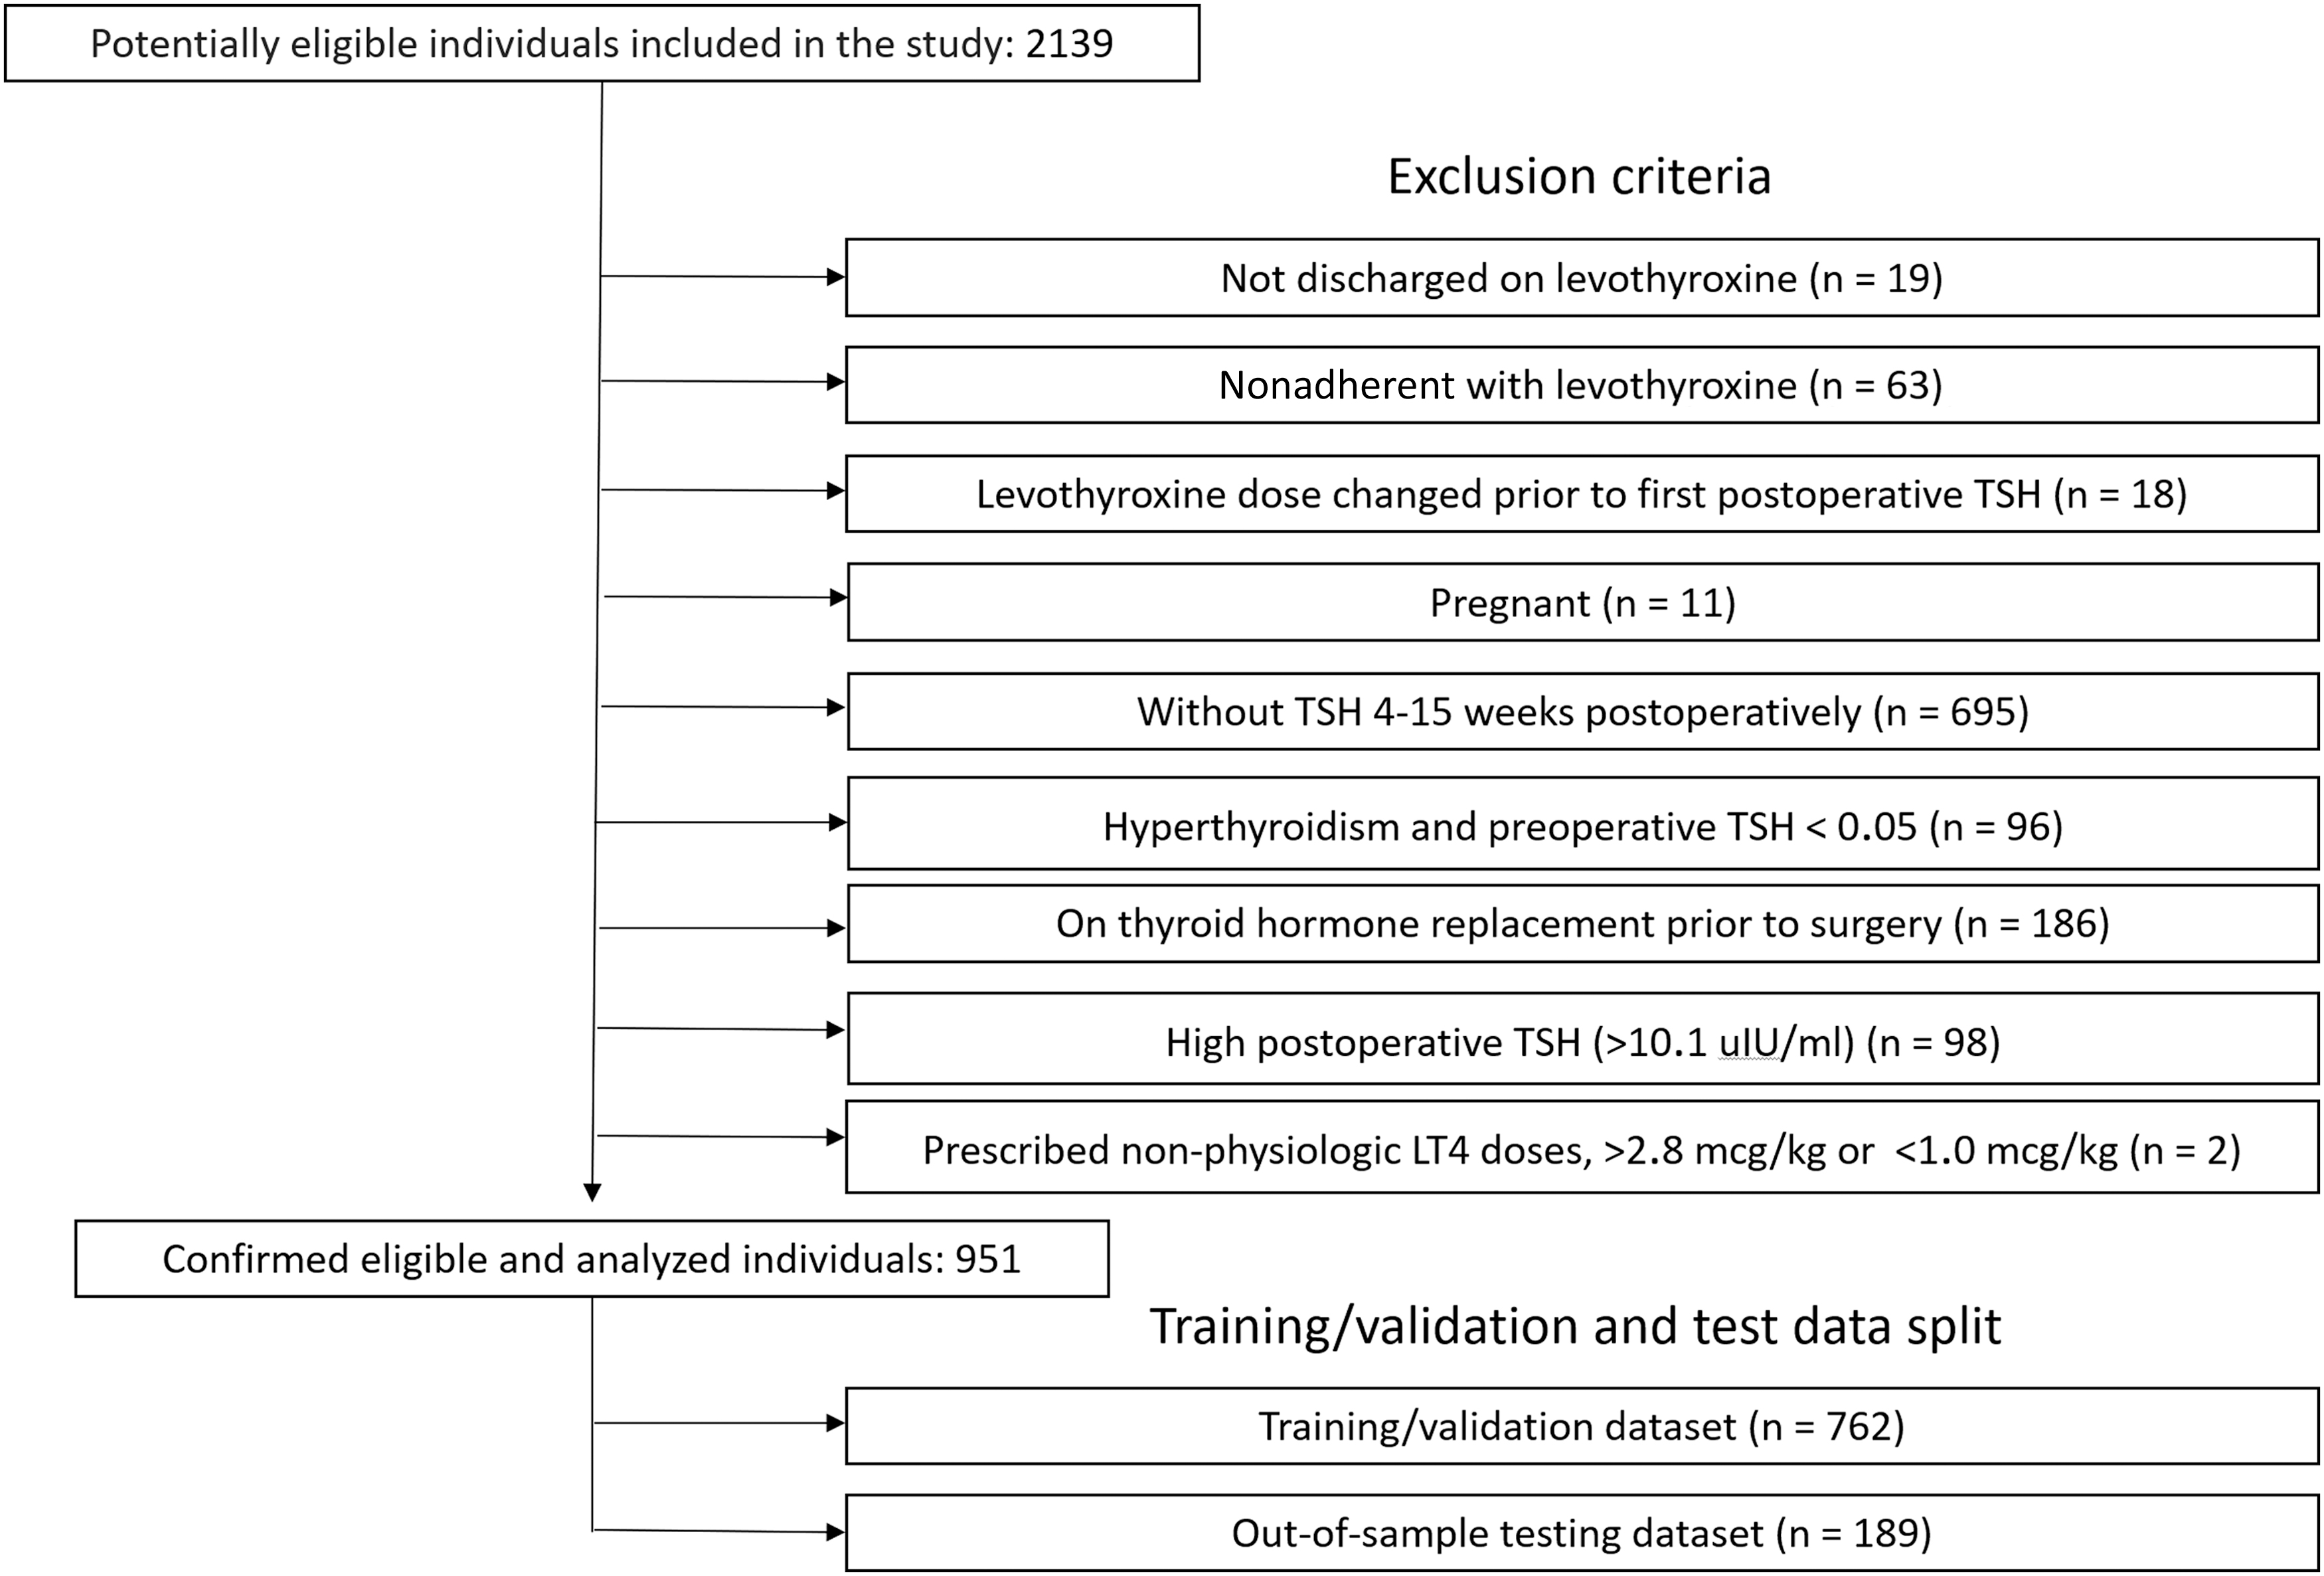
Patient selection algorithm.
Feature selection and machine learning
In pursuit of our goal to calculate LT4 dose to target a desired postoperative TSH level, we applied several machine learning techniques to model the following relationship:

We used standard machine learning techniques listed in Table 2. We followed best practices as described in the textbook by Witten et al. 31 Details of the training machine learning models are described in the Supplementary Methods.
We used ordinal logistic regression (OLR) and ordinary least-squares (OLS) linear regression to select clinical features significantly associated with the LT4 dose. Interactions of weight, height, age, and sex were tested, implying a biological relevance of contributing to LBM. An interaction term between sex and height was significantly associated with LT4 dose (data not shown) and was included in the linear regression models. In addition, the height variable was centered owing to the high variance inflation factor for height and the interaction of sex and height. Bisquare weighting was used for the robust linear regression. Potential nonlinear relationships between LT4 dose and predictors were studied using random forest, artificial neural network (ANN) classifier, and ANN regression methods. Fully connected ANN classifier and regression models were built in python 3.8 using Keras API with Tensorflow backend. ANN contained three hidden layers activated using relu function followed by dropout layers. Adam optimizer was used for training. The number of neurons in hidden layers, batch size, learning rate, and dropout rates were optimized with the help of the grid search using hyperas package (
LT4 dose prediction accuracy
In line with the expected clinical use of the LT4 dose calculator, we rounded the predicted dose to the nearest manufactured and prescribable dose (50, 75, 88, 100, 112, 125, 137, 150, 175, 200, 224, 250, and 300 μg). We considered prediction accurate when the rounded calculated dose matched the actually prescribed dose. In addition, we calculated the percentage of predictions within 12.5 μg of the actual prescribed dose. Although less clinically relevant, this accuracy measure was used by the previous studies 10,23 and allowed a fair comparison. We split the data into the training/validation (80%) and out-of-sample test (20%) data sets (Fig. 1). Test data were not used during model training or for hyperparameter optimization. The generalizability of predictions was evaluated using fivefold cross-validation in a training/validation split and on a test data split.
Results
Patient selection
Patient cohort demographics are given in Table 1. A total of 2139 patients underwent total or completion thyroidectomy at UCHealth from 2006 to 2022. A total of 951 patients remained after applying the exclusion criteria (Fig. 1 and Table 1). Six hundred eighty-seven (72.2%) and 264 (27.7%) patients were women and men, respectively. The average age was 49 years (range: 18–88 years), and the average BMI was 29.0 kg/m2 (range: 16.5–65 kg/m2). There were 11 (1.1%), 277 (29.1%), 333 (35.0%), and 330 (34.7%) patients who were underweight, with normal BMI, overweight, and obese, respectively. There were 414 (43.5%), 113 (11.8%), and 135 (14.2%) patients with low-risk, intermediate-risk, and high-risk thyroid cancer, respectively. The remaining 289 (30.4%) patients had thyroid surgery for benign disease.
Patient Characteristics and Outcomes of the Current Practice of Managing Hypothyroidism
TSH 4–15 weeks after initiation of LT4.
Chi-squared test except for age (analysis of variance).
BMI, body mass index; LT4, levothyroxine; TSH, thyrotropin.
Performance of the current standard of practice weight-based LT4 prescription
LT4 dose for patients undergoing thyroidectomy is frequently calculated based on the patient's weight (1.6–2.2 μg/kg depending on the presence of malignancy and the cancer recurrence risk). Sex, age, medications, or other clinical features are not routinely considered when deciding on the LT4 dose. We analyzed patients who achieved postoperative TSH target, were prescribed too little LT4 (TSH above target), or were overdosed (TSH below target) in the entire cohort and stratified by sex, race, BMI, ATA risk of structural disease recurrence, or taking relevant medications. This analysis is summarized in Table 1. Only 30% of patients (285/951) achieved their postoperative TSH goal.
Men were more likely to be above their target TSH (101/264, 38.3%) and less likely to be below their target TSH (78/264, 29.6%) than women, indicating that men require a higher LT4 dose adjusted for weight. As reported previously, 13 weight-based LT4 dose calculations performed poorly in obese patients leading to frequent overdoses. Obese patients were more likely to be below their target TSH range (172/330, 52.1%). Patients discharged on calcitriol were less likely to meet their target TSH (25.7%) and were more likely to be above their target TSH range (111/319, 34.8%). More than half of patients with benign disease or low-risk thyroid cancer were prescribed too much LT4 (TSH below target, 150/289, 51.9%). As expected, patients on estrogen medications required higher doses of LT4, which was reflected by a higher fraction of patients with TSH above the target. Differences by race, prescription of calcium on discharge, or taking iron or multivitamin supplements were not significant.
Machine learning-based LT4 dose calculator
We applied machine learning to develop a better method for LT4 dose calculation. The OLS regression achieved an accuracy of 43.2% and 41.8% on cross-validation within the training/validation split and out-of-sample testing, respectively (Table 2). Compared with our institution's current practice of prescribing LT4 based on weight (achieved target TSH on postoperative testing in 30% of patients), this result demonstrates the benefit of using machine learning for treating postoperative hypothyroidism. The OLS model used postoperative TSH, weight, height, sex, age, calcium supplementation status, and interaction between height and sex as covariates. These covariates were shown to be significantly associated with LT4 dose and positively affected cross-validated model accuracy in the preliminary studies (data not shown).
Accuracy of Levothyroxine Dose Predictions
95% confidence interval is shown in the square brackets for the OLS model.
Accuracy was calculated as % rounded predicted dose matching actually prescribed dose.
Out-of-bag accuracy is shown.
OLS, ordinary least squares.
Linear regression assumptions were explored with the help of residual plots that demonstrated a linear relationship of the fitted values with residuals (Supplementary Fig. S1A) and approximately normal distribution of residuals (Supplementary Fig. S1B). The homoscedasticity assumption was not met with OLS regression (Breusch–Pagan test, p = 8.6e-09; Supplementary Fig. S1C), which improved when weighted linear regression was used (p = 0.98; Table 2 and Supplementary Fig. S1D) without significant impact on the model performance (Table 2).
OLR demonstrated performance comparable with that of OLS and achieved an accuracy of 46.9% and 40.2% on cross-validation within the training/validation split and out-of-sample testing. The modeling of LT4 dose as a categorical variable is appropriate given that LT4 is prescribed within scope of manufactured doses.
Robust linear regression with bisquare weighting did not improve model accuracy suggesting that outliers were unlikely to have a significant impact on regression modeling. Zaborek et al. recommended Poisson regression to study the relationship between LT4 dose clinical predictors. 23 In our dataset, the LT4 dose did not follow a Poisson distribution, and the accuracy of the Poisson regression model was lower when compared with other methods (Table 2). To explore potential nonlinear relationships between LT4 dose, TSH level, and selected clinical parameters, we used random forest and ANN regression and classification methods. These models performed comparably with the OLR and OLS regression (Table 2).
Final model selection and LT4 calculator web application
Several machine learning methods correctly predicted LT4 dose in 40–47% of patients on cross-validation and out-of-sample testing. We selected the OLS regression model for the LT4 calculator web application because of its high accuracy, superior interpretability, and ease of implementation. To simplify the use of the LT4 calculator for the research community, we built a web application (
LT4 calculator performance across BMI strata and risk groups
To understand the implications of using the LT4 calculator in patients with different BMI, we estimated weight-based and model-based LT4 doses for all patients. Weight in kilograms was multiplied by 1.6, 1.6, 1.8, and 2.0 for benign, low-risk, intermediate-risk, and high-risk patients, respectively. For the LT4 calculator, we used TSH targets of 2.475, 1.25, 0.3, and 0.1 mIU/L for benign, low-risk, intermediate-risk, and high-risk patients, respectively. Calculated doses were rounded to the nearest formulary LT4 strength mimicking the intended clinical use.
For patients with high thyroid hormone requirements, the LT4 calculator recommended a lower dose (Supplementary Fig. S2). For underweight, normal BMI, overweight, and obese patients, the LT4 calculator recommends on average +12.5 ± 11.2, +5.7 ± 9.8, +2.6 ± 12.3, and −6.2 ± 15.0 μg, respectively. This simulation demonstrates the utility of computer-assisted LT4 dosing to reduce BMI disparities in managing postoperative hypothyroidism. In addition, the LT4 calculator performed similarly in patients with different risk and TSH target ranges (chi-squared, p = 0.78 and 0.94 for training and testing data, respectively, Supplementary Table S1) and in female and male patients (Supplementary Table S2).
LT4 dose prediction by published dosing schemes
Except for weight-based LT4 dosing, all published schemas were designed to achieve TSH in the normal range. For a fair comparison, we evaluated our calculator and published LT4 dosing algorithms on patients with euthyroid postoperative TSH values (0.45–4.5 mIU/L). Similarly, the previously suggested accuracy criterion (LT4 dose within 12.5 μg of their prescribed LT4 dose) 23 was used along with our clinically relevant exact dose accuracy metric. On the subset of euthyroid patients (n = 349), our OLS regression model demonstrated an accuracy of 45.3%. The best-performing published schemas were BMI-based linear regression model by Ojomo et al. 10 (58.7% within ±12.5 μg and 37.5% exact predicted dose) and Poisson regression model by Zaborek et al. 23 (52.4% within ±12.5 μg and 33.2% exact predicted dose) (Table 3). We tested LT4 dose calculation based on LBM using formulas by Boer, 32 James, 33 and Hume. 34 Linear regression was used to find the optimal LBM multiplier. The best LT4 dose estimate was obtained using Hume's formula, 34 matching the accuracy of the Ojomo et al. 10 model (37.5%).
Performance of Levothyroxine Dosing Calculators
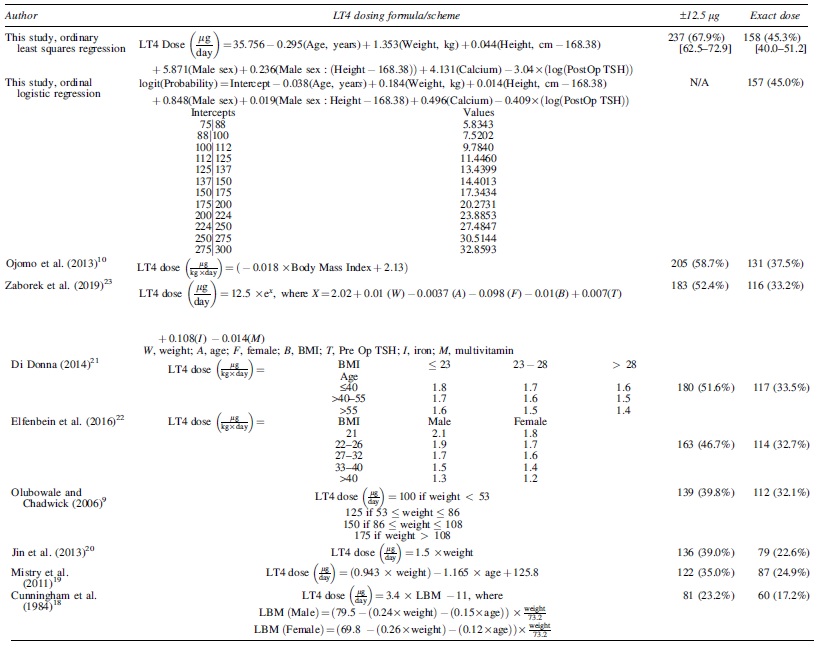
To allow fair comparison between models, only patients with euthyroid TSH were used (n = 349). 95% confidence interval is shown for the OLS model used for the LT4 calculator.
Discussion
We used a manually curated database of 951 patients after total or completion thyroidectomy to evaluate our institution's practice of prescribing LT4 for postoperative hypothyroidism based on body weight, to develop an LT4 dose calculator targeting specific TSH ranges, and to compare with published LT4 dosing schemas.
We found that only 30% of patients achieved postoperative TSH within the range appropriate for their disease risk, highlighting the need for a better method for prescribing LT4. The univariate analysis demonstrated that older and female patients with high BMI are more likely to be overtreated with LT4 (presented with below target postoperative TSH; Table 1). Prescription of calcitriol on discharge was also significantly associated with postoperative TSH. We hypothesize that calcitriol prescription is a surrogate measure of calcium supplementation dose. While calcium was not significantly associated with TSH being at target in univariate analysis of postoperative TSH (Table 1), it was an important feature in a machine learning model estimating LT4 dose (Table 3). Overtreatment of obese patients with weight-based LT4 dose resulting in hyperthyroidism has been reported previously. 10,22
LT4 requirement depends on many clinical and demographic factors such as sex, age, weight, height, BMI, estrogen therapy in pre- and postmenopausal women, pregnancy, calcium and iron supplementation, and gastric pH. 35 While many variables are easily measurable and readily available to the clinician, the multitude and complexity of interactions between these factors hamper clinical use. Therefore, machine learning training and computer-assisted LT4 dose calculations are necessary for better treatment of patients with postsurgical hypothyroidism.
Many dosing schemas were proposed, and their performance on euthyroid patients in our data is summarized in Table 3. The best published calculator by Ojomo et al. 10 is based on the BMI and achieved an accuracy of 37.5%. This is superior to the historical data, with 30% of patients achieving target TSH (chi-squared, p = 0.01), and demonstrates the utility of a data-driven approach to the treatment of postoperative hypothyroidism. Of interest, LBM-based calculation (Hume's formula 34 ) achieved accuracy similar to the Ojomo et al. model, 10 further emphasizing the importance of accounting for other clinical features besides weight.
Our OLS regression model was accurate in 45.3% patients and was significantly superior to the model by Ojomo et al. 10 (chi-squared, p = 0.026; Table 3). We acknowledge that this improvement may partly be explained by the differences in the data collection practices, exclusion criteria, and other unappreciated biases. Plausibly, the inclusion in the model of other clinical features, such as sex and calcium supplementation, known to affect LT4 requirements, also contributed to better accuracy.
The optimal TSH level for thyroid cancer patients is lower than for benign thyroid disease patients. 3 For the first time, we developed an LT4 dose calculator that considers the TSH target and, therefore, can be used for all patients undergoing thyroid surgery.
The BMI disparity in the treatment of postoperative hypothyroidism is well known. 13 Obese patients are more likely to be overdosed using the weight-based formula. In our simulation, we demonstrated that the LT4 calculator recommends a lower dose in obese patients, which is expected to make hypothyroidism management more equitable across BMI strata. On the contrary, underweight patients were more likely to receive too little LT4 (elevated TSH on postoperative testing; Table 1) and will be better served by the calculator.
This study has several limitations. The LT4 dose calculator is based on the data collected from a single large health care system. Despite the substantial improvement in LT4 dose predictions in our study, the exact dose was accurately estimated for ∼45% patients, and a further increase in the machine learning–based LT4 dose calculation accuracy is likely achievable. A larger multi-institutional training data set, the inclusion of additional clinical covariates, and modeling potential nonlinear relationships between LT4 dose and predictors will result in better calculator accuracy. We made our data and code publicly available to support future research in this field. We demonstrated that older patients require less LT4 (negative coefficient for age in the linear regression model in Table 3). However, the impact of computer-assisted LT4 dosing in patients older than 65 years (more likely to suffer from overtreatment side effects) was not studied. Finally, the performance of our LT4 dose calculator was not evaluated prospectively.
Conclusions
In summary, we developed an LT4 dose calculator that outperforms weight- and LBM-based calculations and published machine learning tools. This calculator is designed to target both suppressed TSH ranges in patients with thyroid cancer and normal TSH in patients operated for benign disease. Using this calculator is expected to result in a TSH at goal in just under half of all patients on first postoperative testing. This is an improvement when compared with our institution's current practice, which achieves TSH at target in ∼30% of patients. The use of LT4 calculator is expected to shorten the time to the TSH target and reduce the cost of care. Our simulations demonstrated that using computer-assisted LT4 dose estimation will be particularly beneficial in patients at the extremes of body weight distribution.
Footnotes
Authors' Contributions
Following CRediT (Contributor Roles Taxonomy), authors contributed to this research project as follows: M.B.: data curation, formal analysis, investigation, methodology, software, visualization, writing—original draft; C.D.R.: conceptualization, project administration, supervision, validation, writing—review and editing; R.M.: resources, validation, writing—review and editing; M.A.-C.: validation, writing—review and editing; B.R.H.: conceptualization, project administration, resources, supervision, writing—review and editing; N.P.: conceptualization, data curation, formal analysis, investigation, methodology, resources, software, supervision, visualization, writing—original draft, writing—review and editing. M.B. and N.P. had direct access to and verified all underlying data. All models (except for ANNs) were developed in parallel by these two investigators in MatLab and R.
Data Sharing Statement
De-identified demographic, clinical, and laboratory data, reproducible code for machine learning model training, and access to the LT4 dose calculator web application are available to the community to promote transparency and encourage further development and prospective testing of computer-assisted management of postoperative hypothyroidism.
Author Disclosure Statement
No competing financial interests exist.
Funding Information
This research was supported by a research fellowship to Martin Barrio from the Departments of Surgery, Medicine, and Biomedical Informatics at the University of Colorado.
Supplementary Material
Supplementary Methods
Supplementary Figure S1
Supplementary Figure S2
Supplementary Table S1
Supplementary Table S2