
Abstract
Background:
During active surveillance (AS), serum thyrotropin (TSH) levels may affect papillary thyroid microcarcinoma (PTMC) progression. We investigated AS outcomes according to whether levothyroxine (LT4) treatment was administered.
Patients and Methods:
From 2005 to 2019, 2896 patients with low-risk PTMC underwent AS. Of these, 2509 patients were included: 2187 patients did not receive LT4 at diagnosis (group I), 1935 patients did not receive LT4 during AS (group IA), and 252 patients started LT4 during AS (group IB). The remaining 322 patients were administered LT4 before or at diagnosis (group II). The tumor volume doubling rate (TVDR) and tumor size based on ultrasound examination results and time-weighted detailed TSH scores were calculated. Disease progression was defined as tumor enlargement ≥3 mm and/or the appearance of novel lymph node metastasis.
Results:
At diagnosis, group II had more high-risk features, such as younger age and larger tumors, than group I. However, group II had a lower disease progression rate (2.9% at 10 years) than group I (6.1%) (p = 0.091). The disease progression rate of group IB (13.8% at 10 years) was significantly higher than that of groups IA (5.0%) and II (2.9%) (p < 0.01). The TVDR of group IB before LT4 administration was significantly higher than that of groups IA and II (0.095 per year, −0.0085 per year, and −0.057 per year, respectively; p < 0.01), suggesting that patients with progression signs during AS were selectively prescribed LT4. The time-weighted detailed TSH score of group IB significantly decreased after LT4 administration compared with those before administration (3.35 and 3.05, respectively; p < 0.01). The TVDR also decreased from 0.13 per year to 0.036 per year (p = 0.08). The proportions of patients with rapid or moderate growth decreased significantly after LT4 (from 26.8% to 12.5%, p < 0.01). A multivariable analysis revealed group IB status was independently associated with disease progression (odds ratio [OR] = 3.42 [CI 2.15–5.44], p < 0.01), whereas age ≥40 years and <60 years and age ≥60 years were independently negatively associated with this outcome (OR = 0.23 [CI 0.14–0.38, p < 0.01 and OR = 0.16 [CI 0.10–0.27], p < 0.01).
Conclusion:
LT4 treatment may be associated with decreased tumor growth during AS of PTMC, but further confirmatory research is needed.
Introduction
Active surveillance (AS) of low-risk papillary thyroid microcarcinoma (PTMC; cT1aN0M0) was initiated at Kuma Hospital in 1993, and at the Cancer Institute Hospital in 1995. 1,2 It has been widely accepted worldwide as a management strategy. 3 –7 In 2015, the American Thyroid Association guidelines discussed AS as a management option for consideration for PTMC. 8 Furthermore, the Japan Association of Endocrine Surgery and the Japan Thyroid Association published a consensus statement and position paper, respectively, supporting the introduction of AS for PTMC in 2021. 9,10 Favorable outcomes, such as lower incidences of vocal cord paralysis, hypoparathyroidism, and surgical scars, and oncological outcomes equivalent to those of immediate surgery, have been reported for AS. 11 –15
Thyrotropin (TSH) suppression inhibits tumor growth of differentiated thyroid cancer because of the retained responsiveness to TSH, as shown by in vitro and in vivo research. 16 Furthermore, TSH suppressive therapy is widely accepted as a treatment intended for the prevention of metastatic recurrence after thyroid cancer surgery. 8,17 Controversial data regarding the relationship between TSH levels and PTMC progression have been reported, 18,19 but our recent study showed that TSH levels within low normal to mild subnormal ranges were associated with lower rates of tumor growth of PTMC, especially in young patients. 20
Our original protocol for the AS trial did not include studying the effects of levothyroxine (LT4) and serum TSH levels on disease progression. However, during the study, some physicians prescribed LT4, with the expectation of possible suppressive effects on disease progression. In this retrospective study, we investigated the differences in PTMC growth activity and prognosis among the following patient groups: those who were not administered LT4 during the entire course of AS, those who began receiving LT4 during the course of AS, and those who were administered LT4 before or at the time of diagnosis. We also studied whether the progression of PTMC changed before and/or after LT4 treatment that was initiated during AS.
Materials and Methods
Patients
After the introduction of the electronic medical record system at Kuma Hospital, we reviewed data from 4632 patients aged ≥20 years who were cytologically diagnosed with low-risk PTMC between February 2005 and December 2019. These patients had tumors ranging from 3 to 10 mm at the initial diagnosis and no evidence of cervical lymph node metastasis, distant metastasis, extrathyroidal invasion, nor vocal cord paralysis. The diagnosis was ascertained by ultrasonography and fine-needle aspiration cytology. Of these 4632 patients, 2896 underwent AS for >1 year. We excluded 387 patients who did not undergo ultrasonography at least 4 times and those who had coexisting Graves' disease or other thyroid malignancies; we enrolled the remaining 2509 patients in this study (Fig. 1).
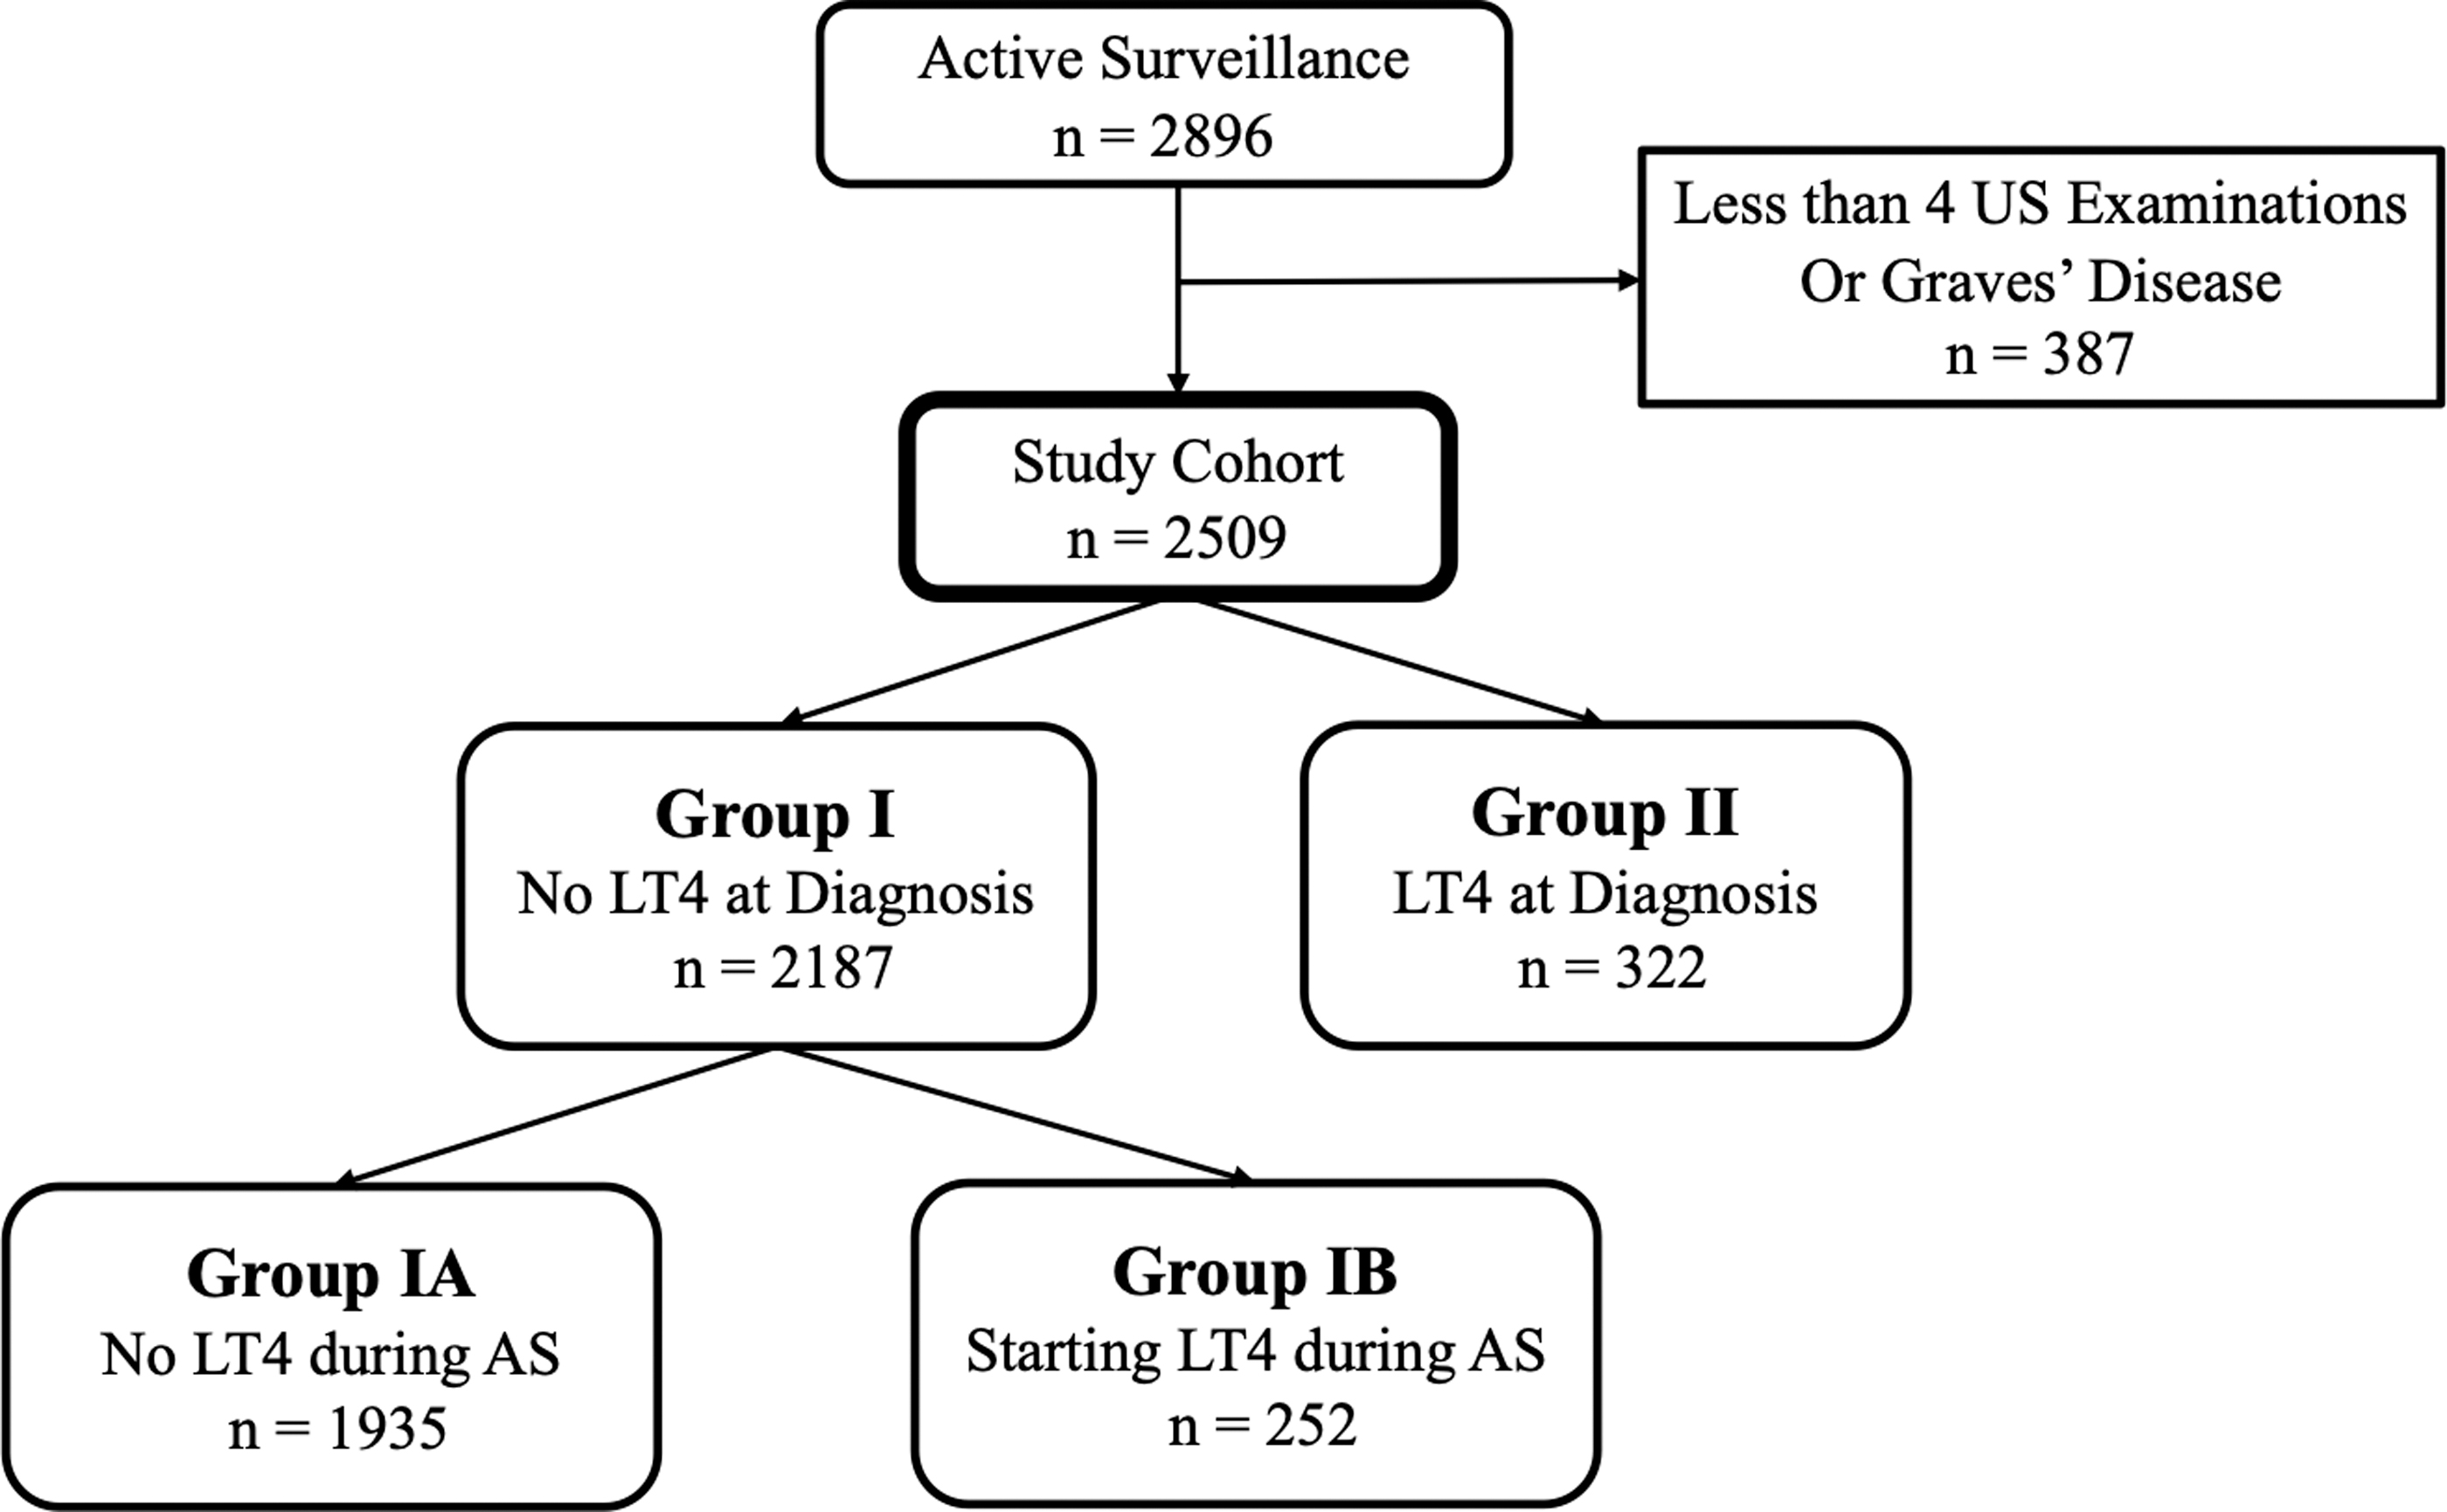
Patient flow diagram.
Of these, 2187 were not administered LT4 at the time of diagnosis (group I: no LT4 at diagnosis); these were further subdivided into 2 groups: patients who did not receive LT4 administration during the course of AS (group IA: no LT4 during AS; 1935 patients) and patients who were administered LT4 during the course of AS (group IB: started LT4 during AS; 252 patients). In group IB, patients were administered LT4 primarily to lower serum TSH levels. However, 322 patients received LT4 before or at the time of AS initiation (group II: LT4 at diagnosis). Of these, 29 patients (9%) had hypothyroidism before or at the time of diagnosis of PTMC, 32 patients (10%) had subclinical hypothyroidism, and the remaining 261 patients (81%) were prescribed LT4 with the intention of lowering serum TSH levels.
This study was approved by the ethics committee of Kuma Hospital (No. 20200709-1). Because of the retrospective nature of this study, the requirement for informed consent was waived. This study was conducted in accordance with the Declaration of Helsinki, as revised in 2013.
AS of PTMC
Outpatient visits were conducted once or twice per year, including ultrasound examinations (evaluating the tumor size in at least two dimensions and presence of cervical lymph node metastases) as well as bloodwork for thyroid function tests. The reference tumor sizes at diagnosis were set as the mean of the two initial measurements to minimize observer variations. If a tumor size increased ≥3 mm in the maximum diameter or in any axis compared with the reference value at 2 successive ultrasound examinations, the tumor was defined as enlarged at the point of the first ultrasound examination.
Disease progression was defined as tumor enlargement and/or the novel appearance of lymph node metastasis. When disease progression occurred, conversion surgery was discussed with the patient. If the patient wished to continue AS, then it was continued until the tumor reached 13 mm. If the tumor reached this size, surgery was recommended. If lymph nodes with suspected malignancy were detected by ultrasonography, then fine-needle aspiration cytology was performed and thyroglobulin in the washout of the needle was measured. If a patient was diagnosed with metastasis of papillary thyroid carcinoma, then conversion surgery was recommended.
Calculating the tumor volume doubling rate
The tumor volume doubling rate (TVDR) was calculated using a previously described formula.
21
The maximum diameter (D
1) and diameter (D
2) perpendicular to D
1 were measured. Sometimes the tumor depth is not a reliable measurement because of ultrasound shadowing. Therefore, the tumor volume (V) was calculated using the following ellipsoid equation:

This calculation can be performed using our doubling time, doubling rate, and progression calculator (available from
Administration of LT4
Although our original protocol for the AS trial did not mention prescribing LT4, during the study, some physicians initiated LT4 (with the agreement of the patients), with the expectation of possible suppressive effects on disease progression. There are no hospital standards for LT4 administration for patients under AS for PTC without hypothyroidism; therefore, the initiation of LT4 administration was at the discretion of the physician in charge and with the agreement of the patients. A minority of the physicians at Kuma Hospital administered LT4, with the intention to reduce serum TSH levels to the lower half of the normal range or mildly subnormal range, while avoiding thyrotoxic symptoms with the expectation of possible suppressive effects on tumor growth.
Detailed TSH score
TSH levels were measured using Architect TSH (the lowest detection level: <0.003 mIU/mL and the range of normal value: 0.3–5 mIU/mL; Abbott Japan LLC, Tokyo, Japan) until December 2018, and using Elecsys TSH (the lowest detection level: <0.005 mIU/mL and the range of normal value: 0.5–5 mIU/mL; Roche Diagnostics KK, Tokyo, Japan) beginning in January 2019. Cooper et al. created a TSH scoring system to evaluate the effects of TSH on differentiated thyroid cancer progression. 22 To perform a detailed analysis of the effects, we modified the original system to create a novel detailed TSH scoring system. 20
In brief, the detailed TSH scores were defined as follows: 1, lower than the limit of detection; 2, detectable and <0.05 mIU/mL; 2.5, ≥0.05 mIU/mL and less than the lower limit of normal; 3, within the normal range and lower than the mean of the normal range; 3.5, within the normal range and above the mean of the normal range; and 4, higher than the upper limit of normal. Because the intervals between patient visits were uneven, the time-weighted detailed TSH score during the study period was calculated as follows:
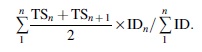
In the aforementioned equation, ID n is the interval (days) and TS n and TS n+1 are the detailed TSH scores at the beginning and end of each interval, respectively.
Statistical analysis
All statistical analyses were performed using R version 4.2.1. Fisher's exact test was performed to compare variables. The Mann–Whitney U test was performed to compare the two groups without correspondence. The Wilcoxon signed-rank test was performed to compare the two groups with correspondence. The Kruskal–Wallis test was performed to compare the three groups without any correspondence.
The Kaplan–Meier method and log-rank test were performed during the time-series analysis. Hazard ratios were calculated using a Cox proportional hazards model. The McNemar test was applied to test the change in the proportion before and after treatment. Univariable logistic regression analyses were performed to identify independent prognostic factors. Multivariable logistic regression analyses of factors with p < 0.20 were performed. Differences were considered statistically significant at p < 0.05.
Results
Group II (LT4 at diagnosis) was younger (p < 0.01) and had larger tumors (p < 0.05), higher detailed TSH scores (p < 0.01), and a higher incidence of thyroglobulin antibody positivity than group I (no LT4 at diagnosis) (Table 1). The time-weighted detailed TSH score during the study period of group II was lower (p < 0.01) than that of group I because group II was prescribed LT4. Table 2 compares the backgrounds and clinical characteristics of groups IA (no LT4 during AS) and IB (started LT4 during AS). The initial tumor size was larger (p < 0.01), the AS duration was longer (p < 0.01), and the mean detailed TSH score at diagnosis and time-weighted detailed TSH score were higher (p < 0.01) in group IB than in group IA.
Comparison of Backgrounds and Clinical Characteristics Between Groups I and II
Values are mean ± SD, median (ranges) or number (proportion %).
The average of the tumor sizes at the first and the second examinations was considered the baseline size to minimize observer variations.
Values were calculated for the entire observation period.
AS, active surveillance; LT4, levothyroxine; SD, standard deviation; TgAb; antithyroglobulin antibody; TSH, thyrotropin.
Comparison of Background and Clinical Characteristics Among Groups IA and IB
Values are mean ± SD, median (ranges), or number (proportion %).
The average of the tumor sizes at the first and the second examinations was considered the baseline size to minimize observer variations.
Values were calculated for the entire observation period.
PTMC in group I tended to be progressive (p = 0.08), and the incidence of conversion surgery after AS was higher in group I (p < 0.01) than in group II (Table 3). A comparison between groups IA and IB showed that tumors in group IB were more likely to enlarge (p < 0.01) than those in group IA (Table 4). However, there was no significant difference in the incidence of conversion surgery among groups, and no deaths were attributable to thyroid cancer (Table 4).
Comparison of Oncological Outcomes Between Groups I and II
Values are numbers (proportion %).
DOD, died of disease; LN, lymph node.
Comparison of Oncological Outcomes Among Groups IA and IB
Values are numbers (proportion%).
Figure 2 shows the Kaplan–Meier curves for the cumulative incidence of disease progression (CIDP) of groups I (no LT4 at diagnosis) and II (LT4 at diagnosis). The CIDP of group II tended to be lower (p = 0.091) than that of group I (2.9% vs. 6.1% at 10 years). During the subset analysis of group I, however, the CIDP of group IB (started LT4 during AS) was significantly higher (p < 0.01) than that of group IA (no LT4 during AS) (13.8% vs. 5.0% at 10 years) (Fig. 3).
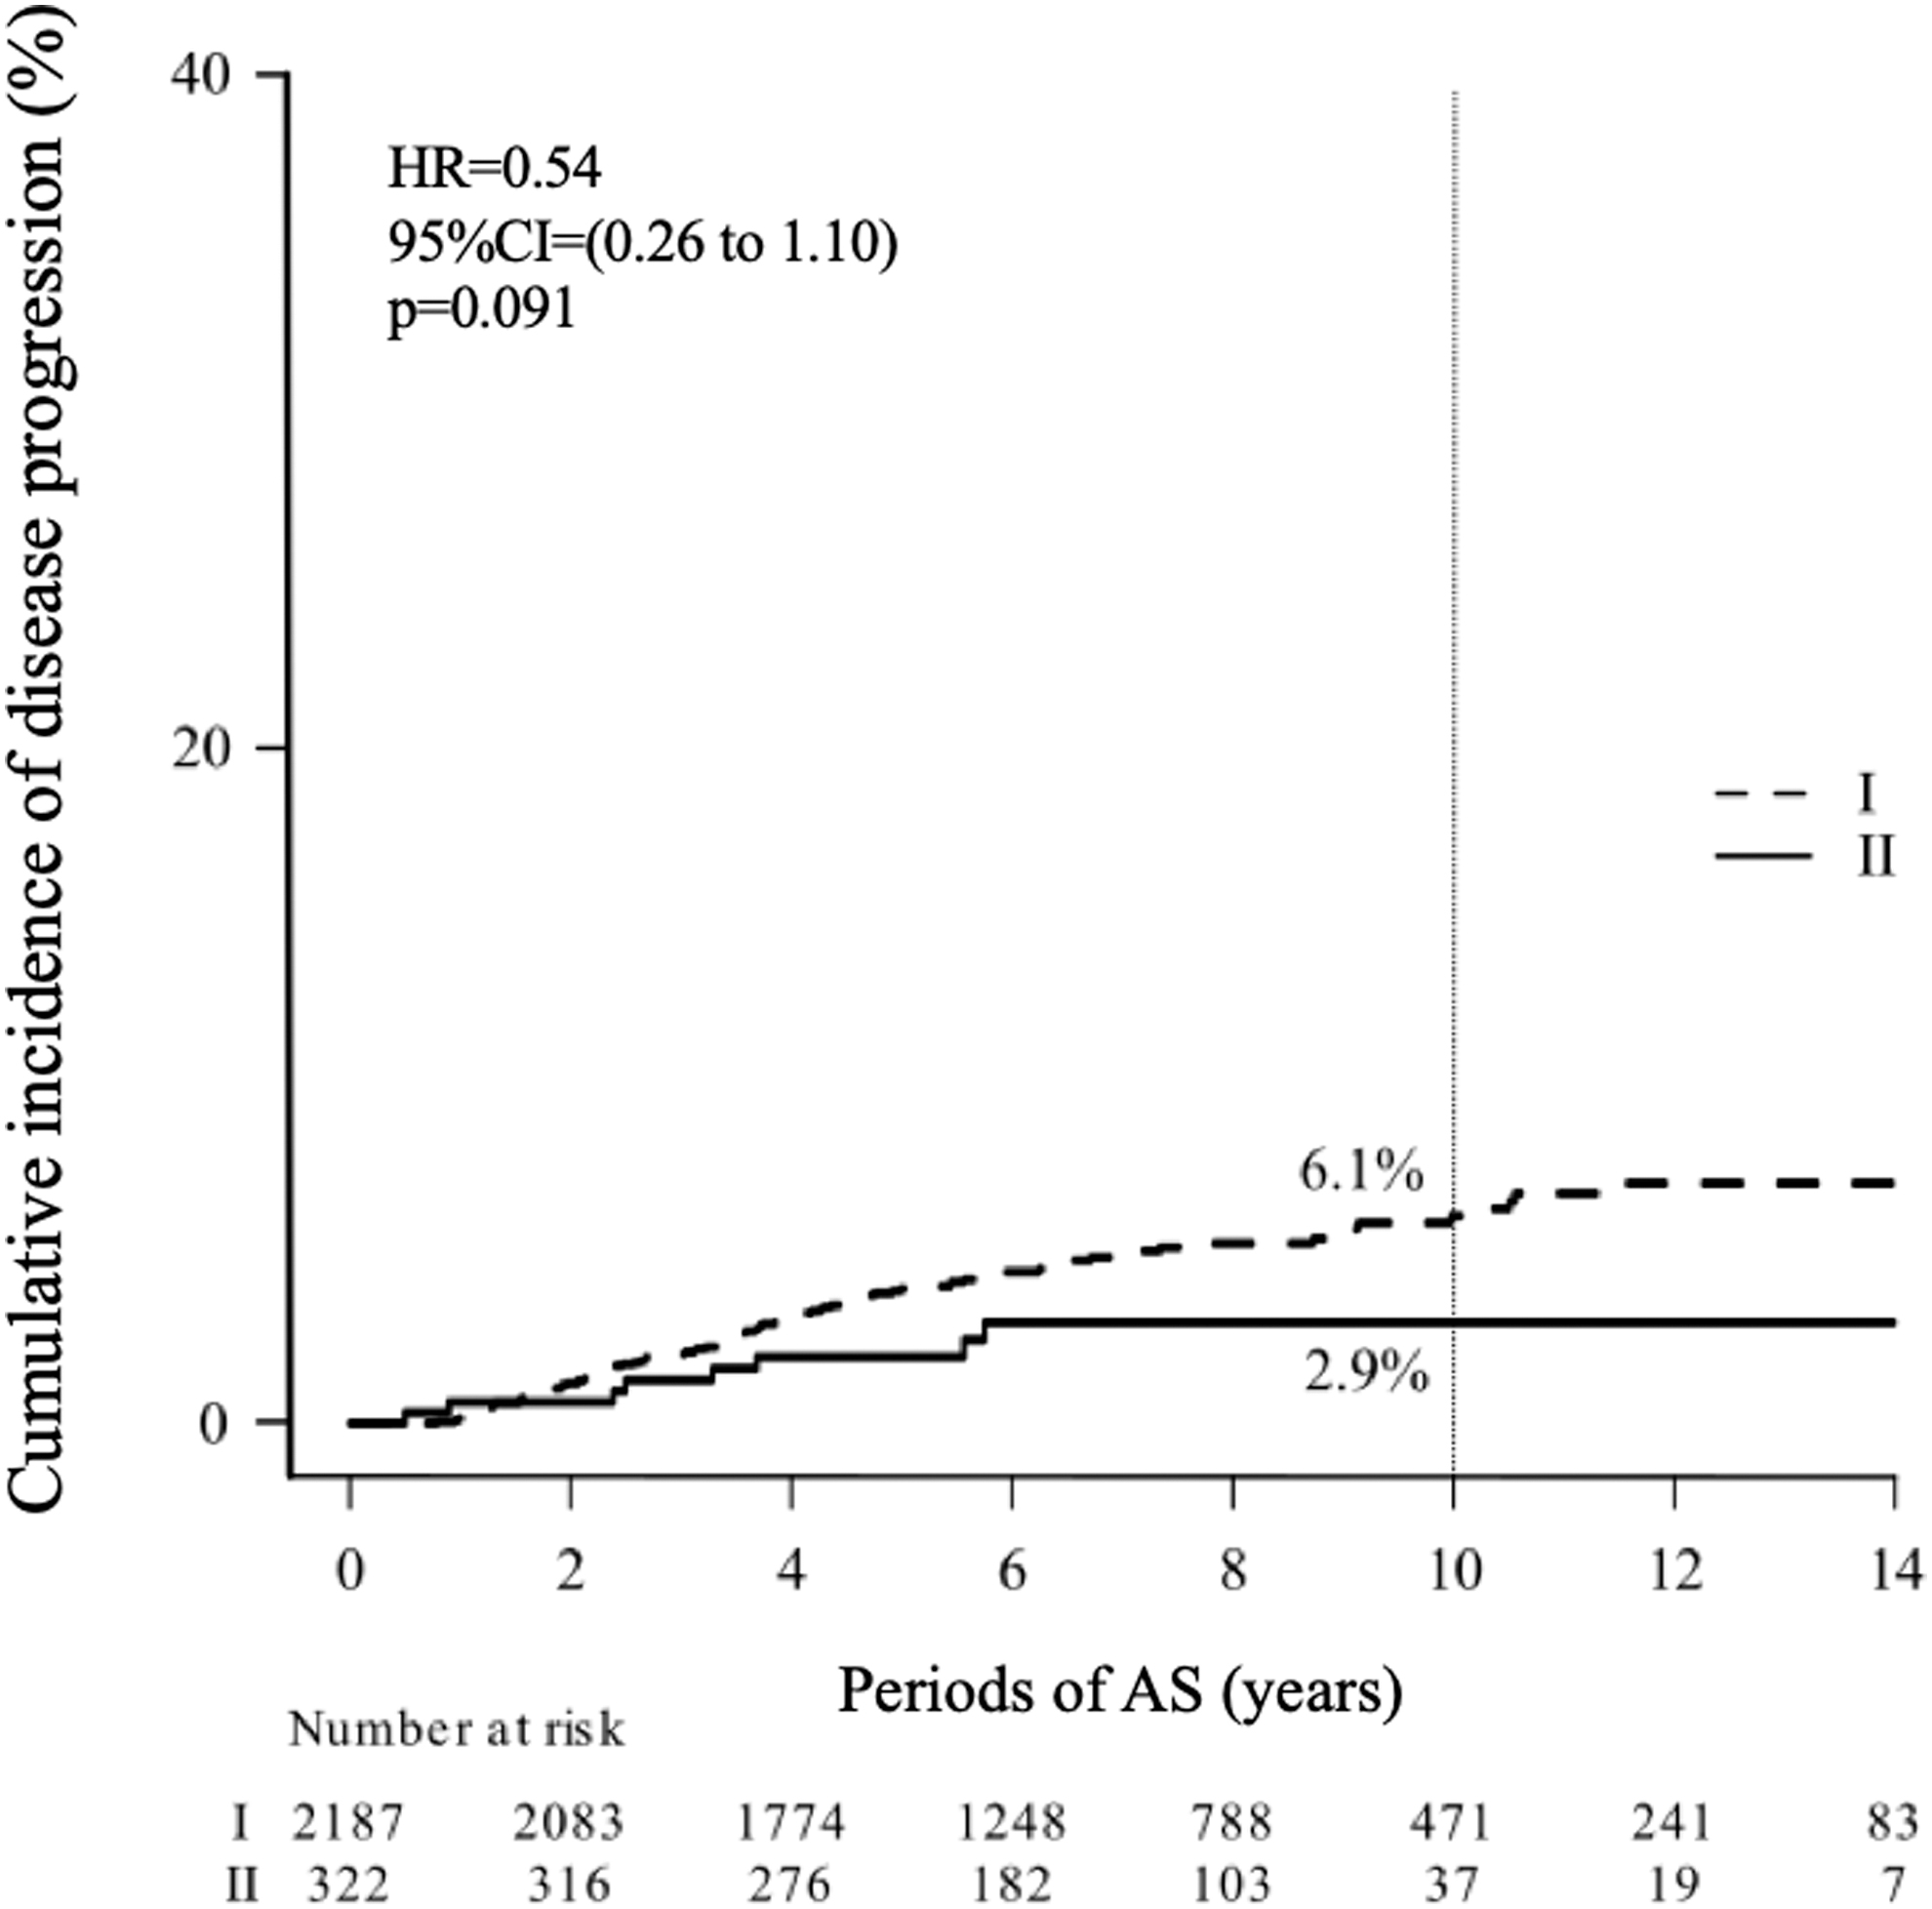
Kaplan–Meier curves showing the CIDP of patients in groups I (no LT4 at diagnosis) and II (LT4 at diagnosis). CI, confidence interval; CIDP, cumulative incidence of disease progression; LT4, levothyroxine.
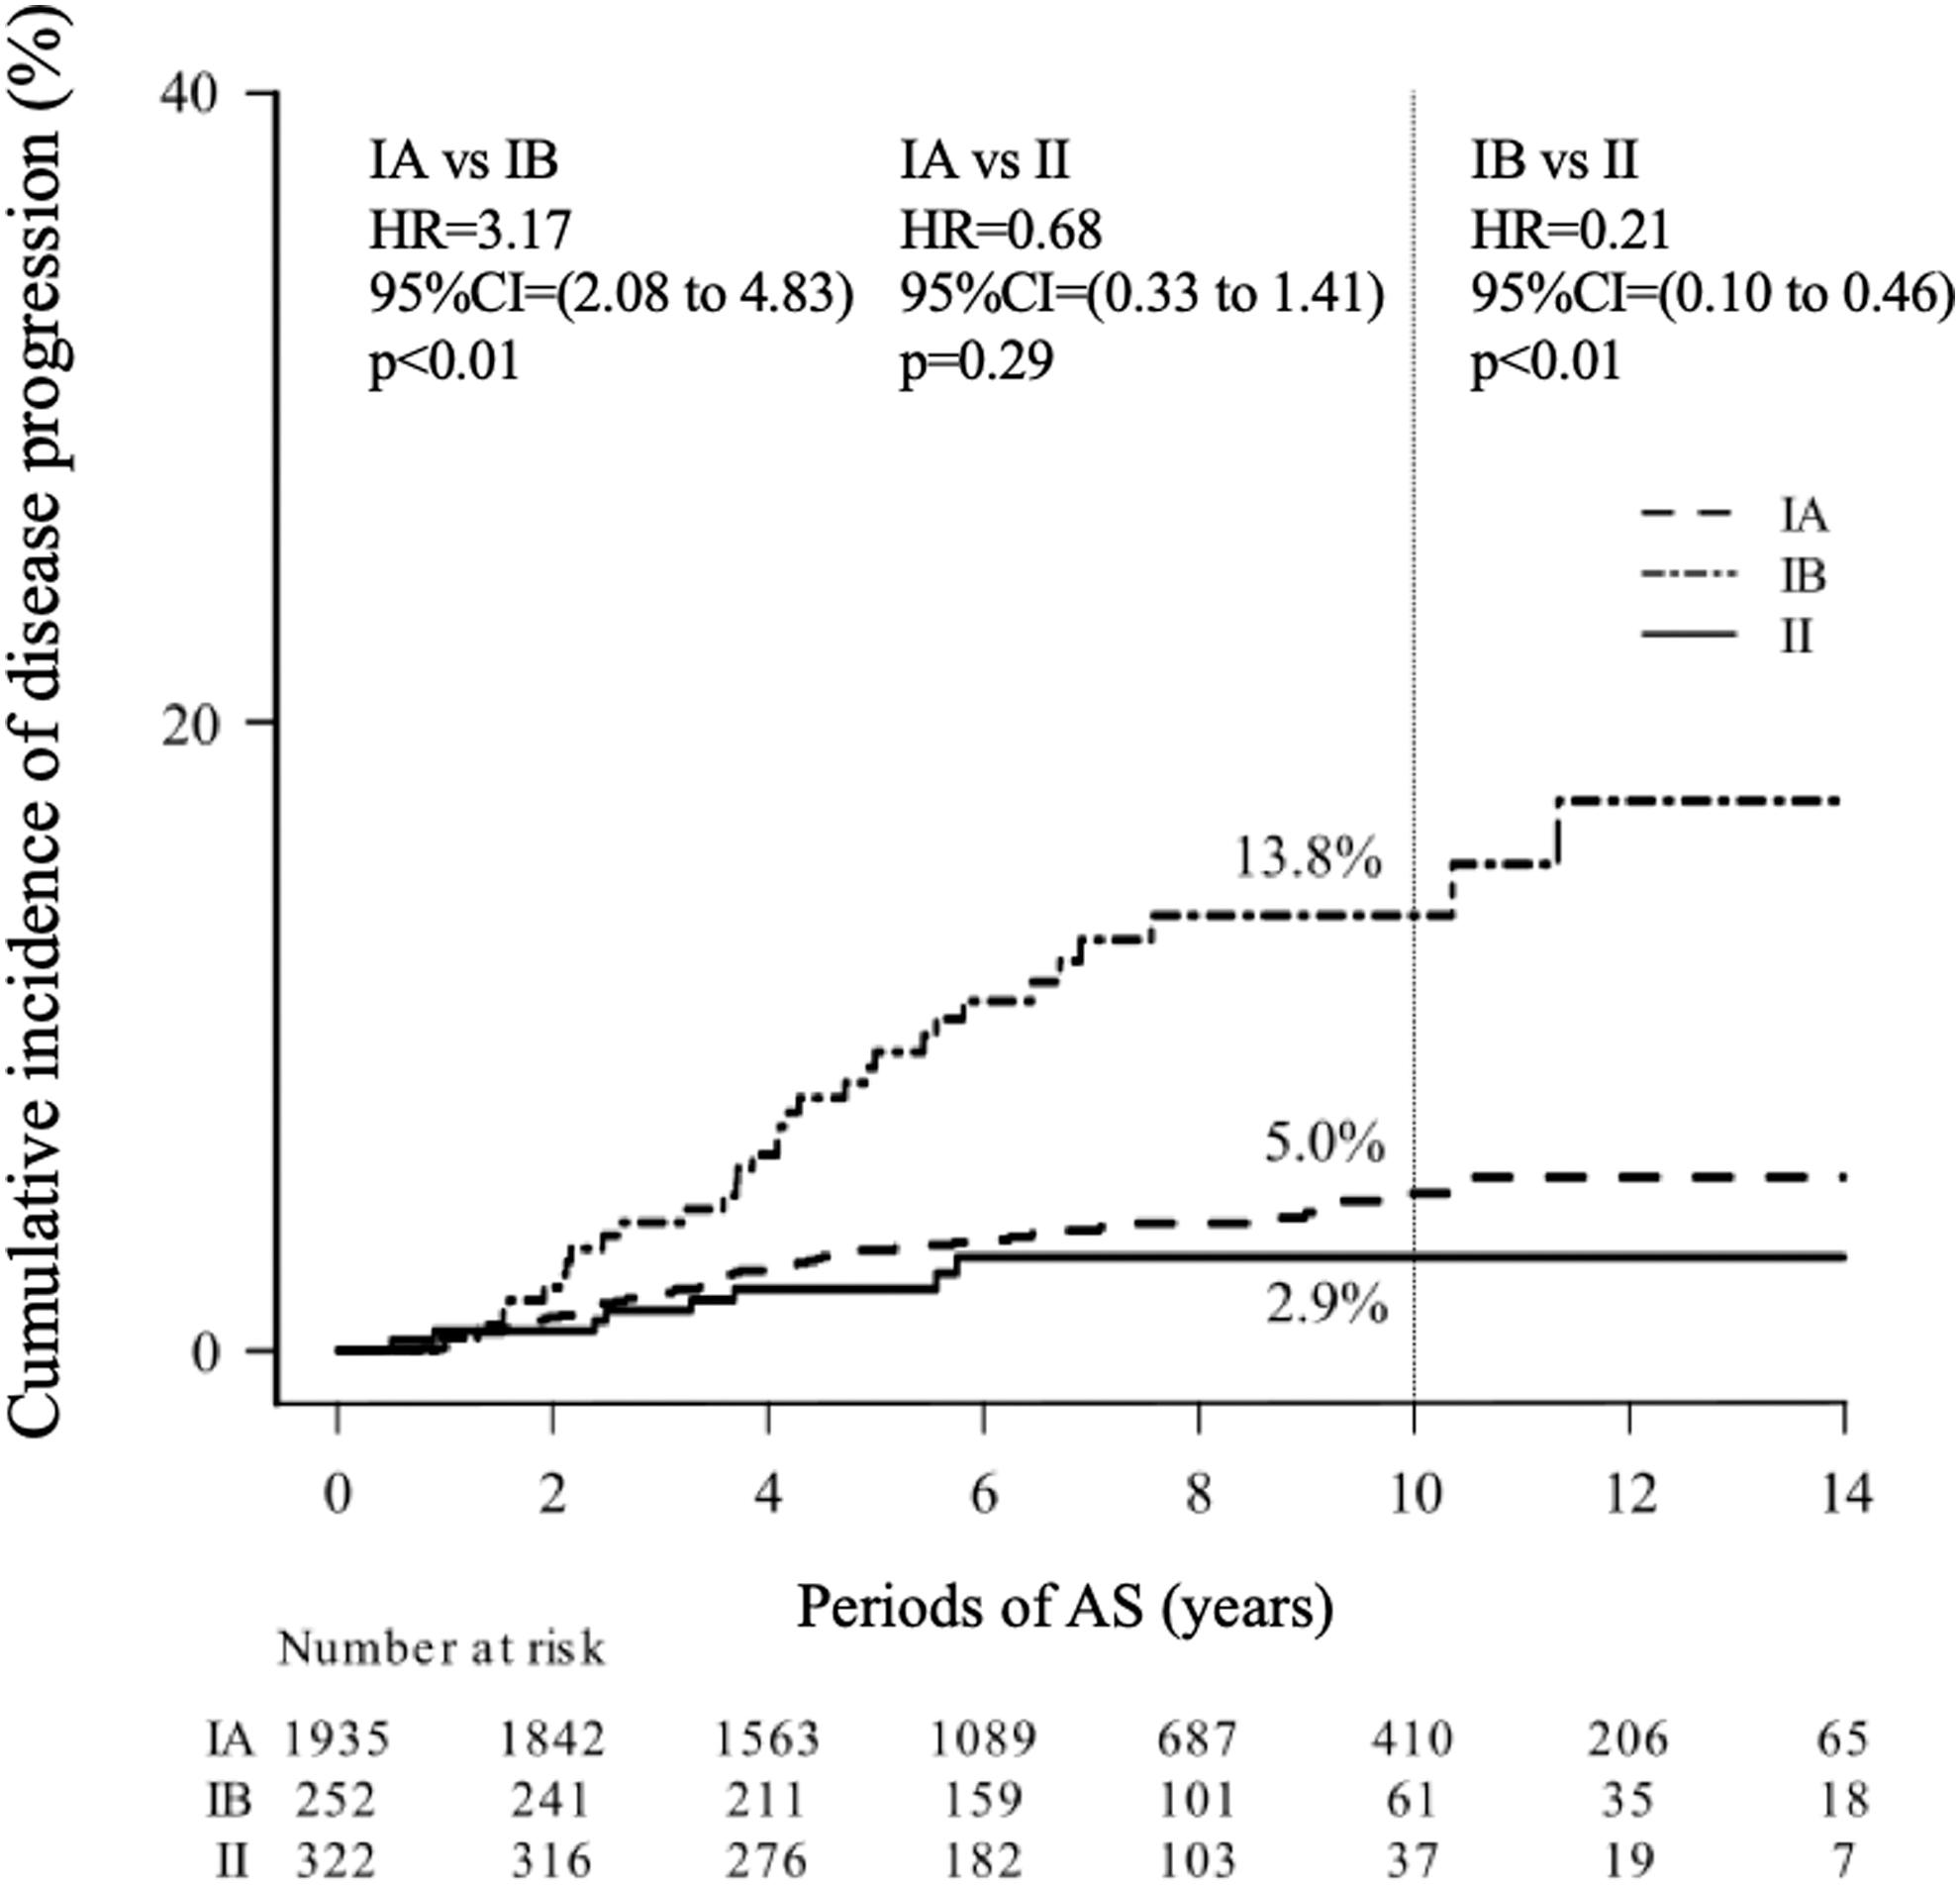
Kaplan–Meier curves showing the CIDP of patients in groups IA (no LT4 during AS), IB (started LT4 during AS), and II (LT4 at diagnosis). AS, active surveillance.
We also compared the TVDR (per year) of groups I and II. Group I included 252 patients who started LT4 during AS (group IB). We included only the predose data to calculate the TVDR of group I. We excluded 58 patients who did not undergo ultrasound examinations at least 4 times before starting LT4. The mean TVDR of group II (−0.057 ± 0.23 per year) was significantly smaller (p < 0.01) than that of group I (0.00096 ± 0.26 per year). The mean TVDRs of groups IA, IB (only before starting LT4), and II were −0.0085 ± 0.22, 0.095 ± 0.47, and −0.057 ± 0.23, respectively. The growth activity of tumors in group IB before the initiation of LT4 was significantly higher than that in groups IA and II (p < 0.01).
The mean time-weighted detailed TSH scores and TVDRs before and after starting LT4 were calculated for group IB (started LT4 during AS). For this analysis, we enrolled 127 patients who underwent ultrasound examinations at least three times both before and after starting LT4. The mean time-weighted detailed TSH score before LT4 significantly decreased after starting LT4 (3.35 ± 0.30 vs. 3.05 ± 0.29; p < 0.01). In addition, TVDRs after starting LT4 tended to be lower than those before starting LT4 (0.036 ± 0.54 vs. 0.13 ± 0.56; p = 0.08).
A multivariable analysis showed that group IB status was independently associated with disease progression (OR = 3.42 [CI 2.15–5.44], p < 0.01), whereas age ≥40 years and <60 years and age ≥60 years were independently negatively associated with this outcome (OR = 0.23 [CI 0.14–0.38], p < 0.01 and OR = 0.16 [CI 0.10–0.27], p < 0.01) (Table 5).
Univariable and Multivariable Analysis for Factors Associated with Progression
Negative factors.
OR, odds ratio.
Another multivariable analysis showed that male sex was independently associated with the appearance of lymph node metastasis (OR = 4.78 [CI 1.75–13.1], p < 0.01), whereas age ≥40 years and <60 years and age ≥60 years were independently negatively associated with this outcome (OR = 0.28 [CI 0.10–0.78], p = 0.015 and OR = 0.12 [CI 0.03–0.43], p < 0.01). A time-weighted detailed TSH score ≥3 tended to be negatively associated with incident lymph node metastasis, but the association was not statistically significant (p = 0.089) (Table 6).
Univariable and Multivariable Analyses for Factors Associated with Lymph Node Metastasis
Negative factors.
Group IB patients started LT4 during AS. They were divided into five subgroups according to tumor growth activity before and after LT4 administration, respectively, using the following cutoffs for TVDR (per year): 1.0, 0.3, 0, and −0.1 (Fig. 4). The proportion of patients with TVDR ≥1.0 (rapid growth) and with TVDR <1.0 and ≥0.3 (moderate growth) significantly decreased to 12.5% after LT4 administration from 26.8% before LT4 (p < 0.01) (Fig. 4). The proportions of the patients with TVDR <0.3 and ≥0 (marginal growth) before and after LT4 were 31.5% and 27.6%, respectively (not significant). In addition, the proportion of patients with TVDR <0, indicating decreased tumor volume or regression, increased from 41.7% to 59.8% after starting LT4 (p < 0.01).
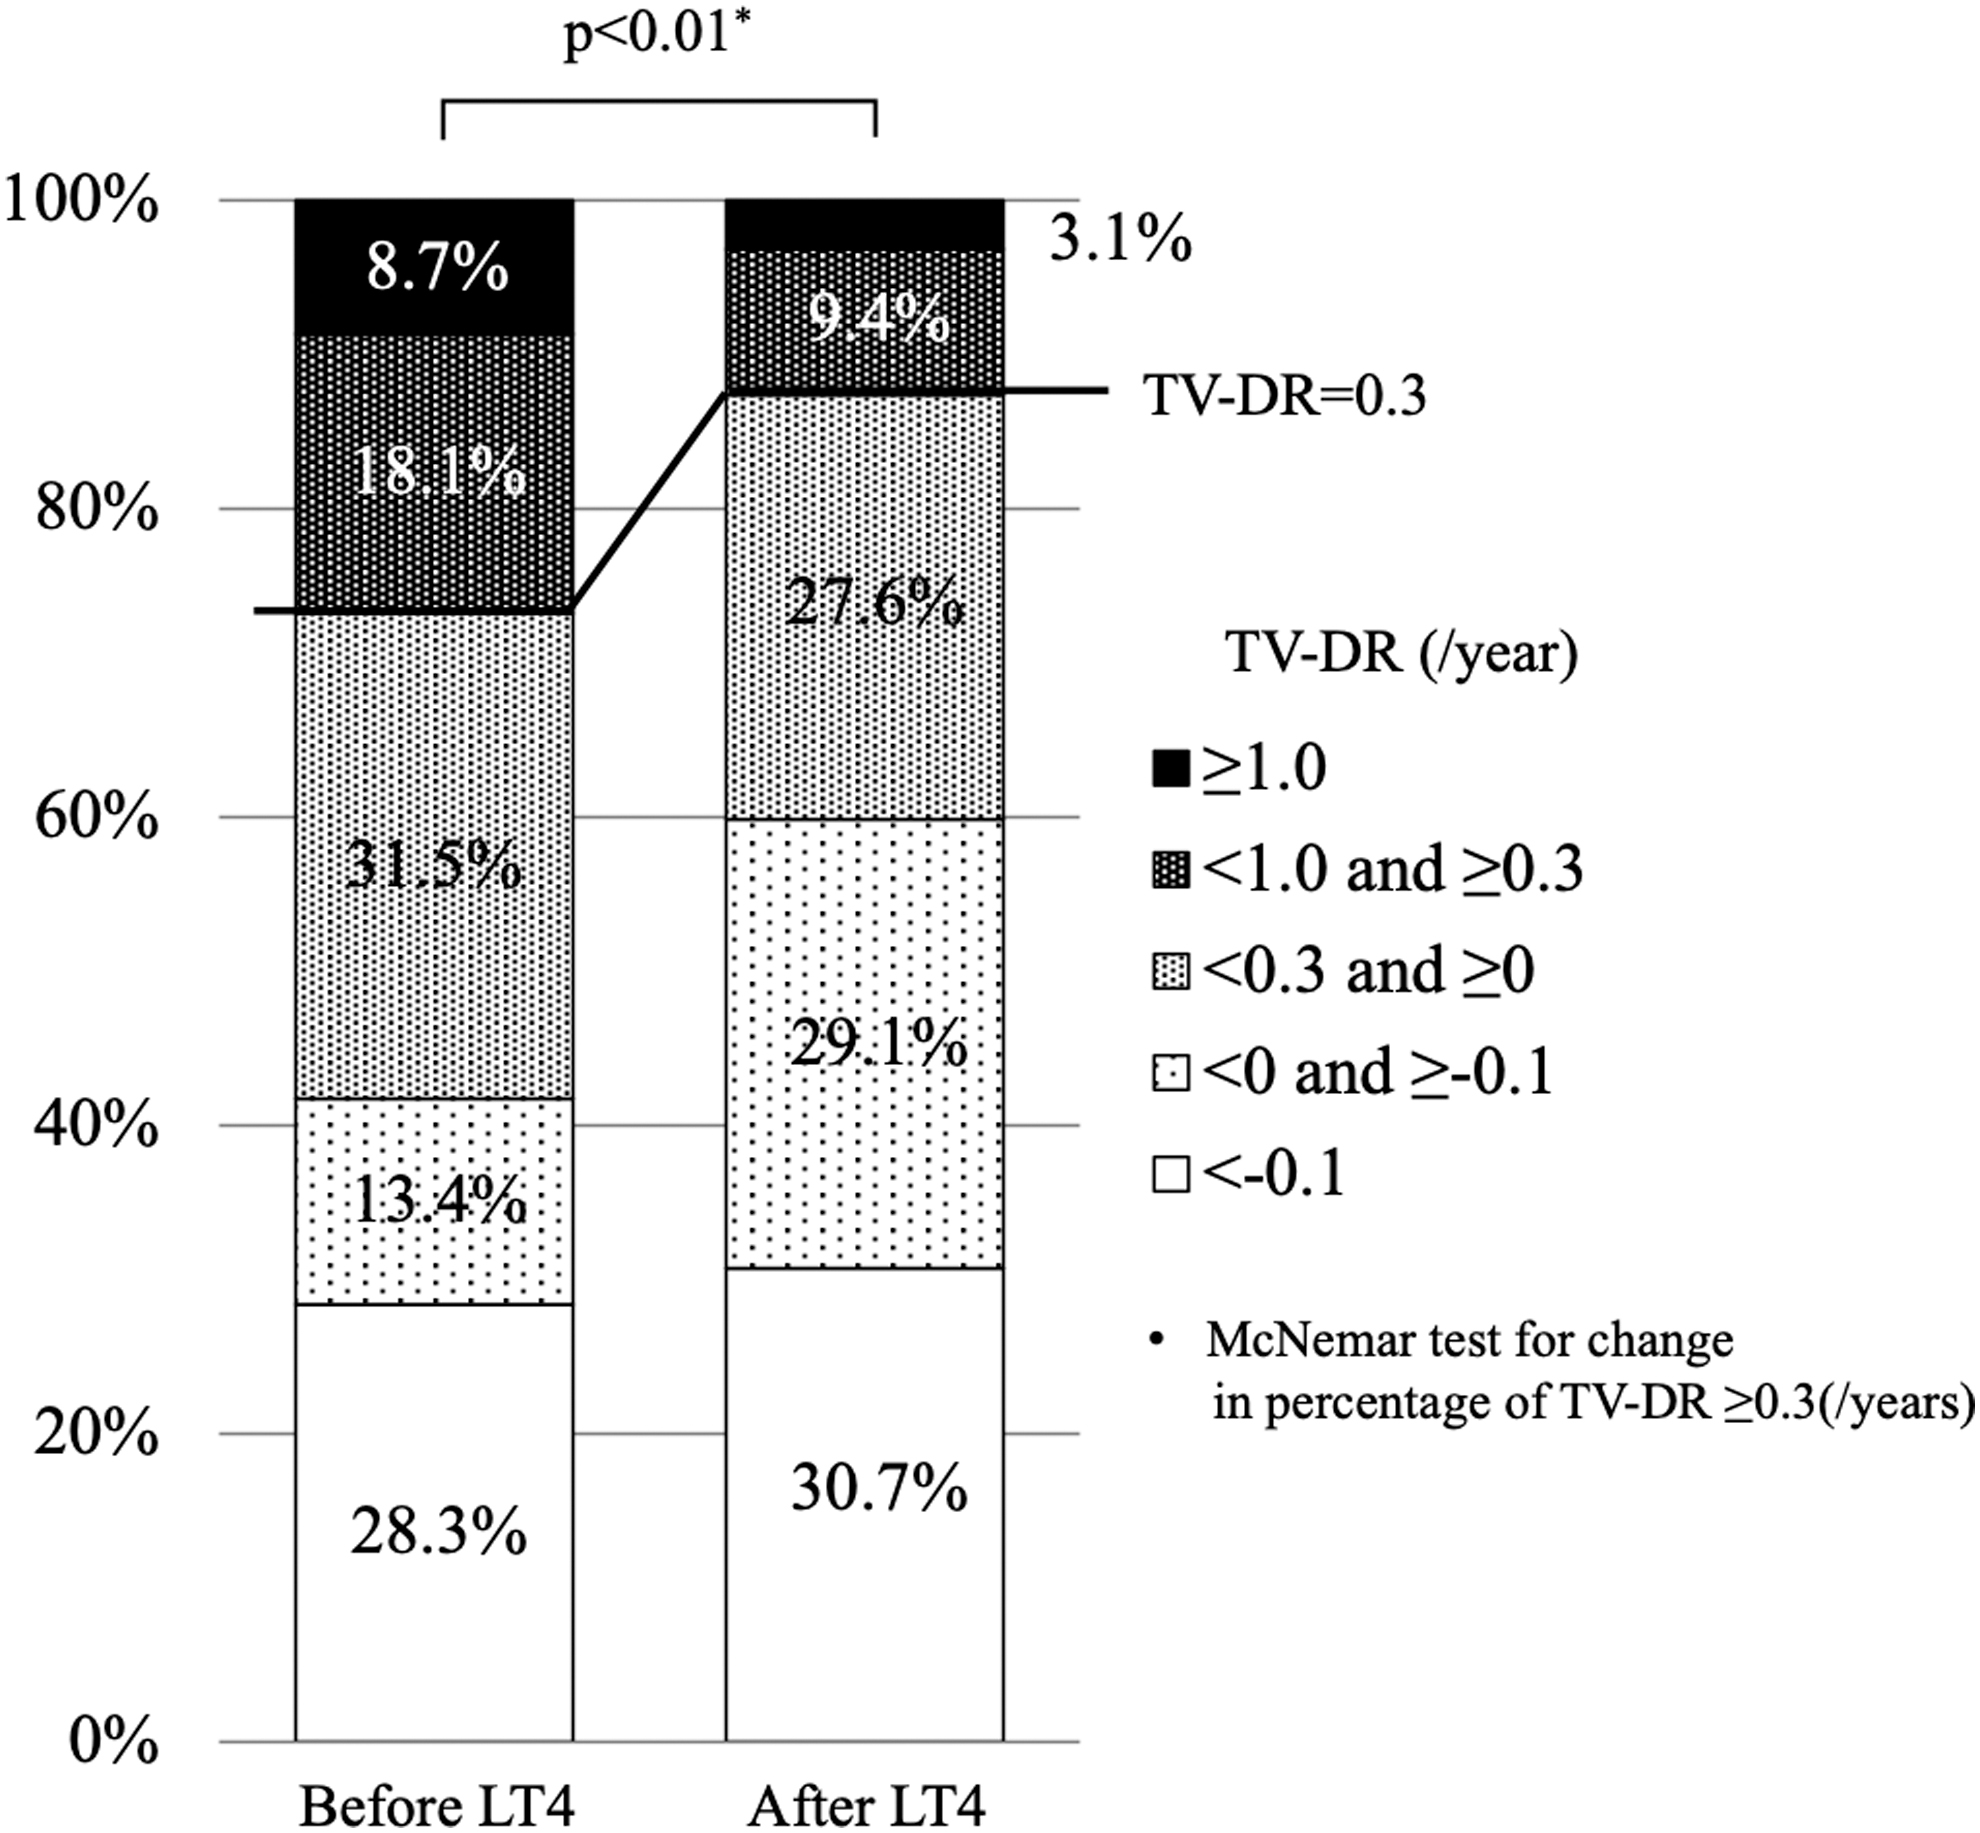
.Changes in the TVDRs of patients in group IB (started LT4 during AS) before and after LT4 administration.
Discussion
It is important to determine whether and how TSH levels affect PTMC progression, and whether and how lowering serum TSH levels with LT4 administration affects PTMC tumor growth activities during AS. Sugitani et al. showed that neither baseline nor mean TSH levels were related to PTMC progression. 18 Kim et al. demonstrated that the highest (third tertile) time-weighted average serum TSH level significantly affected PTMC progression. 19 We developed a detailed TSH scoring system and showed that a detailed TSH score <3 (less than the lower normal limit) was significantly associated with a lower incidence of PTMC enlargement in patients younger than 40 years of age. 20 However, whether LT4 administration affects PTMC progression remains unclear.
In this study, we investigated the differences in the clinical features and outcomes of PTMC patients. Group II (LT4 at diagnosis) had larger tumors and was younger, indicating that tumors in group II were at higher risk for progression than others. 3,4,19 We previously reported that age, tumor size, and TSH values at diagnosis were independent risk factors for PTMC progression during AS. 20 For patients who underwent thyroid surgery for clinical papillary or follicular thyroid carcinoma, maintaining the serum TSH levels at low or mildly suppressed levels with LT4 administration is a common practice for preventing recurrence or progression of disease. 22,23
A minority of physicians at Kuma Hospital started LT4 administration at diagnosis with the intention of preventing tumor progression in this cohort of PTMC patients who underwent AS; however, the ability of LT4 to prevent this progression has not yet been proven. Group II (LT4 at diagnosis) was younger, had larger tumors, and had higher TSH scores at diagnosis than group I (no LT4 at diagnosis) patients. The accumulation of AS data showed these three features were significant risk factors for disease progression. 20
Regardless of these features at diagnosis, group II had lower time-weighted detailed TSH scores, a lower tendency for disease progression, and a significantly lower rate of conversion surgery than group I. Furthermore, the CIDP of group II was lower than that of group I (Fig. 2), suggesting that lowering the TSH level with LT4 effectively decreased the PTMC growth activity.
Group IB (started LT4 during AS) had larger tumors. Furthermore, the incidence of tumor enlargement was higher in group IB than in group IA (no LT4 during AS) (Tables 2 and 4). It is likely that when the attending physicians recognized enlargement of these tumors, they started LT4 administration for group IB, which caused strong bias in the selection of group IB. This explains why group IB status was an independent predictor of disease progression. Although LT4 was initiated during the course of AS, the CIDP of group IB was higher than that of group IA (Fig. 3). The TVDR of group IB before LT4 administration was significantly higher than that of group IA, which clearly indicated that many tumors in group IB were more progressive than those in group IA.
We compared the time-weighted detailed TSH scores and TVDRs of group IB before and after LT4 administration. The time-weighted detailed TSH score after LT4 administration significantly decreased from 3.35 ± 0.30 before administration to 3.05 ± 0.29 after administration. However, this value remained higher than that of group II (LT4 at diagnosis) (2.98 ± 0.24) (Table 1). This might have occurred because the minority physicians who treated group II more strongly believed that TSH levels should be suppressed to low normal levels (or even levels slightly lower than the normal range while avoiding thyrotoxic symptoms) than the other physicians who treated group IB.
In group IB (started LT4 during AS), TVDR showed a tendency to decrease after the initiation of LT4 (from 0.13 per year to 0.036 per year). The proportion of patients with rapid growth or moderate growth (TVDR ≥0.3) decreased from 26.8% to 12.5% after LT4 administration (p < 0.01) (Fig. 4), suggesting that if LT4 had been administered to group IB patients at diagnosis to achieve sufficient lowering of TSH levels, then the incidence of progressive disease would have been decreased by half. However, this was not the focus of this study.
This study confirmed our previous finding of a high incidence at 17% of clear spontaneous regression with TVDR <0.1 per year of low-risk PTMC during AS 21 and suggested that lowering the TSH level with LT4 might enhance this regression. In group IB (started LT4 during AS), the proportion of patients with decreased tumor volume (TVDR <0) increased from 41.7% to 59.8% after LT4 administration (p < 0.01) (Fig. 4). Spontaneous cancer growth rate deceleration and spontaneous cancer regression with papillary thyroid carcinoma have also been observed among young and middle-aged patients and those with hereditary medullary thyroid carcinoma. 24
Our study had several limitations. This AS trial of PTMC was initiated as a prospective clinical cohort study at a single institute; however, it was not a randomized study and the current report is a retrospective analysis of data using an intervention that was not preplanned (LT4). Patients were offered the choices of immediate surgery, AS, or AS with LT4 initiated during the course of AS (after the study was already in progress). Furthermore, LT4 administration and the intended TSH level of the patients were determined by the attending physicians after a discussion with those patients and were not subject to a formal prescribed protocol on LT4 administration.
Yet one of the strengths of the study is that the Kuma Hospital AS study cohort includes the largest number of patients, followed for the longest period of time, in the published literature. Despite the study limitations, we found that lowering the TSH level with LT4 administration was associated with decreased PTMC growth activity. Further studies are required to elucidate the best management strategy involving LT4 for patients with low-risk PTMC.
Conclusions
We observed that reductions in serum TSH levels by LT4 administration were associated with decreased PTMC growth activity during AS. Further prospective studies are necessary to confirm these promising results and elucidate the best serum TSH target value for the prevention of PTMC progression, while avoiding unfavorable events caused by an overdose of LT4.
Footnotes
Acknowledgments
We thank Drs. Takuya Noda and Tsutomu Sano for data collection and Mr. Makoto Kawakami for his contribution to extracting the clinical data of the patients from the electronic medical record system.
Authors' Contributions
M.Y. contributed to formal analysis, investigation, writing—original draft, and visualization. A.M. was involved in conceptualization, methodology, supervision, and writing. Y.I. carried out writing—review and editing. M.F. and T.S. took charge of investigation. T.K. was in charge of software.
Author Disclosure Statement
No competing financial interests exist.
Funding Information
No funding was received for this study.