
Abstract
Background:
Alterations in DNA methylation are stable epigenetic events that can serve as clinical biomarkers. The aim of this study was to analyze methylation patterns among various follicular cell-derived thyroid neoplasms to identify disease subtypes and help understand and classify thyroid tumors.
Methods:
We employed an unsupervised machine learning method for class discovery to search for distinct methylation patterns among various thyroid neoplasms. Our algorithm was not provided with any clinical or pathological information, relying exclusively on DNA methylation data to classify samples. We analyzed 810 thyroid samples (n = 256 for discovery and n = 554 for validation), including benign and malignant tumors, as well as normal thyroid tissue.
Results:
Our unsupervised algorithm identified that samples could be classified into three subtypes based solely on their methylation profile. These methylation subtypes were strongly associated with histological diagnosis (p < 0.001) and were therefore named normal-like, follicular-like, and papillary thyroid carcinoma (PTC)-like. Follicular adenomas, follicular carcinomas, oncocytic adenomas, and oncocytic carcinomas clustered together forming the follicular-like methylation subtype. Conversely, classic papillary thyroid carcinomas (cPTC) and tall cell PTC clustered together forming the PTC-like subtype. These methylation subtypes were also strongly associated with genomic drivers: 98.7% BRAFV600E -driven cancers were PTC like, whereas 96.0% RAS-driven cancers had a follicular-like methylation pattern. Interestingly, unlike other diagnoses, follicular variant PTC (FVPTC) samples were split into two methylation clusters (follicular like and PTC like), indicating a heterogeneous group likely to be formed by two distinct diseases. FVPTC samples with a follicular-like methylation pattern were enriched for RAS mutations (36.4% vs. 8.0%; p < 0.001), whereas FVPTC- with PTC-like methylation patterns were enriched for BRAFV600E mutations (52.0% vs. 0%, Fisher exact p = 0.004) and RET fusions (16.0% vs. 0%, Fisher exact p = 0.003).
Conclusions:
Our data provide novel insights into the epigenetic alterations of thyroid tumors. Since our classification method relies on a fully unsupervised machine learning approach for subtype discovery, our results offer a robust background to support the classification of thyroid neoplasms based on methylation patterns.
Introduction
Follicular cell-derived thyroid neoplasms are the most frequent type of thyroid tumor. These tumors can be classified into benign, low-risk, and malignant neoplasms. 1 However, diagnosis can be challenging, and many lesions can only be diagnosed after surgical excision. A better comprehension of thyroid tumor genetics has provided new perspectives for the classification of thyroid neoplasms. However, fewer studies have explored epigenetic alterations such as methylation, as recently reviewed by Zafon et al. 2
Most studies evaluating the thyroid cancer DNA methylome used array-based technologies, but their conclusions were limited either by the restricted number of samples or by the underrepresentation of many histological subtypes. To date, no study has employed a robust framework to classify thyroid neoplasms based on their methylation patterns. Our study aims to analyze methylation patterns among various follicular cell-derived thyroid neoplasms and identify the existence of disease clusters that can be robust and reliably identified using methylation microarray data through unsupervised consensus clustering.
Unsupervised clustering is a powerful method to identify disease subtypes, and it has been extensively employed in cancer research. 3,4 However, clustering techniques frequently encounter evidence for clustering even in data where no real cluster exists, leading to equivocal interpretation about the existence of subtypes within a homogenous group. 5
In addition, all commonly used clustering methods, such as K-means, partitioning around medoids, or even hierarchical clustering (HC), require the researcher to, at some point, specify the number of clusters into which the data should be split. This decision is complex since the number of categories is usually unknown beforehand. Monte Carlo reference-based consensus clustering (M3C) is a recently developed approach that robustly addresses the issue of identifying the true K number of clusters. 6 M3C is a consensus clustering approach (i.e., it resamples the data multiple times to evaluate how often a pair of samples clusters together) built upon the original Monti algorithm 7 using a robust metric, the proportion of ambiguous clustering (PAC), 5 and a reference distribution. 6
In this study, we demonstrate that consensus clustering can identify distinct methylation patterns and help us understand thyroid tumor biology. We propose a novel way to classify follicular cell-derived thyroid neoplasms based on their methylome.
Methods
Search strategy and eligibility of studies
We performed a systematic search until September 2022 using the Gene Expression Omnibus (GEO) for datasets with available DNA methylation data on thyroid cancer and benign/normal thyroid tissue analyzed by array methods using the following query: (“thyroid neoplasms”[MeSH Terms] OR thyroid cancer[All Fields]) AND “Homo sapiens”[porgn] AND (“Methylation profiling by array”[Filter] OR “Methylation profiling by genome tiling array”[Filter] OR “Methylation profiling by SNP array”[Filter]).
The description for each resulting dataset was read in detail to evaluate whether it was suitable for inclusion. Datasets originating from in vitro studies or generated from blood samples were omitted. Rare histological subtypes (<5 samples in total), anaplastic thyroid carcinomas, and medullary thyroid carcinomas were not included. The histopathological diagnosis of each sample was maintained as originally described in each study. Samples labeled as goiter in the original studies are referred to as follicular nodular disease (FND) in this study. In addition, samples labeled as Hürthle adenomas or Hürthle carcinomas are referred to as oncocytic adenomas (OA) and oncocytic carcinomas (OC) in this study.
Methylation data analyses
All analyses were conducted in R version 4.1.3. Raw data were retrieved from GEO in the form of idat files using the GEOquery package. 8 Methylation data preprocessing was performed using the minfi package (version 1.40.0). 9 Data normalization was performed using single-sample Noob normalization, which is advantageous when working across array types with large datasets arriving in batches. 10 Probes were filtered out to exclude those of low quality, probes mapped to the X and Y chromosomes, probes with SNPs, and cross-reactive probes.
We inspected our data for the presence of batch effects through dimensionality reduction techniques, finding only minor batch effects present within our data. Since the datasets included in our analyses were highly unbalanced regarding tumor subtypes, batch correction retaining group differences may introduce a strong bias, deflating p-values and leading to false discoveries. 11 Therefore, we chose a more conservative approach, using our data without batch correction for all downstream analyses. For completeness, we also ran all our analyses adjusting for the study batch using the empirical Bayes method from ComBat 12 and retaining the differences between tumor subtypes. We found no important change in the results, reinforcing that batch effects were not responsible for most of the variation within our data.
Unsupervised machine learning
We employed an M3C 6 approach using the M3C package (version 1.16.0) with default parameters, unless otherwise specified. We conducted 100 Monte Carlo iterations and 100 inner replications. The optimal number of clusters (K) was defined based on two metrics: the Relative Cluster Stability Index and the Monte Carlo p-value. Consensus clustering was performed using beta-values with the largest variance, ranging from 5000 to 20,000 features included. We executed the consensus clustering algorithm using spectral clustering, which can deal with anisotropic clusters, unequal variances, and non-Gaussian shapes. 6 We employed the PAC as the objective function for M3C clustering. M3C was also used for t-distributed stochastic neighbor embedding (t-SNE) plots using default parameters.
To validate the findings encountered during the discovery phase using the M3C algorithm, we used the cluster assignment provided by M3C using 5000 features to train a classifier algorithm. This classifier was trained using the nearest shrunken centroid method available in the pamr package (version 1.56.1). From the initial 5000 features available, the final model employed 2434 features to calculate the shrunken centroid of each cluster using the 256 samples from the discovery phase.
A list with these 2434 features is provided in the Supplementary Data. Once these centroids have been calculated, the classifier works by assigning new samples to the class with the minimum distance between the sample and the shrunken centroid. No clinical or histological data were provided for the classifier model. We used our classifier to assign new samples to one of three methylation subtypes encountered during the discovery phase. These 2434 features chosen by the classifier algorithm to calculate the centroids for each cluster were also used to construct the methylation heatmap. This visualization was performed using the ComplexHeatmap (version 2.10.0) and dendextend (version 1.16.0) R packages, employing HC with Euclidean distances and Ward's linkage.
Validation in an independent dataset
Methylation data from The Cancer Genome Atlas (TCGA) 13 were retrieved as idat files from the Genomic Data Commons (GDC) Data Portal. Data preprocessing using minfi was performed in the same manner as for GEO datasets. Samples from metastatic sites or rare histological subtypes (<5 samples in total) were not included. Each TCGA sample was assigned to one of the methylation subtypes using the classifier previously trained during the discovery phase. Our classifier was unaware of the sample histological subtype. For visualization, we used the same 5000 features employed during the discovery phase to plot t-SNE for the validation phase.
For TCGA samples, additional molecular data, including BRAF, NRAS, HRAS, KRAS, and RET alterations, were retrieved from cBioPortal 14 whenever available. Genomic events affecting these genes were mutually exclusive, except for a single sample harboring both a BRAFV600E and a KRAS Q61K mutation. BRAF events were classified into three types: BRAFV600E mutations, BRAF non-V600E mutations, and BRAF fusions. Events affecting NRAS, HRAS, and KRAS were grouped together as RAS events. All RAS alterations were mutations. All RET alterations were fusions.
The genomic events affecting BRAF, RAS, and RET are detailed in the Supplementary Methods section of Supplementary Data. The frequency of genomic drivers other than those affecting BRAF, RAS, and RET was too low and did not provide sufficient statistical power to test their association with methylation clusters. Oncoprint visualizations depicting these driving genomic events were constructed using the ComplexHeatmap package (version 2.10.0). In addition, whenever TCGA samples had gene expression data available, we also retrieved the BRAFV600E -RAS-like score (BRS) for each cancer sample, as calculated in the original TCGA study. The number of TCGA samples with available mutation/fusion data and gene expression data is detailed in the Supplementary Methods section of Supplementary Data.
Differential methylation analysis
We performed differential methylation analysis (DMA) using the DMRCate package (version 2.8.5). 15 We conducted DMA to identify differentially methylated cytosine-phosphate-guanine (CpG) loci and differentially methylated regions among clusters. We adjusted p-values for multiple comparisons using the Benjamini‒Hochberg method. We set our threshold for differential methylation at a minimum beta-value difference of 0.2 and an adjusted p-value <0.05.
Gene set and pathway analysis
We conducted gene set analysis (GSA) to better understand the biological significance of differentially methylated CpG loci employing Reactome 16 gene sets for signal transduction pathways (R-HSA-162582) and diseases of signal transduction (R-HSA-5663202) with 60 to 300 genes. We conducted GSA using robust rank aggregation and overrepresentation analysis using the methylGSA package. 17
Ethics approval
This study was approved by the institutional ethics committee (Number 47605421400005327).
Results
Thyroid cancer array-based methylation studies
We identified a total of 13 studies, of which four were included: GSE121377, 18 GSE77804, 19 GSE97466, 20 and GSE197860 21 (Supplementary Fig. S1; Supplementary Table S1). One additional study from GEO (GSE53051 22 ) was identified from references and was also included in our analysis. All five datasets employed Illumina platforms, with two studies using the EPIC array and three employing the 450K array. From these five studies, we included a total of 256 thyroid samples as follows: 69 normal thyroid samples, 70 classic papillary thyroid carcinomas (cPTC), 8 tall cell PTC (tcPTC), 22 follicular thyroid carcinomas (FTC), 21 follicular variant papillary thyroid carcinomas (FVPTC), 16 OC, 16 OA, 6 noninvasive follicular thyroid neoplasms with papillary-like nuclear features (NIFTP), 16 follicular adenomas (FA), and 12 FND (Supplementary Table S1).
Determining the true number of clusters using Monte Carlo consensus clustering
We employed methylation data from these 256 samples (training set) to run the M3C clustering algorithm, which indicated the existence of three (K = 3) methylation clusters within our dataset (Supplementary Fig. S2). To evaluate whether our hypothesis of K = 3 methylation clusters was reasonable, we performed a visual inspection to assess cluster separation using t-SNE (Fig. 1), which supported K = 3 as the optimal number of clusters. Next, we assessed cluster assignment consistency by comparing the cluster assignment for a given sample as we varied the number of features employed. Regardless of whether we used 5, 10, or 20 thousand features to cluster samples into three classes, 246 out of 256 samples (96.1%) were always assigned to the same subtype, demonstrating consistent results.
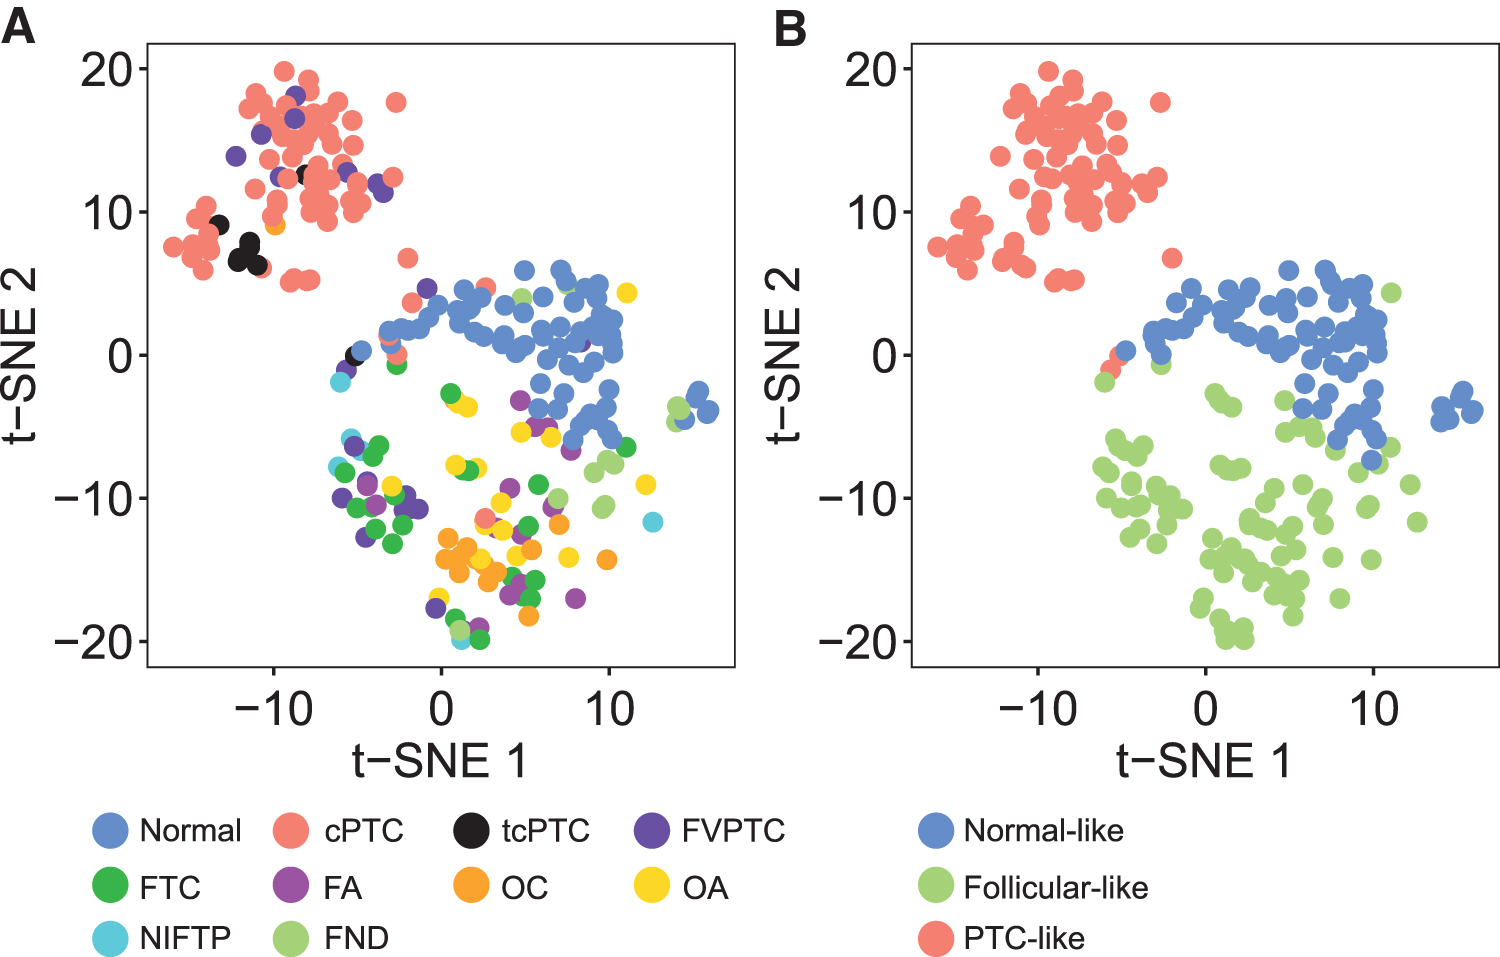
Identification of three methylation subtypes in the training set. t-SNE plots were employed to inspect cluster separation. Samples were colored (
Association between methylation clusters and histological subtypes
These three methylation subtypes were strongly associated with histological diagnosis (Fisher's exact p < 0.001) (Fig. 1). Therefore, from this point forward, we will refer to these methylation patterns as normal like, follicular like, and PTC like. Classic PTC and tcPTC were preferentially assigned to the PTC-like cluster, with 91.4% cPTC and 100% tcPTC assigned to this group (Table 1). There was also a remarkable aggregation of samples for neoplasms exhibiting follicular or oncocytic patterns. All FA and OA were assigned to the follicular-like cluster.
Cluster Assignment for Each Histological Subtype
Cluster assignment for each histological subtype based on spectral consensus clustering with the 5000 most variable beta-values. Row-wise p-values were calculated using a multinomial exact test of goodness-of-fit with the null hypothesis that each tumor subtype was equally likely to be assigned to any of the clusters.
cPTC, classic papillary thyroid carcinoma; FA, follicular adenoma; FND, follicular nodular disease; FTC, follicular thyroid carcinoma; FVPTC, follicular variant papillary thyroid carcinoma; NIFTP, noninvasive follicular thyroid neoplasm with papillary-like nuclear features; OA, oncocytic adenoma; OC, oncocytic carcinoma; PTC, papillary thyroid carcinoma; tcPTC, tall cell papillary thyroid carcinoma.
For their malignant counterparts, 100% FTC and 93.8% OC were also placed within this subtype (Table 1). It is noteworthy that, although represented in a small number, 6 out of 6 (100%) NIFTP samples were placed within the follicular-like cluster rather than in the PTC-like cluster (Table 1). Unlike all other histologic subtypes previously discussed, for which preferential clustering was evident, FVPTC did not behave as a homogeneous group, and samples were as likely to be classified as follicular like (47.6%) as they were to be classified as PTC like (42.9%) (Table 1). Accordingly, FVPTC samples did not cluster together on the t-SNE plot (Fig. 1), suggesting that this histological subtype might, in fact, represent two distinct diseases grouped as one.
For visualization purposes, we also performed a more conventional HC analysis splitting samples into K = 3 clusters (Fig. 2). As seen in the dendrogram and the associated heatmap, follicular-like samples exhibited a methylation pattern that was much closer to the normal-like than to the PTC-like pattern. HC also demonstrated that methylation subtypes were strongly associated with histological diagnosis (Fig. 2). Since the 256 samples in our training set originated from five different studies, we also inspected our results for batch effects using t-SNE plots. Although present, these batch effects were limited and did not affect cluster assignment (Supplementary Fig. S3).
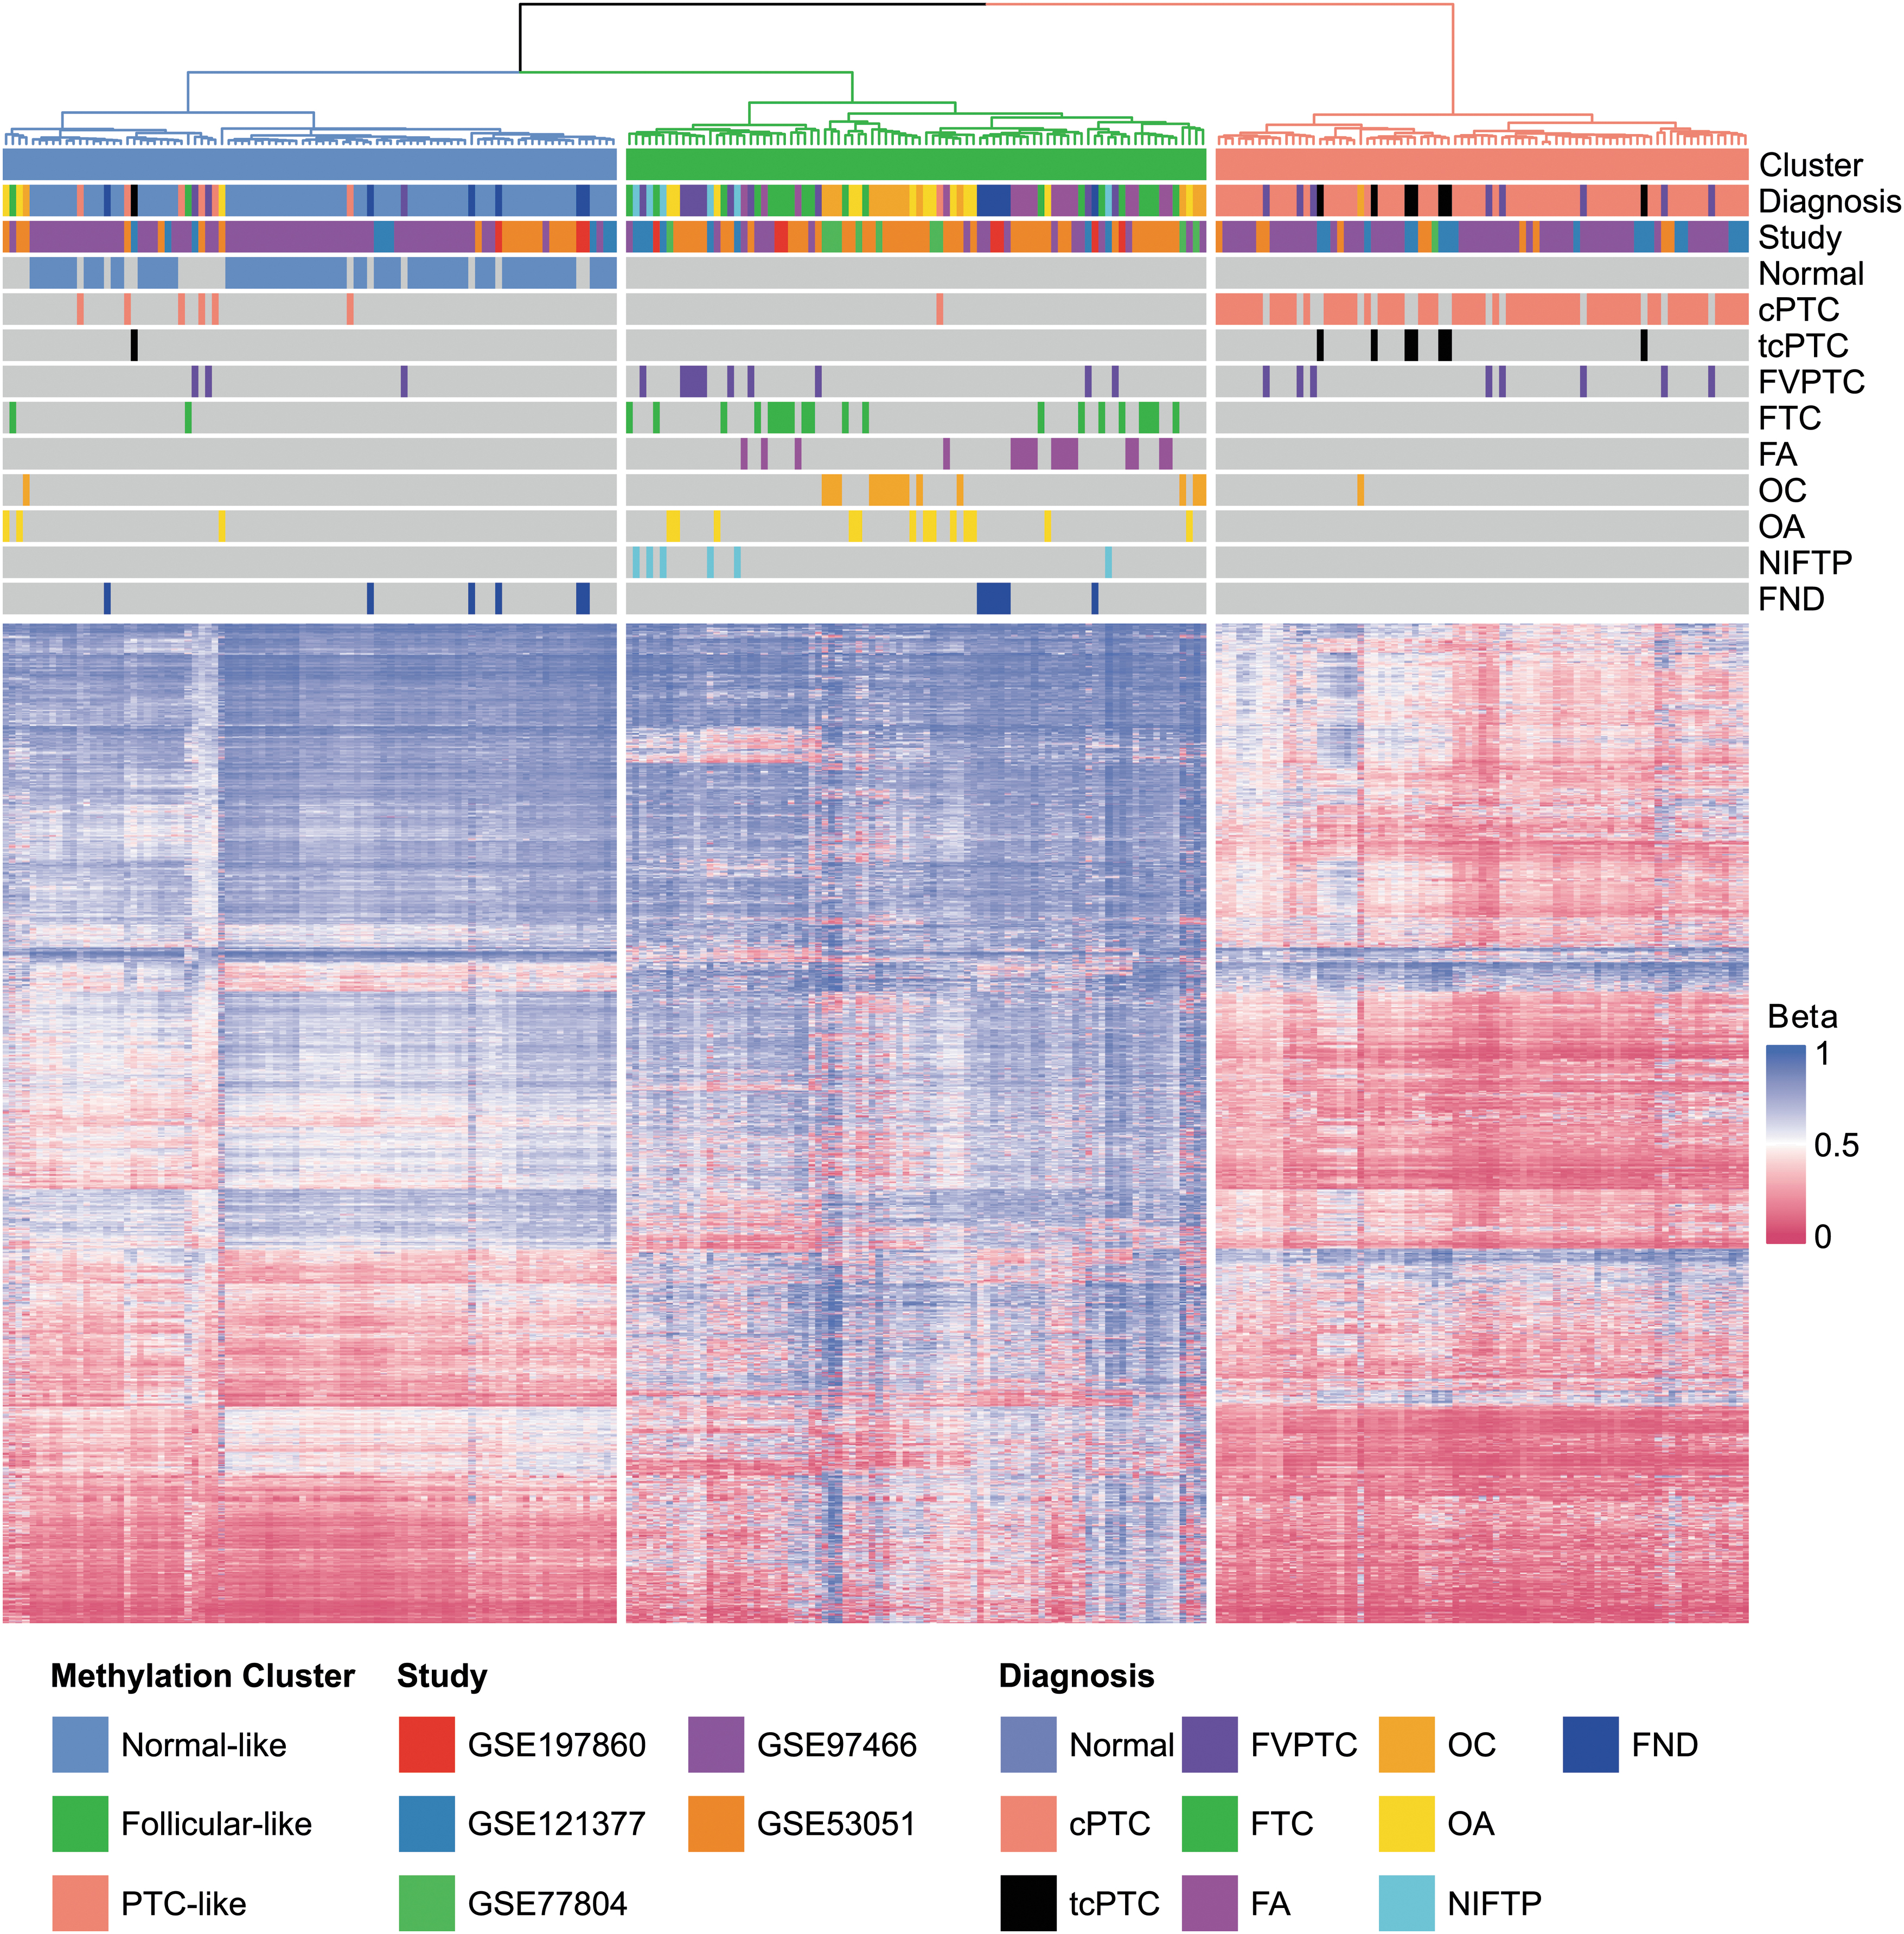
Association between methylation subtypes and histological diagnosis. HC employing the 2434 most informative probes was performed to cluster samples into K = 3 groups. Each row in the heatmap represents a single probe and each column represents a unique sample. Euclidean distances and Ward linkage were employed for clustering. HC, hierarchical clustering.
Validation using an independent dataset
We validated our findings using 554 TCGA samples as an independent external dataset (validation set). New samples were assigned to one of the three methylation subtypes exclusively based on their methylation data, without any clinical or histological information. The results were in accordance with the discovery phase, suggesting that true methylation clusters had been correctly identified (Fig. 3A, B). Our model classified 85.7% of normal thyroid tissue within the normal-like cluster. All 38 (100%) tcPTC and 83.9% cPTC were assigned to the PTC-like cluster. FVPTC were predominantly located within the follicular-like cluster (74.3%) and less frequently in the PTC-like cluster (23.8%) (Table 2).
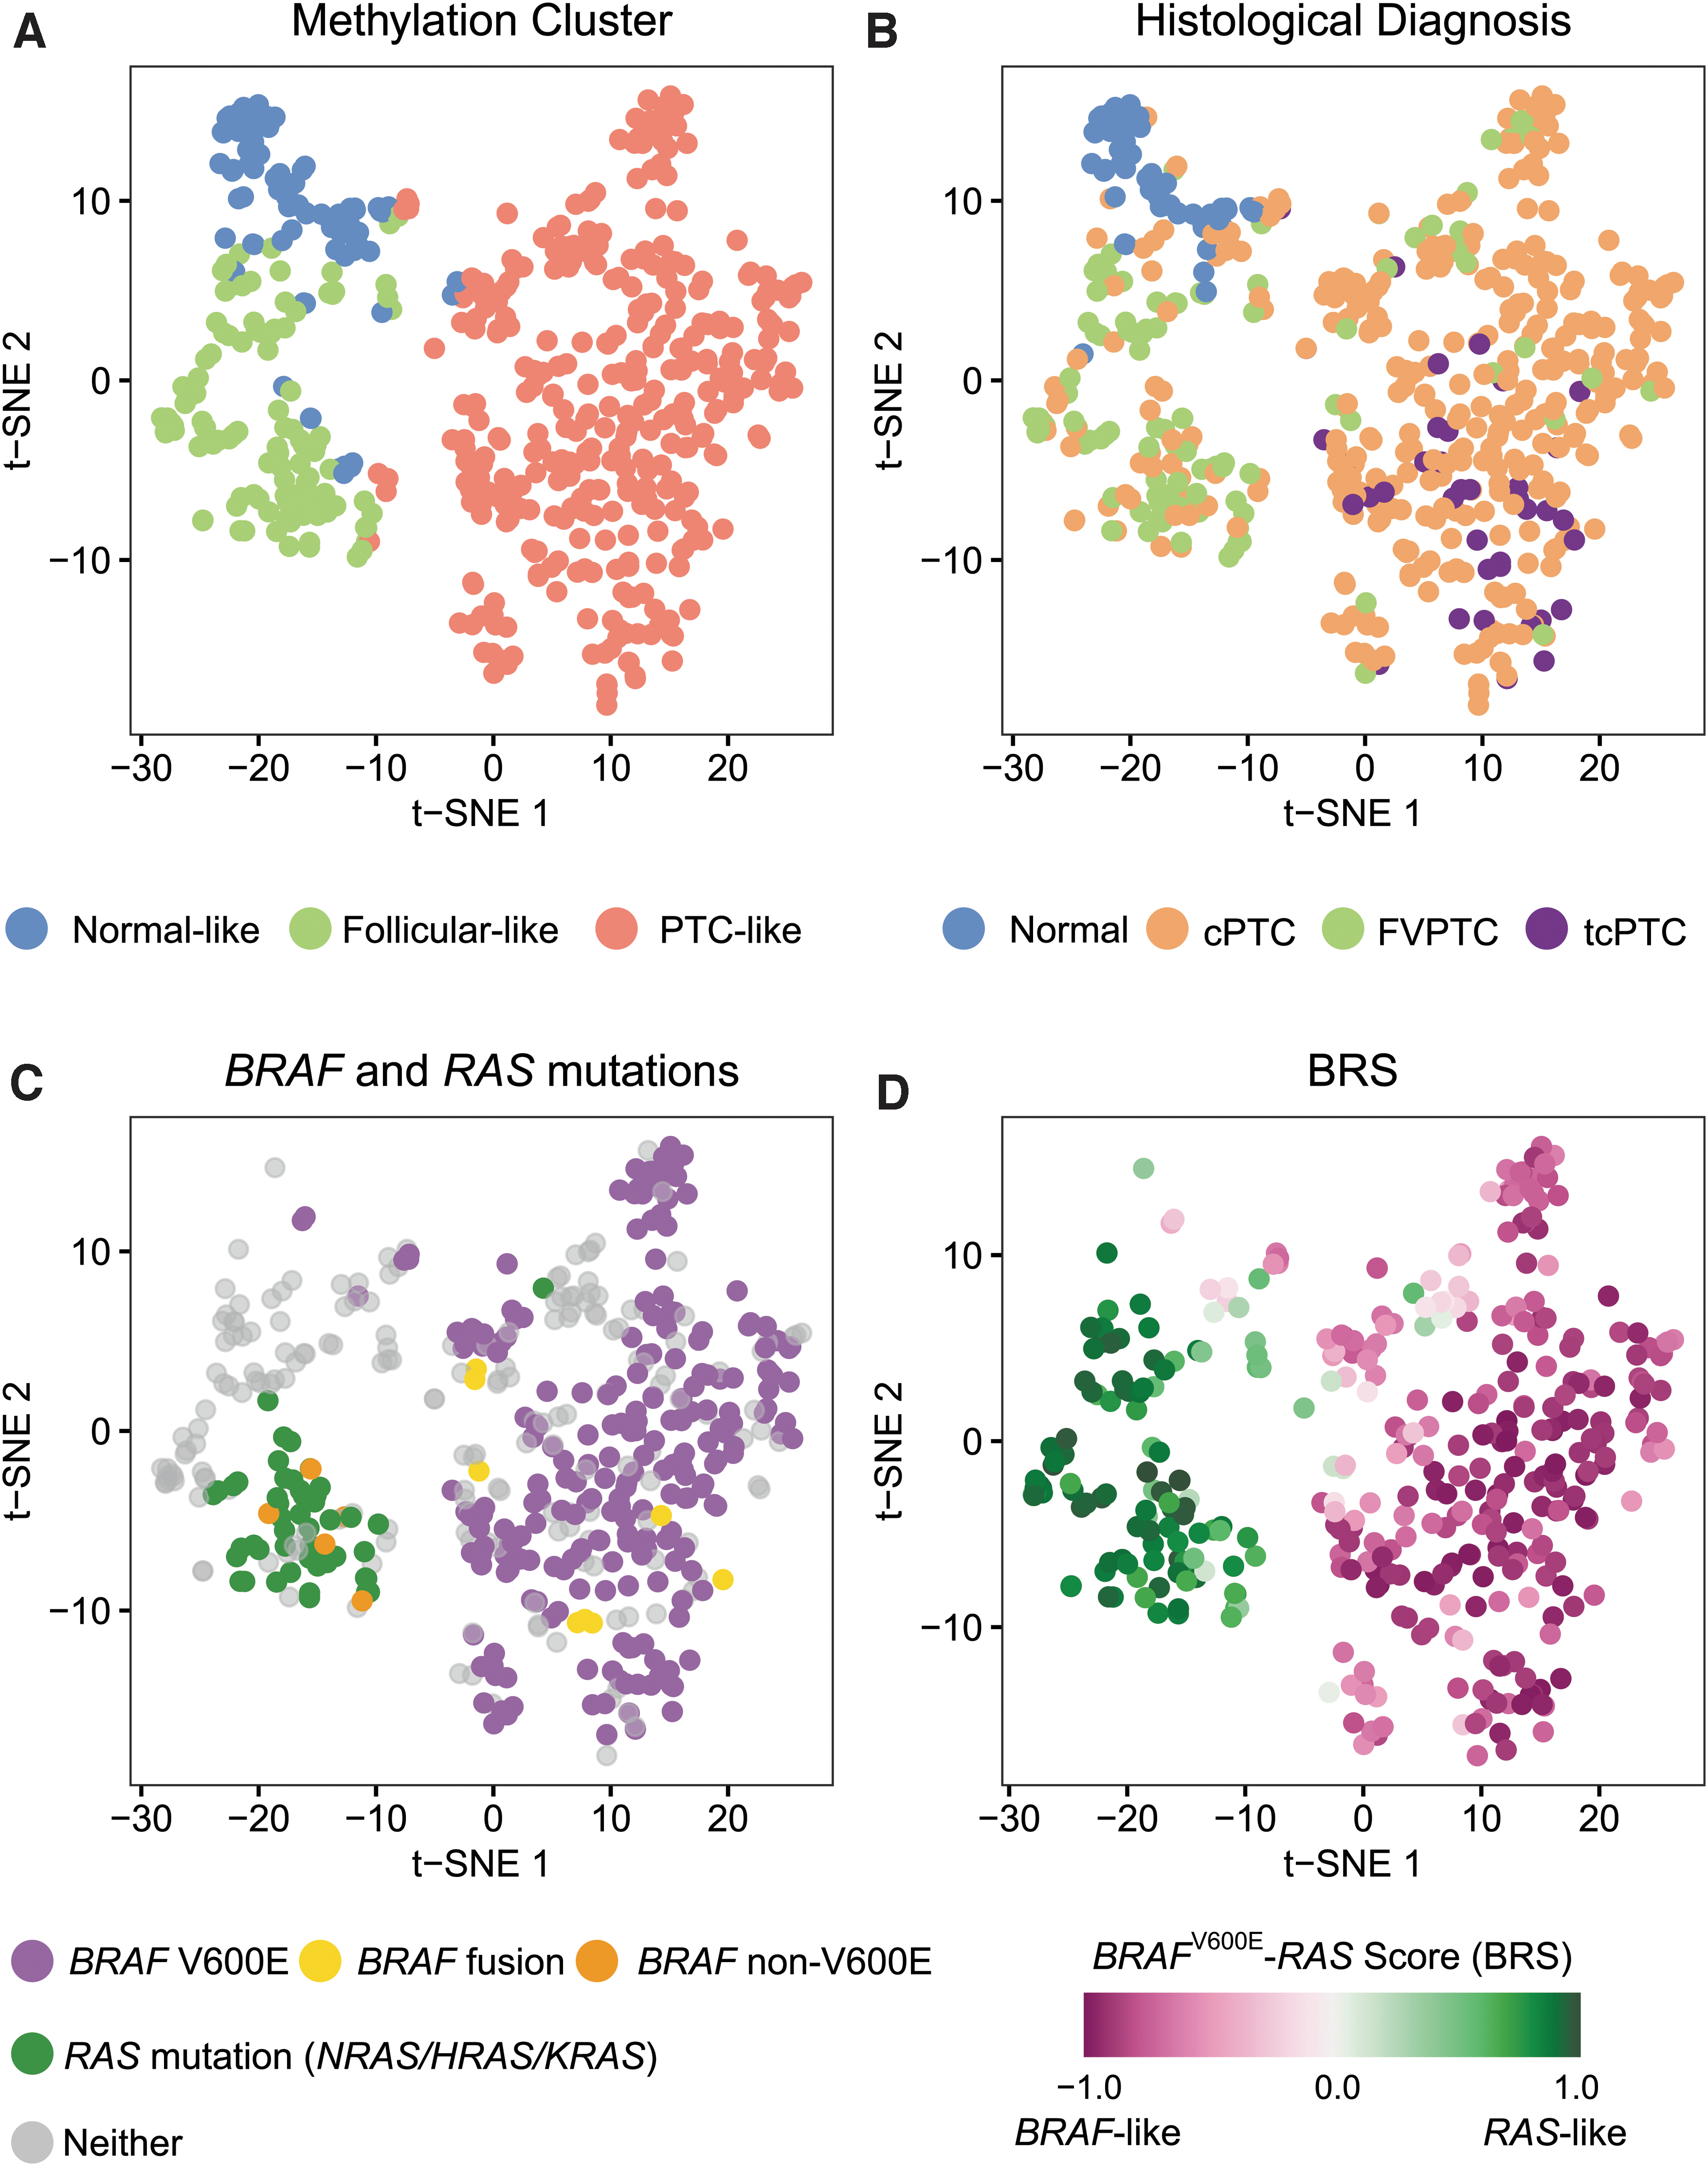
Association between methylation subtypes and oncogenic drivers. t-SNE plots were employed to inspect methylation cluster separation and its association with diagnosis and molecular markers. Samples were colored (
Cluster Assignment for The Cancer Genome Atlas Samples
Cluster assignment for each histological subtype in the TCGA dataset. Cluster assignment was performed using a classifier based on the nearest shrunken centroids calculated from the discovery dataset. Row-wise p-values were calculated using a multinomial exact test of goodness-of-fit with the null hypothesis that each tumor subtype was equally likely to be assigned to any of the clusters.
TCGA, The Cancer Genome Atlas.
Methylation subtypes are strongly associated with oncogenic drivers
For TCGA samples, additional molecular data, including DNA mutations and fusions, were also available for 489 (98.2%) tumors, which enabled additional analyses. Methylation clusters were strongly associated with genomic drivers (Fisher exact test p < 0.001) (Supplementary Table S2). Tumors harboring the BRAFV600E mutation were assigned to the PTC-like methylation cluster in 98.7% of the cases, whereas tumors harboring RAS mutations were placed within the follicular-like subtype 96.0% of the times (Fig. 3C). Interestingly, all 8 (100%) cancers harboring a BRAF fusion showed a PTC-like methylome, whereas all 5 (100%) harboring BRAF non-V600E mutations were assigned to the follicular-like methylation cluster (Fig. 3C). All 29 (100%) tumors harboring RET fusions exhibited a PTC-like methylation pattern (Supplementary Fig. S4).
For 387 (79.1%) TCGA cancer samples, messenger RNA expression data were also available. In the original study, TCGA authors employed gene expression data to derive a phenotypic score to quantitatively assess how much a given tumor resembled a BRAFV600E tumor or an RAS tumor. This measure was called the BRS and it is a continuous measure ranging from −1 (BRAFV600E -like) to +1 (RAS-like). We observed that BRS was significantly different between samples exhibiting a follicular-like and a PTC-like methylation pattern. Tumors showing a follicular-like methylome were associated with a RAS-like phenotype (median BRS = 0.87 and interquartile range = 0.73 to 0.93), whereas samples with a PTC-like methylome showed a BRAFV600E -like phenotype (median BRS = −0.81 and interquartile range = −0.91 to −0.65) (Wilcoxon p < 0.001) (Fig. 3D).
Moreover, we employed these additional molecular data (mutations, fusions, and BRS) to investigate the subgroup of patients diagnosed with FVPTC, since it was clear at this point that two distinct methylation patterns (follicular like and PTC like) could be found within this group of patients. Interestingly, we observed that follicular-like FVPTC were characterized by a higher frequency of RAS mutations (36.4% vs. 8.0%, Fisher exact p < 0.001) (Fig. 4). Conversely, PTC-like FVPTC were associated with BRAFV600E mutations (52.0% vs. 0%, Fisher exact p = 0.004) and RET fusions (16.0% vs. 0%, Fisher exact p = 0.003). Likewise, BRS was markedly different between follicular-like and PTC-like FVPTC (median BRS = 0.90 vs. −0.61, Wilcoxon p < 0.001).
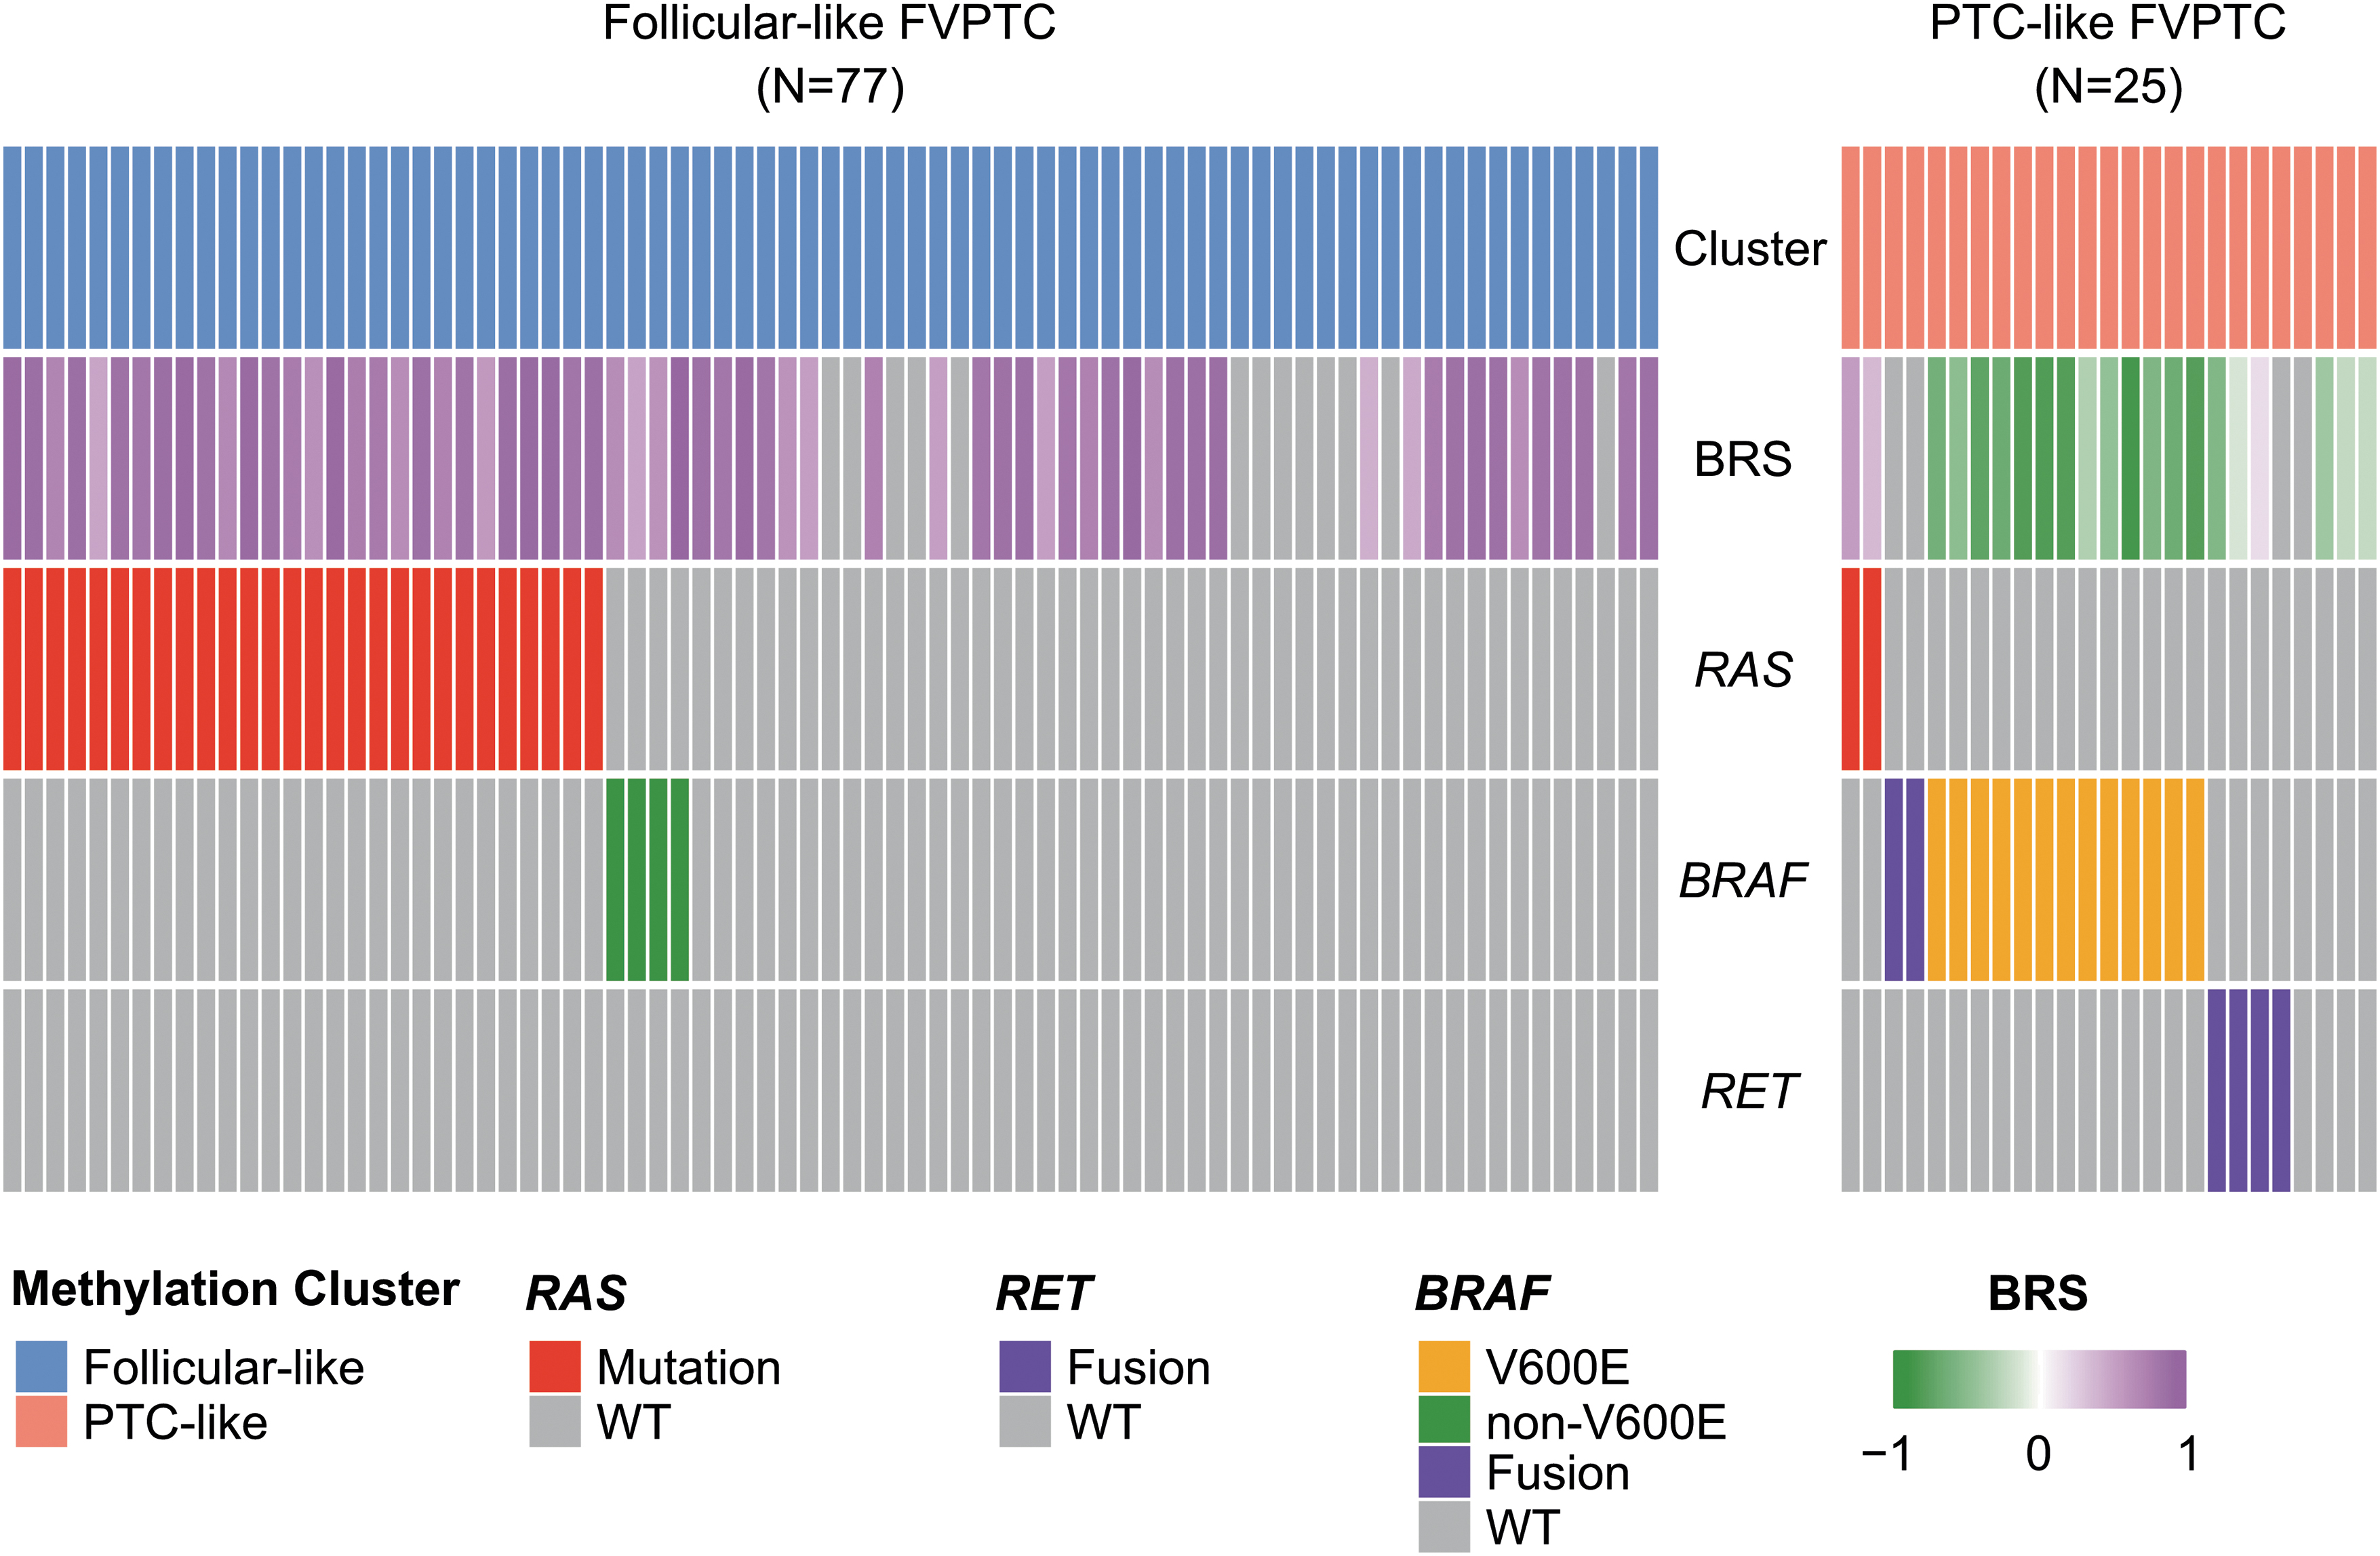
Association between methylation subtypes and oncogenic drivers in FVPTC. Oncoprint representation comparing the mutational profile of FVPTC with a follicular-like methylation pattern (left) and FVPTC with a PTC-like methylation pattern (right). Each individual column represents a single sample, and each row represents a single attribute (methylation cluster, BRS, and genes). WT, wild type.
Classic PTC with a follicular-like methylation pattern: were samples misclassified?
Although our methylation-based classifier placed 83.9% cPTC from TCGA into the PTC-like cluster (Table 2), it still assigned 12.7% of cPTC to the follicular-like methylation subtype. This made us question whether these follicular-like cPTC had been misclassified by our algorithm or if this subgroup of tumors was actually different from the remaining cPTC at a molecular level.
To answer this question, we compared DNA alterations and BRS scores between follicular-like cPTC and PTC-like cPTC. Strikingly, we observed that RAS mutations were found in 46.5% of follicular-like cPTC, whereas no RAS mutation was found in PTC-like cPTC (46.5% vs. 0%, Fisher exact p < 0.001). Conversely, no BRAFV600E mutation was seen in follicular-like cPTC, whereas 64.4% PTC-like cPTC harbored this alteration (0% vs. 64.4%, Fisher exact p < 0.001). Likewise, phenotypes were markedly different: follicular-like cPTC were RAS-like tumors, whereas PTC-like cPTC were BRAF-like tumors (median BRS = 0.78 vs. −0.73, Wilcoxon p < 0.001).
Differential methylation analysis
Next, we performed DMA to better understand the biological differences between these three clusters. Using the normal-like cluster as our reference group, we observed that follicular-like samples exhibited 1757 differentially methylated positions, of which 89.1% were hypermethylated (Table 3). These hypermethylation events occurred most frequently (39.9%) at CpG islands (Supplementary Table S3). Conversely, PTC-like samples exhibited 3241 differentially methylated sites, with a predominance of hypomethylated positions (87.5%) (Table 3). Most of these hypomethylation events (68.0%) occurred in the Open Sea (i.e., outside CpG islands) (Supplementary Table S4). The distribution of differentially methylated positions across gene regions is shown in Supplementary Tables S5 and S6.
Differentially Methylated Genomic Positions and Regions in Comparison to the Normal-Like Cluster
It is known, however, that most biologically significant differences in methylation affect genomic regions rather than isolated CpG loci. Therefore, we also conducted a DMA at the genomic region level. Once again, we observed that follicular-like samples were marked mainly by hypermethylation events, whereas PTC-like samples exhibited more hypomethylated regions (Table 3). A detailed description of these genomic regions along with a complete list of differentially methylated positions is available in the Supplementary Data. We also investigated whether the differentially methylated positions mapped to genes associated with specific signaling pathways. For PTC-like samples, we found a highly significant association with the VEGF, PI3K/AKT, and MAPK signaling pathways (adjusted p-value <0.001 for all three pathways) (Supplementary Table S7). For follicular-like samples, differentially methylated sites were associated with a greater variety of pathways, including VEGF, MAPK, NOTCH, and TGFB (adjusted p-value <0.001) (Supplementary Table S8).
Discussion
Our study offers the most comprehensive evaluation of the thyroid neoplasm methylome to date. Using an unsupervised machine-learning method, we identified the existence of three thyroid methylation subtypes: normal like, hypermethylated follicular like, and hypomethylated PTC like.
Previous studies have shown methylome dysregulation in thyroid neoplasms, mostly using array-based methods. 2 Studies focused on PTC have consistently reported that these tumors are marked by hypomethylation events, 13,20,23,24 which is consistent with our results. FTC has been far less studied, with some studies reporting hypermethylation in this disease, 20,25,26 which is in accordance with our findings.
To date, the most comprehensive study has been reported by Bisarro dos Reis et al., 20 who analyzed 141 thyroid samples of various types, including normal, benign, and cancer samples. The authors proposed the existence of methylation clusters based on unsupervised HC, a classification that partially overlaps ours. Their study, however, had a very limited number of some histological subtypes, such as FTC (n = 8), OC (n = 2), OA (n = 3), and tcPTC (n = 1). In addition, their clustering strategy did not formally address the issue of finding the true number of clusters. In the TCGA study, a methylome assessment of a large cohort of patients with thyroid cancer was also performed. 13 Nevertheless, their cancer samples were limited to PTC, offering a deep understanding of this histological subtype, but precluding more general conclusions about follicular cell-derived thyroid neoplasms as a broader group.
In this study, we show that cPTC and tcPTC have a distinct methylation pattern marked by hypomethylation events, defining the PTC-like methylation subtype. This subtype is tightly associated with BRAFV600E mutations, BRAF fusions, and RET fusions. It is also strongly correlated to the BRAFV600E -like phenotype. Conversely, samples exhibiting follicular or oncocytic histology have a pattern marked by hypermethylated sites, defining the follicular-like methylation subtype. This subtype is associated with RAS mutations, BRAF non-V600E mutations, and a, RAS-like phenotype. In addition, we demonstrate that differentially methylated positions in both PTC-like and follicular-like subtypes are associated with the MAPK signaling pathways. These findings largely support that DNA methylation alterations are orchestrated by oncogenic drivers, as it is well recognized that thyroid tumors are usually driven by the activation of the MAPK signaling pathway, leading to proliferation, angiogenesis, and migration. 1
It is noteworthy that follicular and oncocytic neoplasms were grouped irrespective of whether they were benign (FA and OA) or malignant tumors (FTC and OC), supporting the hypothesis that FA and FTC are likely to be entities within the same disease continuum. A common origin for both diseases is supported by DNA mutation analysis showing that both are characterized by RAS mutations, with FA exhibiting these mutations in 20–40% of the cases, whereas FTC present RAS mutations at a higher frequency (40–50%). 27 –29 FA and FTC also share multiple transcriptional similarities at the RNA and microRNA levels, favoring a common origin for both pathologies. 30
Interestingly, our results indicate that FVPTC does not exhibit a homogenous methylation pattern, with some tumors showing a follicular-like methylation pattern and others a PTC-like pattern. This suggests that this histological subtype might be a heterogeneous group formed by two different diseases, rather than a tumor subtype itself. Follicular-like FVPTC are enriched for RAS mutations and they are strongly associated with an RAS-like phenotype. Conversely, a fraction of FVPTC has a PTC-like methylome, suggesting that they are truly related to PTC. These PTC-like FVPTC are enriched for BRAFV600E mutations and RET fusions and their expression phenotype is BRAFV600E like. This dual behavior of FVPTC has been observed in other studies and is now recognized in the 2022 World Health Organization (WHO) classification of thyroid neoplasms. 1,31
Encapsulated FVPTC are RAS-like tumors, just like FTC, whereas infiltrative follicular variant PTC (ifvPTC) are BRAF-like tumors, just like cPTC. 1,31,32 In the 2022 WHO classification, FVPTC have been reclassified in a novel manner. ifvPTC are still recognized as a subtype of PTC, as they share the same genetic alterations seen in cPTC. On the other hand, invasive encapsulated follicular variant PTC (IEFVPTC) is now considered a separate cancer type, rather than a subtype of PTC, since IEFPTV are RAS-like tumors. 1,31 Our results largely confirm this distinction between BRAF-like and RAS-like FVPTC. In fact, from a methylation perspective, it is unclear whether RAS-like FVPTC (i.e., IEFVPTC) are actually different from FTC in any way. The TCGA authors also discuss the classification of FVPTC and suggest that these tumors be classified alongside FTC, since they are marked by RAS mutations and arm-level genetic alterations. 13
Our study has some limitations that must be recognized. Our results were derived from samples collected from different cohorts of patients, processed differently, and assessed using two distinct methylation arrays (450K and EPIC). This concern is diminished, given that we could reproduce our results in a large independent cohort of patients not used during the discovery phase. It is also greatly diminished, given that our methylation subtypes were found to tightly correlate with genomic drivers and BRAFV600E -RAS-like phenotypes. Our study does not provide information about less frequent histological subtypes since they were not sufficiently represented within our dataset. In addition, we depended on the histological diagnosis given for each sample in the original study, which might be inaccurate, given the recent changes proposed in the 2022 WHO classification of thyroid neoplasms. 1
In conclusion, our data provide broad insights into the major epigenetic alterations present within thyroid tumors. Using a fully unsupervised machine learning method for subtype discovery, our results offer a robust background to support the classification of thyroid neoplasms based on methylation patterns that, hinged on genomic data, could refine personalized management of thyroid neoplasms. Accurately classifying these lesions into epigenetic groups might highlight singularities regarding tumor aggressiveness and drug resistance and dictate the development of precise epigenetic pharmaceuticals targeting the epigenome as viable therapeutic options.
Footnotes
Acknowledgments
The results published herein are, in whole or part, based upon data generated in previous studies, including the TCGA study and studies deposited in GEO. The authors thank the patients who participated in the studies. We also thank all personnel involved in these projects for their vast contributions. This article was previously deposited on the preprint server medRxiv (
Authors' Contributions
V.R.M.: Conceptualization, methodology, formal analysis, investigation, data curation, writing-original draft, and visualization. M.R.M.: Methodology, formal analysis, and data curation. A.L.M.: Investigation and writing-review and editing. I.M.G.: Conceptualization, methodology, investigation, writing-review and editing, supervision, and project administration. All authors read and approved the final article.
Data Availability
All data used in our study are publicly available at GEO, GDC Data Portal, or cBioPortal. All R packages employed in our study are also freely available at CRAN or Bioconductor.
Ethics Approval Statement
This study was approved by the institutional ethics committee.
Author Disclosure Statement
V.R.M., M.R.M., A.L.M., and I.M.G. declare no competing interests concerning the work described.
Funding Information
This study was financed, in part, by the Coordenação de Aperfeiçoamento de Pessoal de Nível Superior—Brasil (CAPES)—Finance Code 001. This work received financial support from Hospital de Clínicas de Porto Alegre (HCPA) through Fundo de Incentivo à Pesquisa (FIPE). This work received financial support from Conselho Nacional de Desenvolvimento Científico e Tecnológico (CNPq/AWS; Nos. 032/2019, 440005/2020-5). V.R.M. received a PhD scholarship from Coordenação de Aperfeiçoamento de Pessoal de Nível Superior (CAPES) (88887.354162/2019-00 and 88887.703135/2022-00). A.L.M. is a recipient of scholarship (No. 316323/2021-7) and research grants (No. 408344/2021-0) from the Conselho Nacional de Desenvolvimento Científico e Tecnológico (CNPq), and Programa de Apoio a Núcleos de Excelência/Fundação de Amparo à Pesquisa do Estado do Rio Grande do Sul (PRONEX/FAPERGS; No. 16/2551-0000486-2). The funder had no role in the design of the study; the collection, analysis, and interpretation of data; the writing of the article; or the decision to submit the article for publication.
Supplementary Material
Supplementary Data