
Abstract
Background:
Increased height has been associated with increased risk of hypothyroidism or thyroid cancer in epidemiological studies. However, the potential causal association between height and hypothyroidism or thyroid cancer has not been thoroughly explored. Autoimmune thyroid disease (AITD) mainly presents as hypothyroidism, thus we aim to evaluate the causal relationship between height as exposure and its association with AITD or thyroid cancer.
Methods:
Mendelian randomization (MR) analyses were performed by using genetic instruments associated with height, which were selected from the largest genome-wide association meta-analysis for height in up to 5.4 million individuals. Summary-level data for AITD and thyroid cancer (including 30,234 and 3001 cases, respectively) were collected from the large number of available genome-wide association studies. Bidirectional MR was performed to test for reverse causal association between AITD and adult height.
Results:
MR analyses showed that increased genetically predicted height was associated with a 4% increased risk of AITD ([CI 1.02 to 1.07], p-value = 1.99E-03) per 1-standard deviation (SD) increase in genetically predicted height. The bidirectional MR did not show any causal association between AITD and adult height. Additionally, increased genetically predicted height was associated with 15% increased risk of thyroid cancer ([CI 1.07 to 1.23], p-value = 2.32E-04) per 1-SD increase in height. Sensitivity analysis confirmed the main results.
Conclusions:
This MR study showed that 1-SD increase in genetically predicted height was associated with increased risk of AITD and thyroid cancer. In contrast, there was no evidence of a causal association of genetically predicted AITD with height. These results could further aid in investigation of height-related pathways as a means of gaining new mechanistic insights into AITD and thyroid cancer.
Introduction
The relationship between standing height and autoimmune thyroid disease (AITD) remains poorly understood and the underlying mechanisms behind these interactions remain unclear. The population-wide prevalence of AITD is around 5%, which is the highest prevalence of autoimmune diseases and mainly presents as hypothyroidism, and the vast majority of hypothyroidism cases result from autoimmunity. 1 Recently, a phenome-wide association study (PheWAS) of height revealed that genetically predicted height was robustly associated with increased risk of hypothyroidism in European American individuals. 2
Hypothyroidism is observed when a reduction of thyroid hormones (thyroxine and triiodothyronine) results in increased levels of thyrotropin. If hypothyroidism is left untreated, it can, among other issues, cause cardiac problems, with patients manifesting musculoskeletal, neurological, and psychological symptoms, alongside infertility in females. In habitats with iodine sufficiency, Hashimoto's autoimmune disease is the most common cause of hypothyroidism.
The manifestation of hypothyroidism is contingent on genetic, environmental, and nonmodifiable factors. 3 Disease prevalence varies depending on sex, with females being 10 times at higher risk than males. 3,4 Hypothyroidism differentiates according to geographical region and type; clinical or subclinical. The National Health and Nutrition Examination Survey (NHANES III) in the United States showed prevalence rates of 0.3% and 4.2%, respectively, for clinical and subclinical hypothyroidism. 5 Similar prevalence was reported in an European meta-analysis. 6 Hypothyroidism is also a known risk factor for growth retardation. 7
A meta-analysis from 2015 showed that increased measured height is associated with increased risk of thyroid cancer. 8 The aforementioned PheWAS in European Americans supported these findings; increased measured height was associated with increased risk of thyroid cancer; however, the association was not robust with regard to multiple testing correction. 2 Thyroid cancer is the most common malignancy of the endocrine system and has several subtypes characterized by different severity and frequency. Multiple factors are responsible for thyroid cancer manifestation, including genetic and environmental factors. 9
Recently, the largest meta-analysis of genome-wide association studies (GWASs) for standing height in over 5.4 million individuals reported 12,111 independently associated markers at genome-wide significance levels, 10 which allowed us to undertake a well-powered Mendelian randomization (MR) study to assess the causal role of adult height in the risk of AITD or thyroid cancer. Additionally, to examine reverse causation, we explored the role of AITD in height.
Materials and Methods
Assumptions of MR and study design overview
MR employs instrumental variables to evaluate if there is causal association of exposure with an outcome. To perform an MR analysis, three basic assumptions should be met: (1) the single-nucleotide polymorphisms (SNPs) employed as instrumental variables are strongly associated with exposure; (2) instrumental variables are not associated with any confounders; and (3) instrumental variables are associated with the outcome only through the exposure.
The advantage of this method is that it mimics randomization of confounders in randomized clinical trials since the genetic variants are assigned randomly at conception, avoiding the cost of clinical trials and employing statistical analyses using only summary-level data. As a result, this method is more robust regarding confounding, either by environmental or lifestyle factors, and reverse causality. 11
The main analyses presented in this study evaluate the causal association between adult height, AITD, and thyroid cancer. Additionally, we assessed whether genetic predisposition to AITD is causally associated with final height acquisition. Sensitivity analyses excluded instrumental variables associated with the outcome at p-value <1E-02 to exclude any pleiotropic variants associated with both the exposure and outcome.
Instrumental variable selection
We employed 12,111 genetic variants associated with height from the latest cross-ancestry meta-analysis, which account for 40% of phenotypic variance. 10 For the bidirectional association of AITD with height, we assessed the effect of 94 genetic variants associated with AITD. 1 The estimates for height-associated variants were extracted from the GWAS by Yengo et al. (2022). 10 Proxies from the study by Yengo et al. (2018) 12 were used for the AITD SNPs, using 50,000 unrelated and randomly sampled European participants of UK Biobank as the linkage disequilibrium reference panel, with r 2 = 0.8 and a 250-kb window.
Lists with the genetic variants used as instruments are included in Supplementary Tables S1–S3.
Summary statistics and study population
The present MR study includes summary-level data from (1) the Genetic Investigation of ANthropometric Traits (GIANT) consortium and 23andMe, using up to 5.4 million individuals (76% had European ancestry) for height 10 ; (2) the Iceland and UK Biobank for AITD (30,234 cases and 725,172 controls, all European ancestry) 1 ; and (3) five cohorts of thyroid cancer (up to 3001 cases and 287,550 controls, all European ancestry). 13
Two-sample MR
We performed two-sample MR employing genetic instruments from the GWAS summary data, as described above. TwoSampleMR 14 and MR Pleiotropy RESidual Sum and Outlier (MR-PRESSO) 15 packages in R were implemented for the present analyses. An efficient and robust way to estimate the causal effect of the exposure on the outcome is by using a single genetic variant in the ratio method.
GWAS provides plenty of SNPs to be used as genetic instruments for MR analyses, thus individual ratio estimates for each SNP can be incorporated into one more powerful estimate. This is called the inverse variance-weighted (IVW) method and it calculates the weighted mean of individual ratio estimates, where the weights equal the inverse variances of the ratio estimates. 16 This method is unbiased only when all genetic variants are valid instrumental variables (IVs), an assumption that is difficult to hold given the plethora of genetic instruments that are available from the GWAS.
Therefore, we evaluate more methods as sensitivity analyses, even though their power to detect a causal effect is lower. One of them is the weighted median (WM) method, which uses the WM of the individual ratio estimates, offering an unbiased causal estimate when at least half of the information comes from valid genetic variants. 17 MR-Egger is a method that acknowledges that some of the IVs are invalid and thus aims to predict the causal estimate by incorporating them.
To this end, MR-Egger employs the IVW method with one key addition of an intercept term, which is tested for average directional pleiotropic effect. The assumption that MR-Egger needs to fulfill (to provide an unbiased causal estimate) is the Instrument Strength Independent of Direct Effect (InSIDE), which is a weaker assumption that substitutes the third assumption of MR. For the InSIDE assumption to be fulfilled, any pleiotropic effects of genetic variants need to be independent of genetic variant exposure association. 18
Finally, the MR-PRESSO test is an outlier detection method that provides a causal estimate after outlier removal. Briefly, after applying the IVW method using all genetic variants, in turn (one by one), the genetic variants are omitted from the analyses. Then, the residual sum of squares is calculated, and if it is substantially reduced in comparison with the expected distribution, then the genetic variant is excluded. This process is repeated until none of the remaining genetic variants are considered as outliers. After outlier removal, the IVW method is applied to estimate the causal effect. 15
Bidirectional MR
Bidirectional MR was employed to test the reverse causal direction. The aim of this analysis is to examine if genetic predisposition to AITD could affect adult height.
The Institutional Review Board approval (or waiver) statement was as follows: this study utilized summary statistics data and no individual-level data were involved; ethical approval was not required.
Results
Height and AITD
MR analyses suggest that 1-standard deviation (SD) increase in genetically predicted height was associated with an increased risk of AITD (odds ratio [OR] = 1.04, [95% confidence interval {CI} 1.02 to 1.07], p-value = 1.99E-03, IVW). This was supported by both WM and MR-Egger ([CI 1.02 to 1.10], p-value = 1.46E-03, and [CI 1.06 to 1.15], p-value = 7.35E-06, respectively) (Fig. 1). The Egger intercept was close to zero (β 0 = −0.0008), but we cannot completely rule out the presence of directional horizontal pleiotropy (p-value = 1.03E-03; Supplementary Fig. S1). Results from all MR methods are included in Supplementary Table S4.
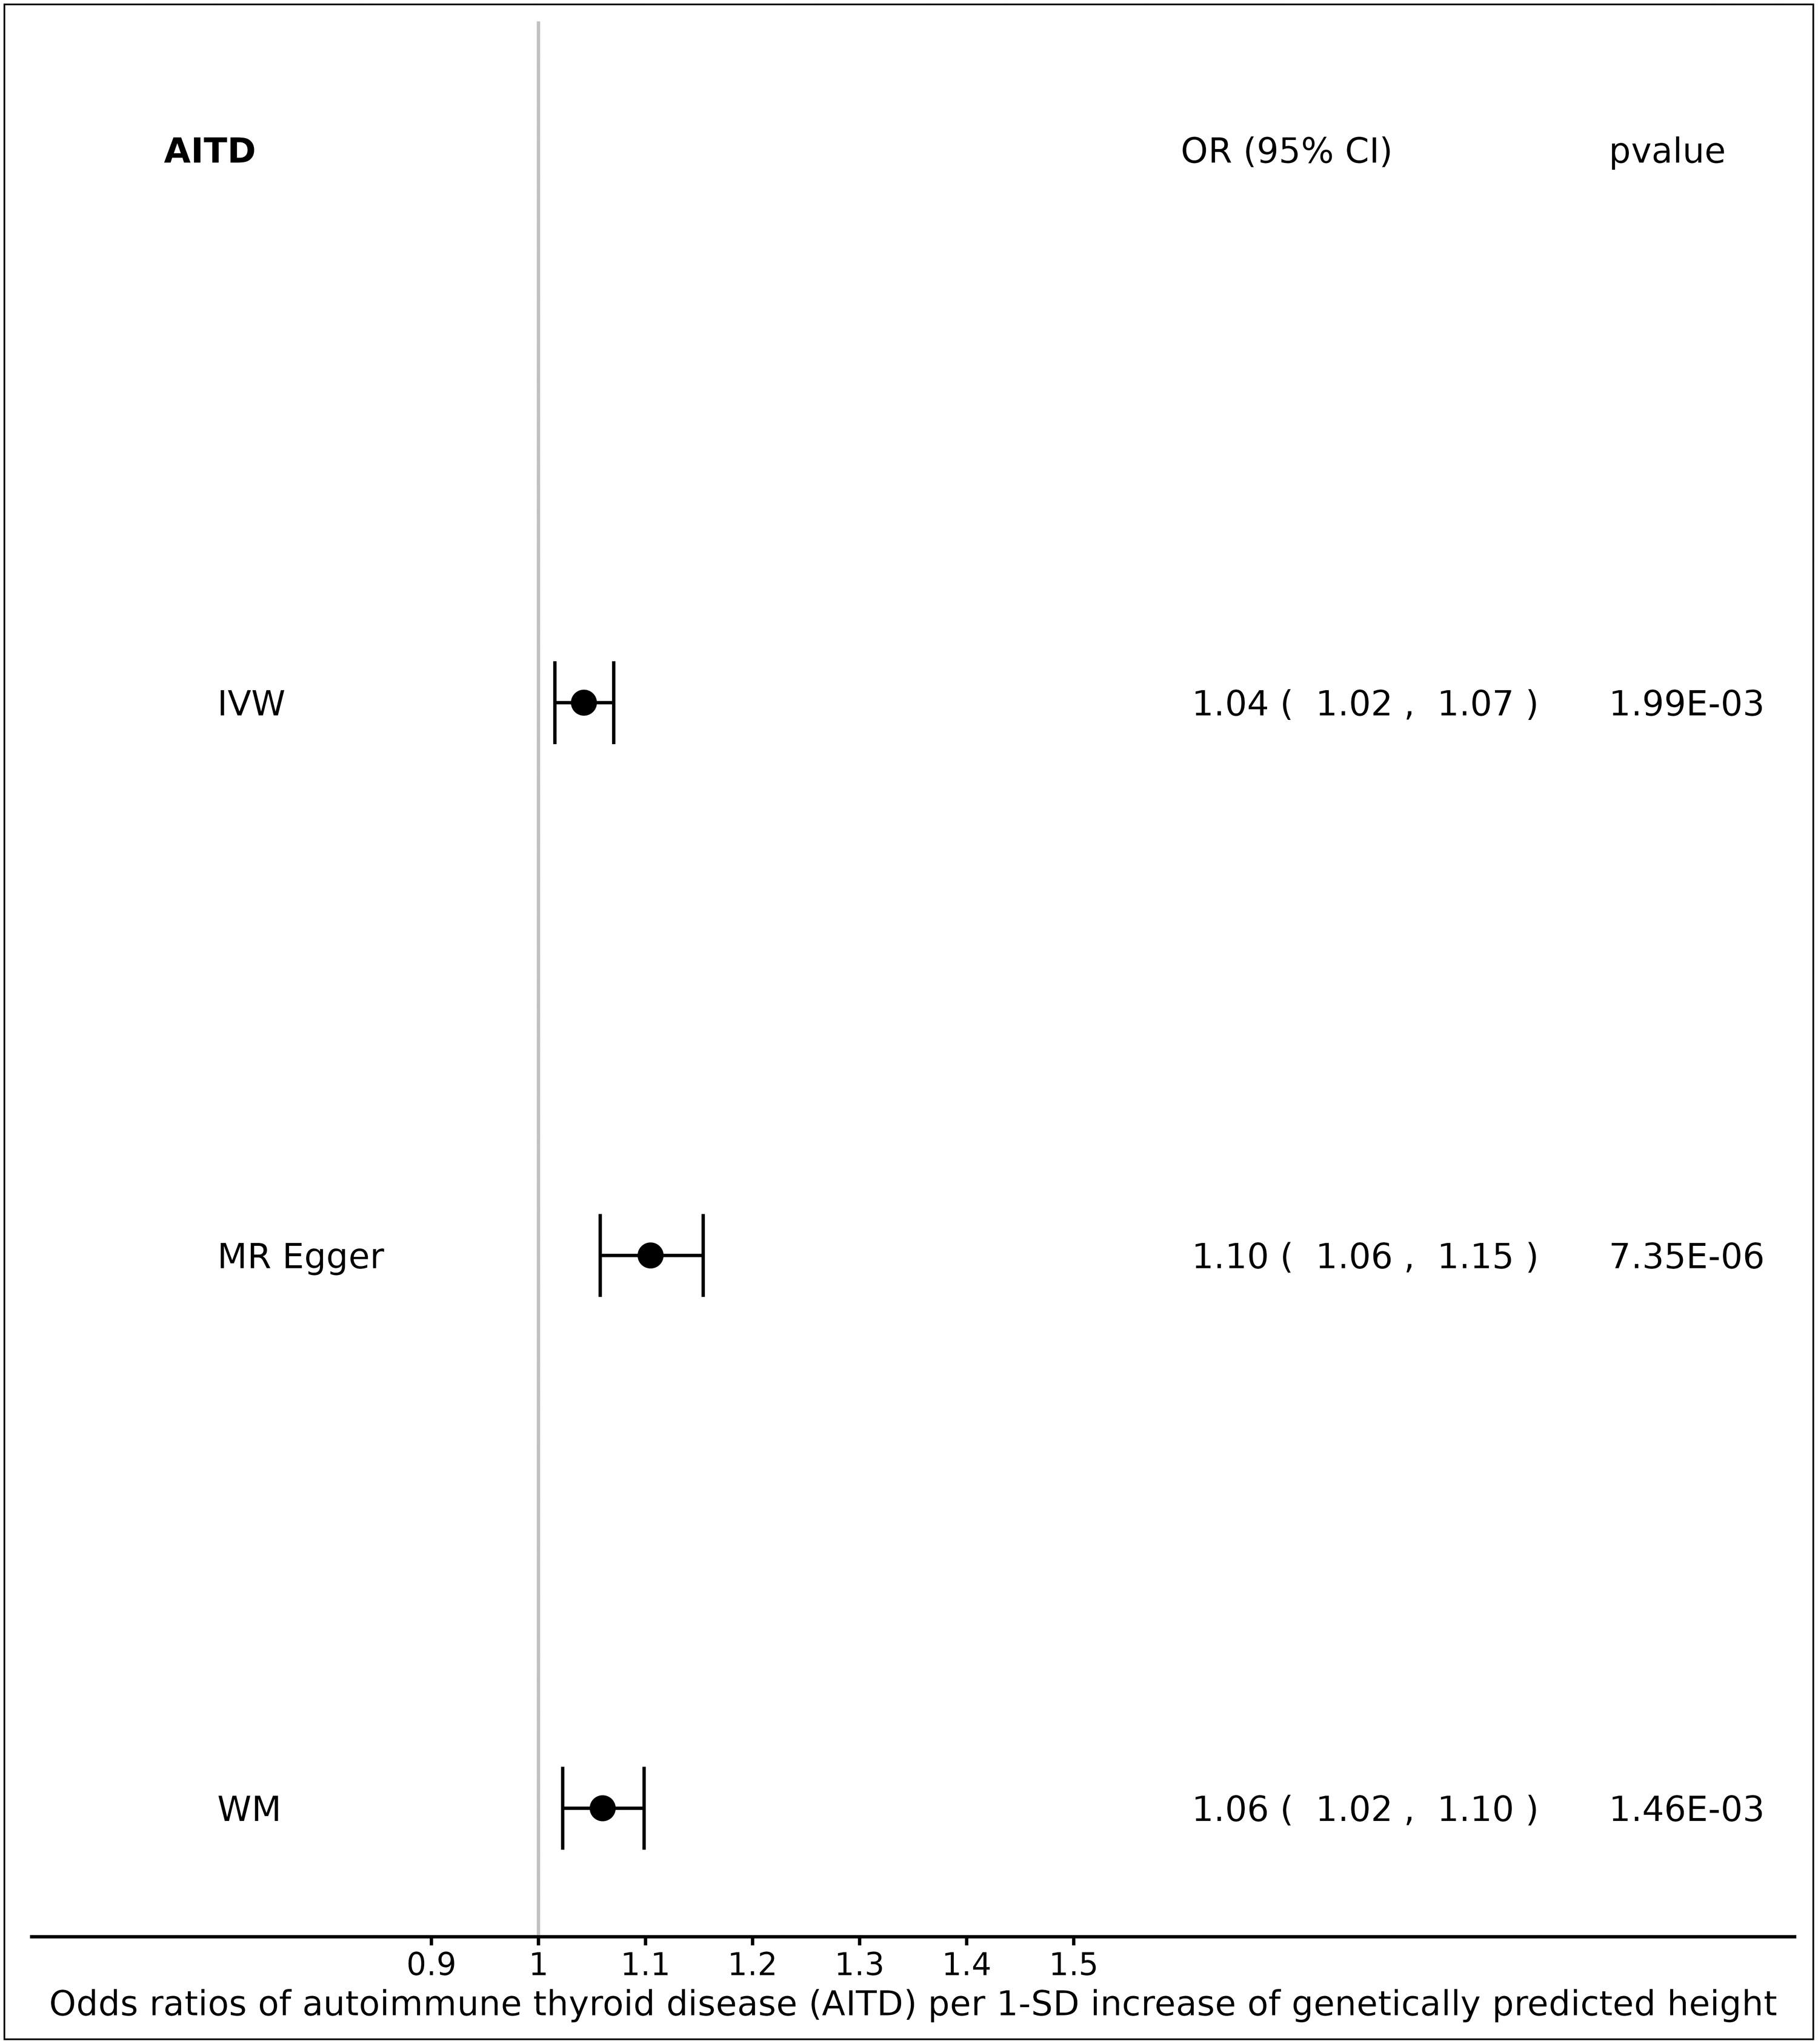
Forest plot: ORs for the effect of genetically predicted height on AITD risk. AITD, autoimmune thyroid disease; CI, confidence interval; IVW, inverse variance-weighted; MR, Mendelian randomization; OR, odds ratio; SD, standard deviation; WM, weighted median.
We further performed a sensitivity analysis, excluding instrumental variables associated with the outcome at a p-value <1E-02, to better honor the third MR assumption that genetic variables should influence the outcome only through the exposure. MR analyses with the IVW method suggested only a minor reduction in the effect in comparison with the main analysis, with the signal remaining statistically significant; increased levels of genetically predicted height were associated with an increased risk of AITD (OR = 1.03 [CI 1.014 to 1.05], p-value = 7.84E-03). This was supported by WM and MR-Egger (Supplementary Fig. S2; Supplementary Tables S4 and S5).
Bidirectional MR
We employed bidirectional MR to test the possibility of reverse causation and examine whether genetically predicted AITD has an effect on adult height. MR analyses showed no evidence that genetic predisposition to AITD is associated with adult height (β = −0.009 [CI −0.025 to 0.006], p-value = 2.38E-01, IVW). The global MR-PRESSO test provided a statistically significant p-value <5E-04, indicating the presence of horizontal pleiotropy. The outlier test identified some of the instrumental variables as outliers and excluded them. However, the distortion test was not significant (p-value = 1.21E-01) (Supplementary Fig. S3). Results from all MR methods are included in Supplementary Table S6.
We also performed bidirectional MR analyses after excluding variants associated with height at a p-value <1E-02, which also showed that there was no evidence of causal association between AITD and adult height (β = −0.003 [CI −0.010 to 0.004], p-value = 4.00E-01, IVW). The global MR-PRESSO test was not statistically significant (p-value = 6.60E-02), indicating that there was no evidence of horizontal pleiotropy (Supplementary Fig. S4). Results from all MR methods are included in Supplementary Table S7.
Height and thyroid cancer
MR analyses suggested that 1-SD increase in genetically predicted height was associated with an increased risk of thyroid cancer (OR = 1.15 [CI 1.07 to 1.23], p-value = 2.32E-04, IVW). WM detected a higher statistically significant risk ([CI 1.09 to 1.41], p-value = 1.13E-03), compared with the IVW method, and had the same direction (Fig. 2). MR-Egger confirmed the trend of increased risk of thyroid cancer; however, the signal was not statistically significant. Furthermore, MR-Egger did not yield evidence of pleiotropy ([CI 0.97 to 1.24], p-value = 3.72E-01) (Supplementary Fig. S5). Results from all MR methods are included in Supplementary Table S8.

Forest plot: ORs for the effect of genetically predicted height on thyroid cancer risk.
We further performed sensitivity analyses excluding instrumental variables associated with the outcome at p-value <1E-02. MR analyses with the IVW method showed that the effect, although attenuated, remained significant; increased levels of genetically predicted height were associated with an increased risk of thyroid cancer (OR = 1.12 [CI 1.05 to 1.20], p-value = 1.28E-03, IVW). WM detected a greater statistically significant risk than the IVW method, having the same direction. MR-Egger estimated an increased risk of thyroid cancer as well, however, not statistically significant ([CI 0.95 to 1.19], p-value = 2.77E-01) (Supplementary Fig. S6).
The p-value for the MR-Egger pleiotropy test was not statistically significant, indicating no evidence of pleiotropy (p-value = 2.84E-01). Results from all MR methods are included in Supplementary Table S9.
Discussion
In this study, we used the most up-to-date list of genetic variants associated with adult height and large, available, summary statistics data for AITD and thyroid cancer to evaluate through MR the potential causal associations between adult height, AITD, and thyroid cancer. We showed that increased genetically predicted height was significantly associated with both AITD and thyroid cancer, whereas there was no evidence for a reverse effect of AITD on height. These relationships remained statistically significant in the sensitivity analyses, where genetic variants associated with the outcome at a p-value <1E-02 were excluded from the list of instrumental variables.
Our study indicates a causal association between adult height and AITD. The latest PheWAS of height revealed that measured height was robustly associated with increased risk of hypothyroidism in European American individuals (OR = 1.04, p-value = 2.01E-06). 2 The same study reported that increased genetically predicted height, using 3290 SNPs from an earlier GIANT meta-analysis in Europeans, 12 was associated with hypothyroidism, but this association was not statistically significant after multiple correction (OR = 1.05, p-value = 3.76E-03). 2
Our findings are in agreement with the results of the PheWAS mentioned here for height. In the present study, we use fourfold genetic variants for height, which were derived from a cross-ancestry population, 10 making it possible to present evidence for a causal relationship through the employed MR methods.
Children who present growth retardation should be examined regarding their thyroid hormone levels, as untreated hypothyroidism is a known risk factor for short stature. Therefore, exogenous replacement of thyroid hormones has been proposed to help children reach their predicted stature in adulthood, along with skeletal maturation, supporting the essential role of thyroid hormones in human development. 19 Although most of the children who receive thyroid hormone replacement reach their predicted height, there have been recorded cases who did not, underlying mechanisms that are connected to the duration and severity of hypothyroidism before diagnosis. 19,20
However, an observational study in Italy showed that the age when the thyroid hormone treatment is started did not have any role in the attainment of final height. 21 In our analyses, the bidirectional MR showed no association of AITD with adult height; this result could be attributed to the fact that the GWAS used for AITD was performed in individuals who acquired AITD during adult life since congenital hypothyroidism has been associated with growth retardation.
Adult height has also been associated with increased risk of several cancers, including thyroid cancer; however, the association did not survive multiple testing correction in the latest height PheWAS. 2 Additionally, a recent meta-analysis of observational studies reported that a 5-cm increase in adult height increased the risk of thyroid cancer by 13% and 18% in males and females, respectively. 8 The biological pathways underlying this effect are not fully elucidated. One possible explanation of the effect of height in thyroid carcinoma could be the role of insulin-like growth factor-1 (IGF-1).
A recent systematic review of thyroid nodular disease endorsed the finding seen in many studies that the molecular pathway of IGF-1 is upregulated in thyroid carcinoma compared with benign nodes. 22 This is also true for other types of cancers besides thyroid, including colorectal, breast, and prostate cancers. 23 Increased IGF-1 levels could induce mutations in various cell lines, including thyroid cells, and contribute to the increase in cancer cases by stimulating cell proliferation, adhesion, and migration and by inhibiting apoptosis.
However, IGF-1 plays an important role in the development and regulation of postnatal growth, with taller people having increased levels of IGF-1 during childhood and adolescence, leading possibly to increased risk of thyroid cancer in adult life. 8,24
The analyses presented here have several advantages. A two-sample MR study design was used to eliminate unobserved confounding and reverse causality; however, there was a sample overlap between height and AITD GWAS. The estimated bias and type I error in the MR analysis using height as exposure and AITD as outcome were 0.004 and 0.07, respectively. 25 Thus, multiple MR methods were employed, and the concordance in findings provided additional confidence. Finally, we employed a sensitivity analysis by excluding SNPs strongly associated with the outcomes, and the associations, although attenuated, remained.
Our study also had limitations. We employed proxies for the bidirectional analysis since there was no full availability of public summary statistics data. However, the proxies we employed were looked up in a narrow window of 250 kb and were highly correlated with the original at r 2 = 0.8. In addition, we employed summary statistics of adult height and AITD GWAS, and the most possible effects of hypothyroidism on height could be observed during childhood/adolescence.
Future studies could further explore the role of hypothyroidism and height in childhood or adolescence. In addition, the height-associated genetic variants used as instruments were obtained after performing approximate conditional and joint multiple-SNP analysis, as implemented in Genome-wide Complex Trait Analysis. 10
Additionally, our study was mainly performed in European ancestry individuals; the GWAS for height included 76% Europeans, whereas AITD and thyroid cancer studies were performed in Europeans only. Thus, we cannot infer broader conclusions about ancestry-specific effects.
Through exploration of the causal relationships presented here, our findings have the potential to support identification of individuals who might be at higher risk for AITD or thyroid cancer, based on their height or using height as a predictor, offering opportunities for more targeted screening, early detection, and preventive measures.
Conclusions
We showed that increased genetically predicted height was associated with increased risk of AITD, and not vice versa. Furthermore, increased genetically predicted height was associated with increased risk of thyroid cancer. These results could further aid in investigation of height-related pathways as a means of gaining new mechanistic insights (with potential clinical relevance) into AITD and thyroid cancer.
Footnotes
Authors' Contributions
A.P. was involved in study design, performance of analyses, and writing of the original draft. B.O.Å., S.B., A.K., M.M., R.S., and A.T. were involved in interpretation of results, critical editing, and article approval. P.D. was involved in study design, supervision and interpretation of results, critical editing, and article approval. E.M. was involved in study conception and design, supervision and interpretation of results, critical editing, and article approval.
Author Disclosure Statement
No competing financial interests exist.
Funding Information
A.P. is supported by the National Institute for Health and Care Research Barts Biomedical Research Centre (NIHR203330). S.B. is supported by the Wellcome Trust (225790/Z/22/Z) and the UK Research and Innovation Medical Research Council (MC_UU_00002/7). This research was supported by the National Institute for Health Research Cambridge Biomedical Research Centre (NIHR203312). The views expressed are those of the authors and not necessarily those of the National Institute for Health Research or the Department of Health and Social Care. For the other authors, no funding information is available.
Supplementary Material
Supplementary Table S1
Supplementary Table S2
Supplementary Table S3
Supplementary Table S4
Supplementary Table S5
Supplementary Table S6
Supplementary Table S7
Supplementary Table S8
Supplementary Table S9
Supplementary Figure S1
Supplementary Figure S2
Supplementary Figure S3
Supplementary Figure S4
Supplementary Figure S5
Supplementary Figure S6