
Abstract
Introduction:
Large tumor size is associated with poorer outcomes in well-differentiated thyroid cancer, yet it remains unclear whether size >4 cm alone confers increased risk, independent of other markers of aggressive disease. The goal of this study was to assess the relationship between tumor size, other high-risk histopathological features, and survival in well-differentiated thyroid cancer and to evaluate the significance of 4 cm as a cutoff for management decisions.
Methods:
Patients with well-differentiated thyroid cancer were identified from the National Cancer Database (2010–2015) and categorized by tumor size (i.e., small [≤4 cm] or large [>4 cm]) and presence of high-risk histopathological features (e.g., extrathyroidal extension). First, propensity score matching was used to identify patients who were similar across all other observed characteristics except for small versus large tumor size, and a multivariable Cox proportional hazards model was used to estimate the relationship between tumor size and survival. Second, we assessed whether the presence of high-risk features demonstrates conditional effects on survival based on the presence of tumor size >4 cm using an interaction term. Finally, additional models assessed the relationship between incremental 1 cm increases in tumor size and survival. Analyses were repeated using a validation cohort from the Surveillance, Epidemiology, and End Results Program (2008–2013).
Results:
Of 193,133 patients in the primary cohort, 7.9% had tumors >4 cm, and 30% had at least one high-risk feature. After matching, tumor size >4 cm was independently associated with worse survival (HR 1.63, p < 0.001). However, tumor size >4 cm and one or more other high-risk features together yielded worse survival than either size >4 cm alone (MMD: 0.70, p < 0.001) or other high-risk features alone (MMD: 0.49, p < 0.001). When assessed in 1 cm increments, the largest increases in hazard of death occurred at 2 cm and 5 cm, not 4 cm. Results from the validation cohort were largely consistent with our primary findings.
Conclusions:
Concomitant high-risk features confer worse survival than large tumor size alone, and a 4 cm cutoff is not associated with the greatest increase in risk. These findings support a more nuanced approach to tumor size in the management of well-differentiated thyroid cancer.
Introduction
Thyroid cancer is a common malignancy, with ∼44,000 new cases diagnosed annually. 1,2 Yet, as an indolent disease, 5-year survival is estimated at 98.5%. 3 Given this reassuring prognosis, the American Thyroid Association’s (ATA) 2015 management guidelines encourage less aggressive treatment for many patients with well-differentiated thyroid cancer than was previously recommended. 4,5 It is expected that this paradigm shift toward de-escalation of care will benefit many patients by avoiding the potential side effects of RAI therapy, dependence on lifelong medication, and health care–related expenses. 6 –9
Selecting appropriate patients for less extensive therapy is a key component of the “less is more” approach delineated in the 2015 ATA guidelines. 5 The guidelines describe the risk of disease recurrence as a continuum from low to high, based on tumor characteristics. 4 For patients whose preoperative findings reveal an elevated risk of recurrence, defined in the guidelines as tumor size >4 cm, gross extrathyroidal extension, clinically positive lymph nodes, or distant metastases, the ATA still recommends total thyroidectomy. 4 Furthermore, the ATA recommends completion of thyroidectomy for patients in whom surgical pathological assessment after thyroid lobectomy reveals an indication for total thyroidectomy, such as thyroid cancer with tumor size >4 cm.
Despite these recommendations, there is a dearth of evidence regarding the role of tumor size >4 cm as an independent prognostic feature in well-differentiated thyroid cancer. The primary questions are (1) whether tumor size alone is associated with worse outcomes, independent of other high-risk features; (2) whether tumor size effects are modified by the presence of other high-risk features; and (3) whether 4 cm is the best cutoff for risk stratification. Because larger tumors frequently have other markers of aggressive disease, such as lymph node involvement and lymphovascular invasion, it remains unclear whether large tumor size alone is an independent risk factor for recurrence or whether it is simply associated with other high-risk histopathological features. 10 Given that ∼20% of well-differentiated thyroid cancers >4 cm in size lack any other high-risk features, it is important to isolate the impact of large tumor size alone on outcomes to ensure that the risk–benefit ratio of treatment recommendations is appropriately balanced for these patients. 10
Methods
Study cohort
The primary study cohort was obtained from the National Cancer Database (NCDB), which contains data on common malignancies from ∼1500 institutions in the United States. Adult patients diagnosed between 2010 and 2015 with papillary or follicular thyroid cancer were identified using the following International Classification of Diseases for Oncology, 3rd Edition codes: 8050/3, 8260/3, 8330–8332/3, 8335/3, 8340–8344/3, and 8350/3. 11 Demographic, clinical, and treatment characteristics for each patient were extracted. Patients were excluded if tumor size was not recorded, if they had distant metastases at the time of diagnosis, or if they did not undergo surgical management.
Exposures and outcome
The primary exposure was tumor size >4 cm, compared with size ≤4 cm. The secondary exposure was the presence of other markers of aggressive disease. As a best approximation of the ATA guidelines, other markers of aggressive disease were defined using data available in the NCDB as follows: lymphovascular invasion, extrathyroidal extension, any number of clinically positive lymph nodes (clinical N1), ≥5 positive lymph nodes from any location on surgical pathology, any number of positive lymph nodes from a lateral compartment on surgical pathology (pathological N1b), and tall cell/columnar (8344/3) or diffuse sclerosing (8350/3) histological variants. 4,12 The primary outcome was overall survival, with follow-up information on patients’ vital status available through 2020. The NCDB does not include information about disease recurrence, reoperation, or cause of death, so these outcomes could not be investigated in the principal analyses.
Statistical analysis
Descriptive statistics were calculated, with categorical variables reported as frequencies with percentages and continuous variables reported as means with standard deviations or medians with interquartile ranges. Group comparisons were performed using Chi-square tests and Kruskal–Wallis tests, as appropriate. Three statistical approaches were used to address our three study questions, as follows:
Propensity score match
To control for potential confounding between larger tumor size and presence of other markers of aggressive disease, propensity score matching was used to identify a subset of patients who were similar across all other observed characteristics except for tumor size (age at diagnosis, sex, race/ethnicity, insurance type, Charlson–Deyo comorbidity score, and the presence or absence of each of the defined markers of aggressive disease). Individual propensity scores were calculated as the probability having a tumor >4 cm in size. One-to-one optimal subset matching was then performed to match patients with tumor size >4 cm to those with tumor size ≤4 cm using a Mahalanobis distance matrix and a caliper on the propensity score. 13 The quality of the match was assessed via Chi-square tests. A multivariable Cox proportional hazards model was generated for the matched cohort, with adjustment for treatment characteristics, including extent of surgical resection, receipt of RAI, and hospital case volume. Hospital case volume was dichotomized as high or low, with high-volume hospitals defined as those that treated ≥12 cases of well-differentiated thyroid cancer in each study year. 14
Effect modification
To assess whether the presence of other markers of aggressive disease demonstrates conditional effects on survival based on the presence of tumor size >4 cm, a binary indicator was created to identify patients who had one or more markers of aggressive disease. A multivariable Cox proportional hazards model was generated for the total cohort with an interaction term between tumor size >4 cm and other markers of aggressive disease, as well as adjustment for age, sex, race/ethnicity, median income in the patient’s home zip code, insurance type, Charlson–Deyo comorbidity score, extent of surgery, receipt of radioactive iodine therapy, and hospital case volume. Subsequently, the cohort was divided into four groups based on tumor size ≤4 cm or >4 cm and the presence or absence of other markers of aggressive disease, and a second model was generated so that predicted hazard of death could be compared between the four groups, using postestimation comparison of means with a Bonferroni correction for multiple comparisons. Finally, to explore whether a greater number of high-risk features is associated with survival, the cohort was stratified by tumor size ≤4 cm or >4 cm, and additional models were generated with the number of markers of aggressive disease (0, 1, 2, ≥3) as the exposure.
Optimal size cutoff
To further isolate the role of tumor size in survival, a subgroup analysis was performed on the cohort of patients with no markers of aggressive disease. Tumor size was categorized into 1 cm groups, from ≤1 cm to >5 cm. A multivariable Cox model was generated to assess the hazard of death for each tumor size group, and the predicted hazard of death was compared between groups using postestimation comparisons with a Bonferroni correction. Lastly, additional Cox models were generated to assess the relevance of 4 cm as the cutoff for increased risk. Tumor size was dichotomized at each centimeter (i.e., ≤1 cm vs. >1 cm, ≤2 cm vs. >2 cm), and the associations between each potential cutoff and survival were assessed with independent models. The magnitudes of the coefficients were examined to assess which cutoff(s) were associated with the greatest increase in risk.
Validation analyses
Given the limitations of the National Cancer Database, a validation cohort was generated from the Surveillance, Epidemiology, and End Results (SEER) Program. SEER is a population-based dataset containing all cancer cases from participating geographic regions, which represent a 28% sample of the U.S. population. 15 One of the benefits of the SEER database in the study of well-differentiated thyroid cancer is that it provides disease-specific survival, which was used as the primary outcome for the validation analyses. Patients were identified from SEER using the same International Classification of Diseases for Oncology codes and exclusion criteria as mentioned earlier, with diagnosis dates between 2008 and 2013 and follow-up data available through 2018. As we used SEER data linked to Medicare, patients <65.5 years of age were excluded. Notably, the demographic and clinical variables available in SEER differ from those in the NCDB. Thus, the validation analyses were performed using the closest set of covariates possible to recapitulate the primary analyses. For instance, for the markers of aggressive disease, lymphovascular invasion was not available in SEER; however, the other markers from the NCDB were available and similarly distributed among the validation cohort: extrathyroidal extension (24%), any number of clinically positive lymph nodes (27%), ≥5 positive lymph nodes from any location on surgical pathology (5.4%), any number of positive lymph nodes from a lateral compartment on surgical pathology (6.9%), and aggressive histological variant (2.7%).
For the propensity score matching analysis, SEER patients were matched on age, sex, race, Medicaid eligibility status, and the presence or absence of each of the available markers of aggressive disease. A comorbidity index was not included as these data are not provided in SEER. The multivariable Cox proportional hazards model generated for the matched cohort was adjusted for extent of surgical resection and receipt of RAI, but hospital case volume was not included as this is not reported in SEER. In the effect modification analysis, the Cox proportional hazards model was similarly adjusted for age, sex, race, Medicaid eligibility status, extent of surgery, and receipt of radioactive iodine therapy. Lastly, for the cutpoint analysis, patients with markers of aggressive disease were excluded in order to isolate the role of tumor size alone, and the Cox models were adjusted for age, sex, race, Medicaid eligibility status, extent of surgery, and receipt of radioactive iodine therapy.
For all models, patients with missing data were excluded. Statistical analyses were performed using Stata, version 17.0 (Stata Corp, College Station, TX) and R, version 4.1.1 (R Development Core Team, Vienna, Austria). This study was deemed exempt by the Institutional Review Board of the University of Pennsylvania.
Results
Primary cohort characteristics
A total of 193,133 patients were included in the primary cohort from the NCDB. The mean age was 50.1 (±14.9) years. The majority of the cohort was female (76%) and non-Hispanic White (76%). The median tumor size was 1.3 cm (interquartile range [IQR]: 0.7–2.5), and 7.9% of the cohort had tumors >4 cm. At least one marker of aggressive disease was identified in 28% of patients with tumors ≤4 cm and 61% of patients with tumors >4 cm (p < 0.001). These characteristics are summarized in Table 1.
Demographic and Clinical Characteristics of Patients Diagnosed with Nonmetastatic Well-Differentiated Thyroid Cancer (National Cancer Database, 2010–2015)
AJCC, American Joint Committee on Cancer; IQR, interquartile range.
The majority of patients were treated at a high-volume center (66%), but treatment patterns varied based on tumor size. Total thyroidectomy was performed in 90% of patients with tumors >4 cm, compared with 88% of patients with tumors ≤4 cm (p < 0.001). In addition, 67% of patients with tumors >4 cm received adjuvant RAI, compared with 43% of patients with tumors ≤4 cm (p < 0.001) (Table 2).
Treatment Characteristics of Patients Diagnosed with Nonmetastatic Well-Differentiated Thyroid Cancer, with Stratification by Tumor Size (National Cancer Database, 2010–2015)
Across the primary cohort, median follow-up time was 87 months (IQR: 69–108), and 5-year overall survival was 96%. Five-year survival was significantly worse in patients with tumors >4 cm (92%) compared with patients with tumors ≤4 cm (96%, p < 0.001). On unadjusted Cox proportional hazards regression, tumor size >4 cm was associated with an increased hazard of death compared with tumor size ≤4 cm (HR 2.02 [confidence interval or CI 1.92–2.12], p < 0.001) (Fig. 1A).
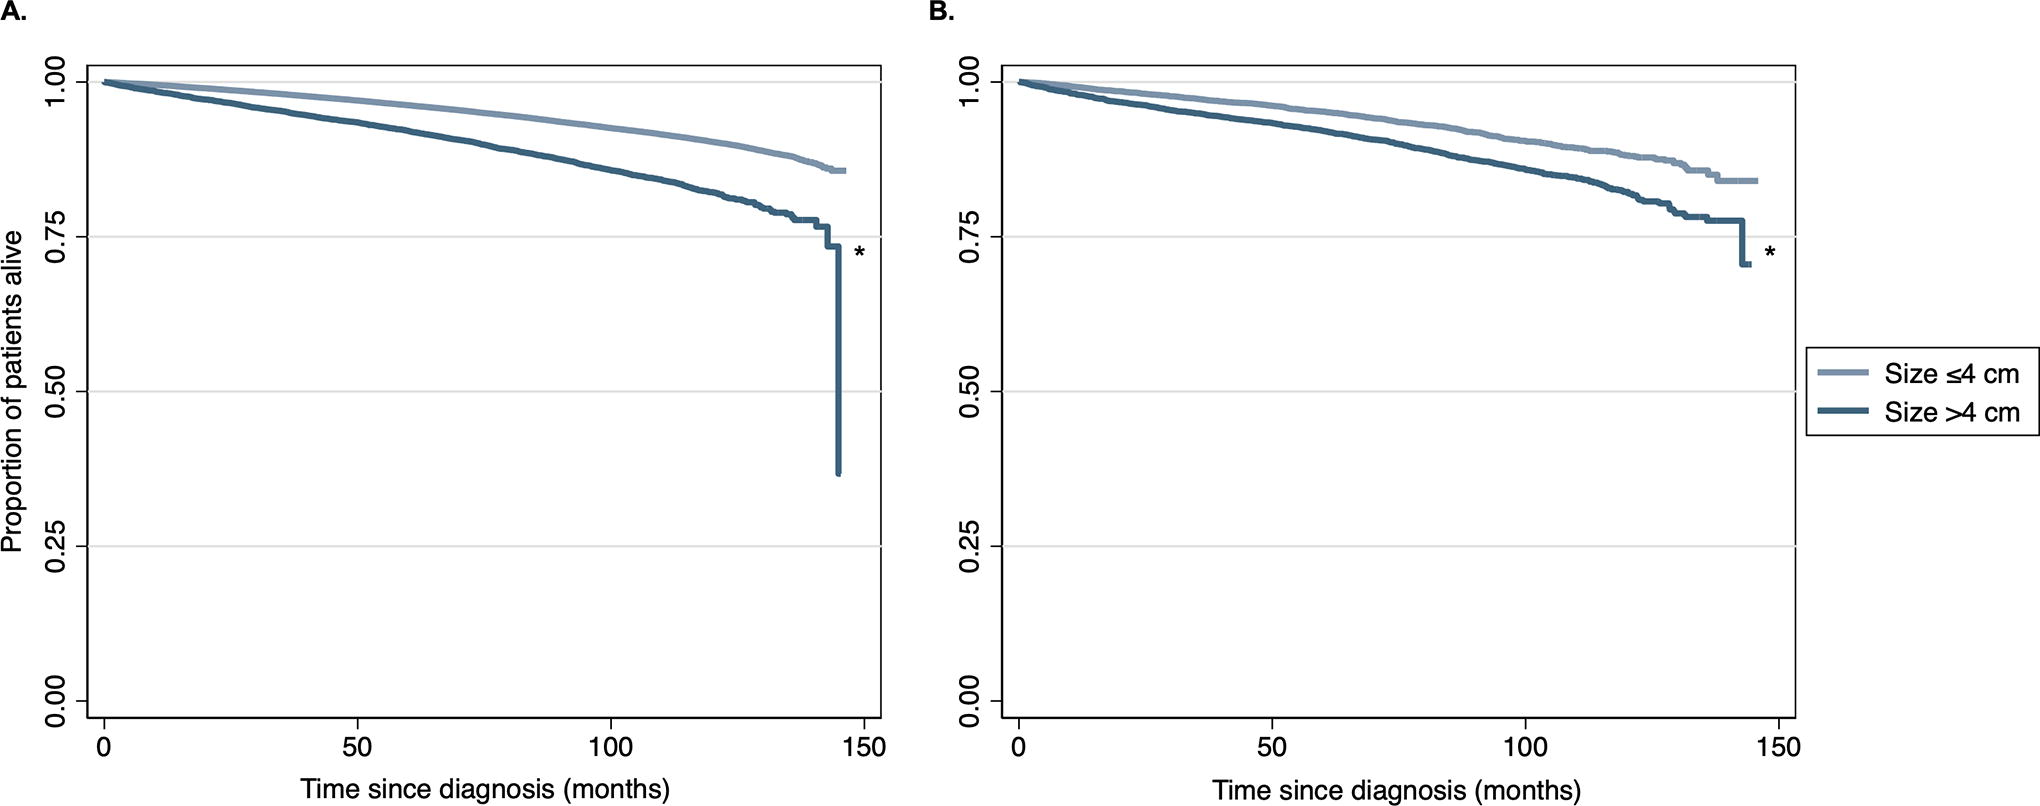
Unadjusted Kaplan–Meier survival curves for patients with well-differentiated thyroid cancer, stratified by tumor size,
Propensity score match
Out of 177,972 patients with tumors ≤4 cm and 15,161 patients with tumors >4 cm in the primary cohort, the matching process identified 6863 pairs. After matching, there were no significant differences in demographic or clinical characteristics between the groups (Table 3). On Cox proportional hazards regression analysis of the matched patients, tumor size >4 cm was associated with worse overall survival compared with tumor size ≤4 cm (HR 1.63 [CI 1.43–1.86], p < 0.001) (Fig. 1B).
Demographic and Clinical Characteristics of Patients with Tumors >4 cm vs. ≤4 cm in Size, Before and After Propensity Score Matching (National Cancer Database, 2010–2015)
Propensity scores were calculated using the following covariates: age at diagnosis, sex, race/ethnicity, insurance type, Charlson–Deyo comorbidity score, and the presence or absence of each of the defined markers of aggressive disease.
Effect modification
Using all patients in the primary cohort, an interaction term was used to assess whether the association between large tumor size and survival is conditional on the presence of other markers of aggressive disease. The adjusted Cox model revealed a significant interaction: HR 1.25 [CI 1.03–1.51], p = 0.023.
Next, categorization of the cohort by risk profile revealed that 63% had tumor size ≤4 cm and no other risk factors (Group 1), 29% had tumor size ≤4 cm and one or more other risk factors (Group 2), 3.4% had tumor size >4 cm and no risk factors (Group 3), and 5.4% had tumor size >4 cm and one or more risk factors (Group 4). The presence of tumor size >4 cm and one or more risk factors yielded a greater increase in hazard of death than either large tumor size alone (Group 4 vs. Group 3: MMD 0.70 [CI 0.46–0.94], p < 0.001) or the presence of other risk factors in tumors ≤4 cm (Group 4 vs. Group 2: MMD 0.49 [CI 0.35–0.63], p < 0.001). Survival in patients with large tumor size alone was similar to that of patients with tumor size ≤4 cm and other risk factors (Group 3 vs. Group 2: MMD −0.21 [CI −0.44–0.01], p = 0.077) (Supplementary Table S1). The survival curves for the four groups are shown in Figure 2.
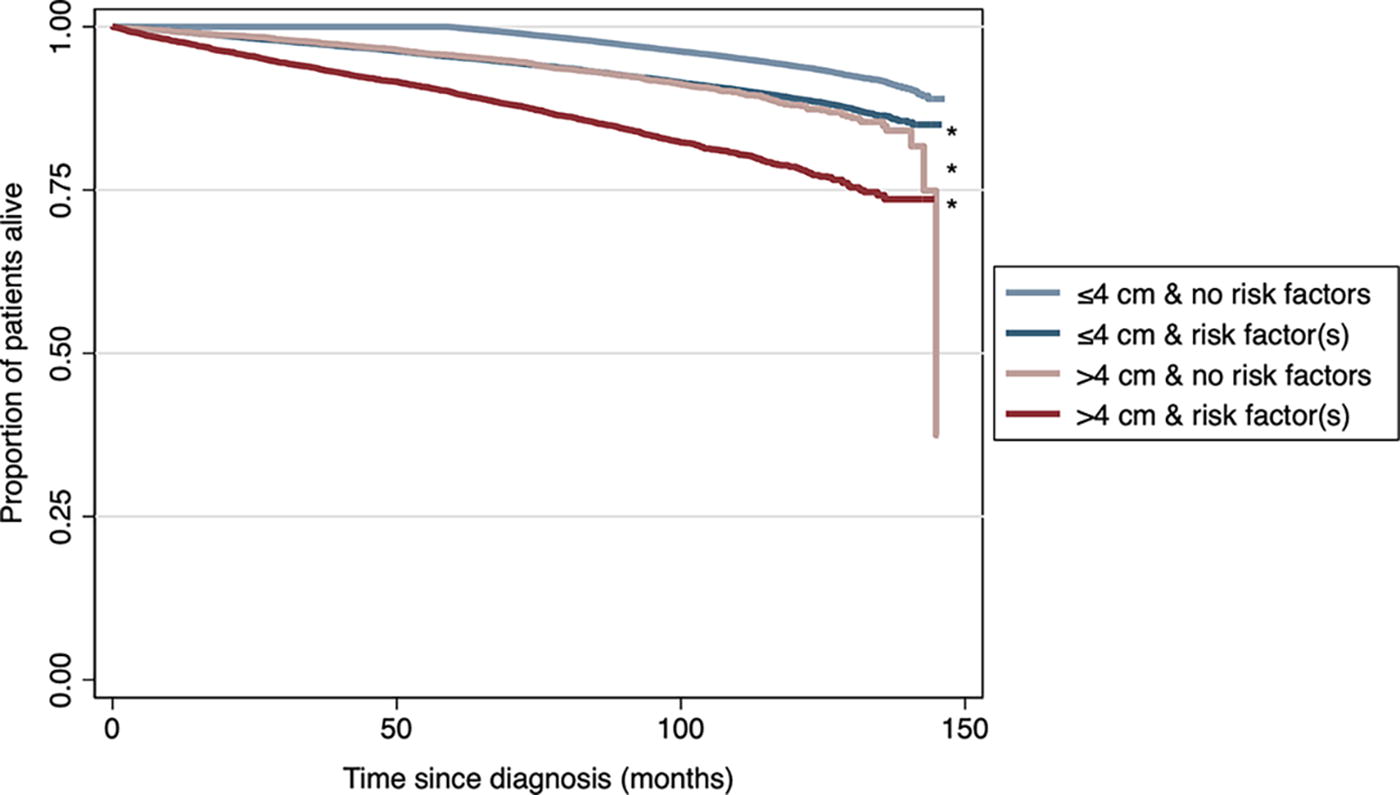
Unadjusted Kaplan–Meier survival curves for patients with well-differentiated thyroid cancer, stratified by tumor size and presence of markers of aggressive disease (National Cancer Database, 2010–2015). * indicates p < 0.001.
In addition, a greater number of high-risk features was associated with worse survival (Fig. 3). The magnitude of the increase in risk was larger among patients with tumor size >4 cm compared with patients with tumor size ≤4 cm (Supplementary Table S2).
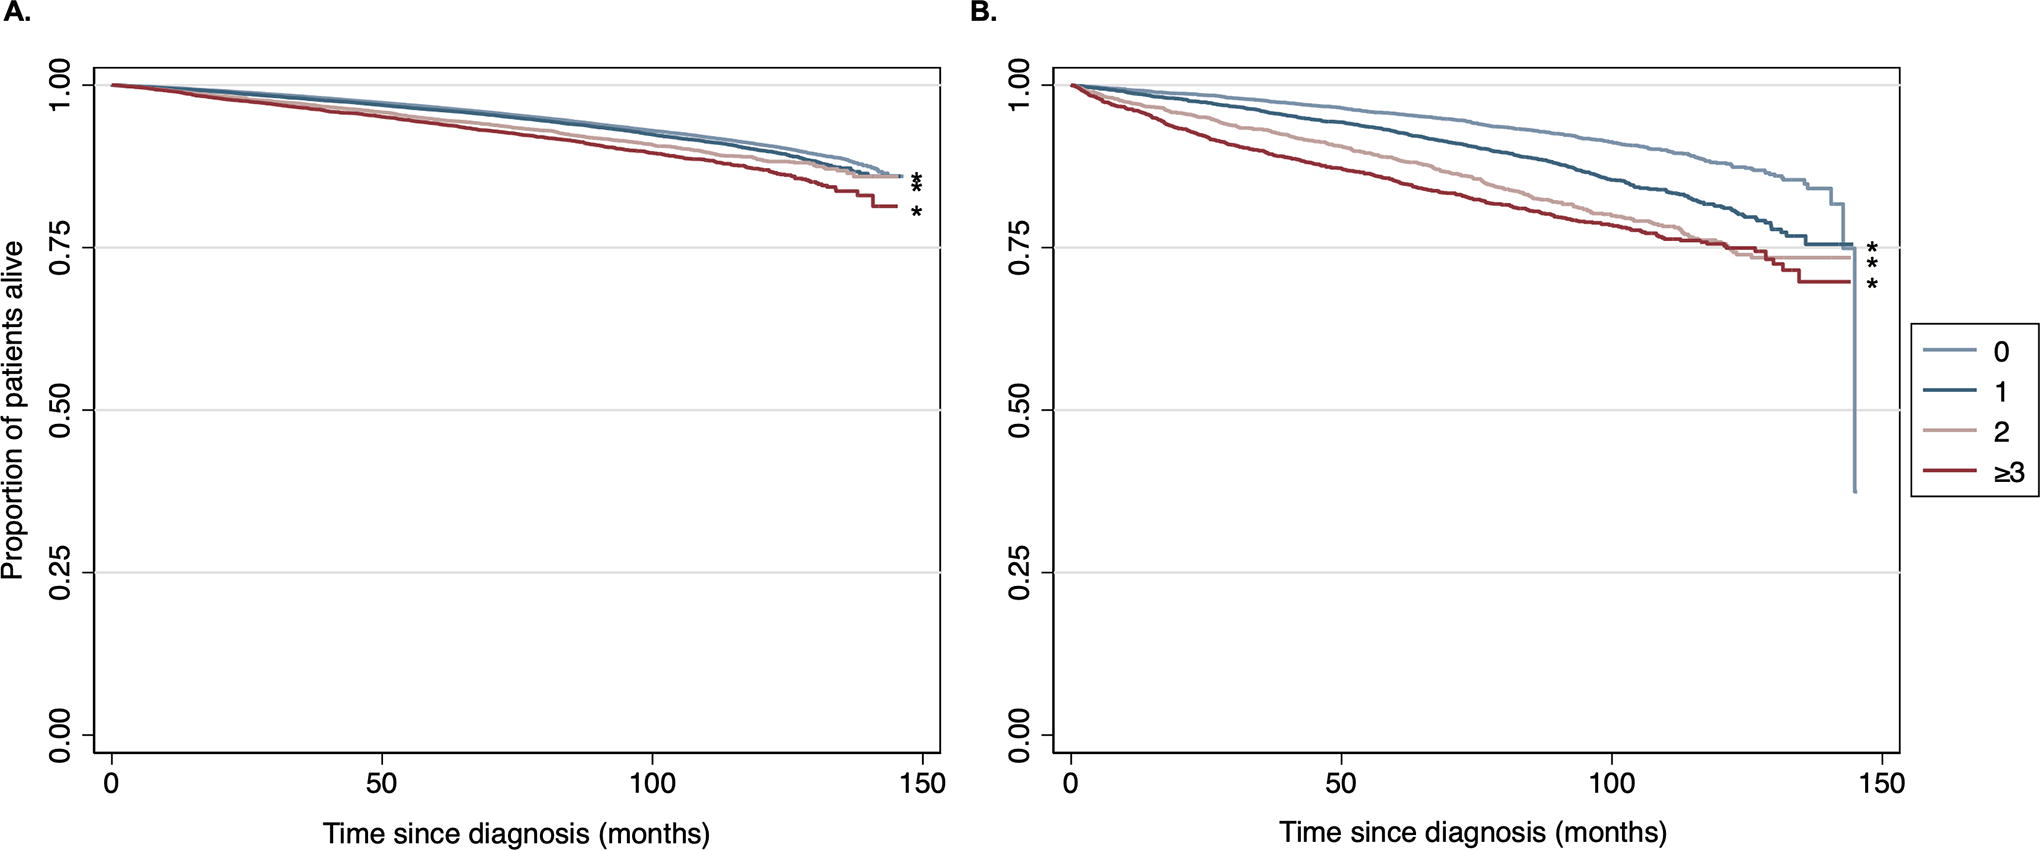
Unadjusted Kaplan–Meier survival curves for patients with well-differentiated thyroid cancer, stratified by number of markers of aggressive disease, among those with
Incremental increase in tumor size
Of the primary NCDB cohort, 70% of patients had no markers of aggressive disease. Among this subset, the distribution of tumor size was: ≤1 cm: 51%; 1.1–2.0 cm: 23%; 2.1–3.0 cm: 12%; 3.1–4.0 cm: 6.2%; 4.1–5.0 cm: 4.8%; >5 cm: 2.1%. In the multivariable model, there was no significant increase in hazard of death for tumors 1.1–2.0 cm compared with tumors ≤1 cm (HR 1.05 [CI 0.95–1.16], p = 0.377). However, all other tumor sizes were associated with an increased hazard of death, as shown in Figure 4.
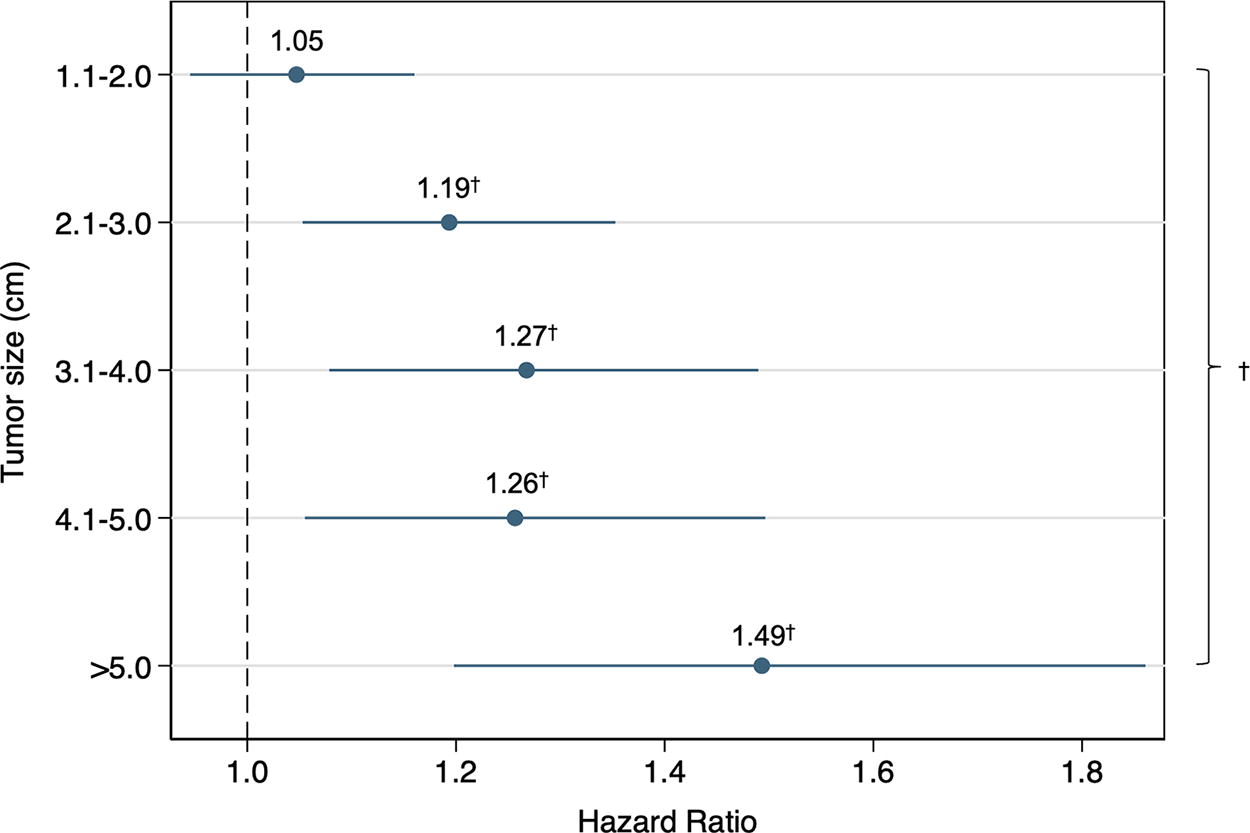
Adjusted hazard ratios (reference: size ≤1 cm) for patients with well-differentiated thyroid cancer and no known markers of aggressive disease, in 1 cm tumor size increments (National Cancer Database, 2010–2015). † indicates p < 0.05. The model was adjusted for age, sex, race/ethnicity, median income in the patient’s home zip code, insurance type, Charlson–Deyo comorbidity score, extent of surgery, receipt of radioactive iodine therapy, and hospital case volume.
We subsequently assessed whether there was an incremental increase in hazard of death associated with each additional centimeter of tumor size beyond 1 cm. The only significant difference was noted when patients with tumors >5 cm were compared with patients with tumors 1.1–2.0 cm (MMD 0.35 [CI 0.02–0.69], p = 0.030) (Fig. 4). All other comparisons between tumor size groups revealed no significant differences in survival (Table 4).
Postestimation Comparisons from Multivariable Cox Proportional Hazards Model for Patients with Well-Differentiated Thyroid Cancer and No Known Markers of Aggressive Disease, According to Size Group (National Cancer Database, 2010–2015)
The model was adjusted for age, sex, race/ethnicity, median income in the patient’s home zip code, insurance type, Charlson–Deyo comorbidity score, extent of surgery, receipt of radioactive iodine therapy, and hospital case volume.
Optimal size cutoff
Finally, for the subset of patients from the NCDB with no other markers of aggressive disease, additional models were created to test the association between cutoff size (1–5 cm) and hazard of death. The models yielded the following coefficients: >1 vs. ≤1 cm = 0.14 ([CI 0.05–0.22], p = 0.001); >2 vs. ≤2 cm = 0.21 ([CI 0.12–0.30], p < 0.001); >3 vs. ≤3 cm = 0.22 ([CI 0.11–0.33], p < 0.001); >4 vs. ≤4 cm = 0.22 ([CI 0.09–0.36], p = 0.001); >5 vs. ≤5 cm = 0.32 ([CI 0.10–0.53], p = 0.004). Thus, there was a substantial increase in risk at the 2 cm cutoff and the 5 cm cutoff, but the 4 cm cutoff was not associated with a substantial increase in risk.
SEER validation analyses
A total of 5011 patients with well-differentiated thyroid cancer were included from the SEER database. In general, the characteristics of the SEER cohort were similar to those of the NCDB cohort. The mean age was 73 years (±5.8), and the majority of patients were female (69%) and identified as White race (84%). The median tumor size was 1.3 cm (IQR: 0.5–2.5), and 13% of patients had tumors >4 cm in size. At least one high-risk histopathological feature was present in 33% of patients. For the total validation cohort, the rate of 5-year disease-specific survival was 97%; patients with tumors >4 cm in size had worse 5-year survival than those with tumors <4 cm in size (89% vs. 98%, p < 0.001).
For the propensity score matching analysis, 668 pairs were identified from the SEER cohort. There were no significant differences in demographic or clinical characteristics between the matched groups (Supplementary Table S3). Consistent with the results from the primary NCDB cohort, the proportional hazards model using the matched pairs revealed that tumor size >4 cm was independently associated with increased disease-specific mortality compared with size <4 cm (HR 2.95 [CI 1.78–4.90], p < 0.001).
Similarly, findings from the primary effect modification analysis were mostly recapitulated using the SEER cohort. When categorized by risk profile, 61% of patients had tumor size ≤4 cm and no other risk factors (Group 1), 25% had tumor size ≤4 cm and one or more other risk factors (Group 2), 6% had tumor size >4 cm and no risk factors (Group 3), and 8% had tumor size >4 cm and one or more risk factors (Group 4). On regression analysis, patients who had a tumor size >4 cm as well as one or more concomitant high-risk features had a greater hazard of death compared with those with tumor size >4 cm alone (Group 4 vs. Group 3: MMD 0.24 [CI 0.16–0.31], p < 0.001) and those with high-risk features alone (Group 4 vs. Group 2: MMD 0.22 [CI 0.13–0.30], p < 0.001). Notably, survival in patients with large tumor size alone was slightly better than that of patients with tumor size ≤4 cm and at least one other risk factor (Group 3 vs. Group 2: MMD −0.04 [CI −0.08 to −0.01], p = 0.024). This finding contrasts slightly with the NCDB results, where the potential difference in survival between these two groups approached, but did not reach, statistical significance.
Finally, for the subgroup analysis examining the association between cutoff size (1–5 cm) and disease-specific survival, 67% of patients in the SEER cohort had no markers of aggressive disease and were included. Among this group, 55% had tumors ≤1 cm in size, 22% had tumors between 1.1–2.0 cm, 11% had tumors between 2.1 and 3.0 cm, 5% had tumors between 3.1 and 4.0 cm, 3% had tumors between 4.1 and 5.0 cm, and 4% had tumors >5 cm in size; thus, this analysis was limited by small sample sizes. The models yielded the following coefficients: >1 vs. ≤1 cm = 0.98 ([CI 0.05–1.91], p = 0.038); >2 vs. ≤2 cm = 0.70 ([CI −0.11 to 1.51], p = 0.091); >3 vs. ≤3 cm = 0.20 ([CI −0.75 to 1.16], p = 0.675); >4 vs. ≤4 cm = 0.77 ([CI −0.18 to 1.72], p = 0.112); >5 vs. ≤5 cm = 0.59 ([CI −0.65 to 1.83], p = 0.352). Thus, the only statistically significant increase in risk occurred at the 1 cm cutoff.
Discussion
To our knowledge, this is the first study that has used two large, national datasets to isolate the prognostic importance of tumor size in well-differentiated thyroid cancer using multiple methods. We used three approaches—propensity score matching, effect modification, and iterative Cox regression modeling—to evaluate the relationship between tumor size and survival. We found that, after matching patients on other demographic and clinical characteristics, large tumor size is independently associated with worse survival in both datasets. However, when examining the relationship between large tumor size and other markers of aggressive disease, we found a significant interaction between the two; patients who had large tumors in the presence of other high-risk features had an increased hazard of death compared with patients with large tumor size alone in both datasets. In contrast, patients with large tumor size alone had a similar or perhaps even marginally decreased hazard of death to patients with small tumors and one or more high-risk features. Finally, when we evaluated the association between survival and tumor size in 1 cm increments using the NCDB, we found a significant increase in hazard of death at 2 cm and at 5 cm but not at 4 cm.
A key finding from this study is that the presence of both large tumor size and at least one other marker of aggressive disease together conferred a greater risk of death than either large tumor size or other high-risk features alone. This result suggests that the underlying aspects of tumor biology, such as the genetic mutations, epigenetic changes, and alterations to the tumor microenvironment, dictate the clinical characteristics that are observed at diagnosis as well as the likelihood of meaningful disease progression. 16,17 Thus, we can infer that the combination of biological changes that leads to a large tumor without other markers of aggressive disease is less potent than the combination of changes that results in a large tumor accompanied by other high-risk features. We therefore suggest that all large tumors should not be viewed as a homogenous group for the purposes of clinical decision-making; rather, tumor size should be interpreted in the context of genetic mutation status as well as other clinical characteristics.
Particularly for patients who have large tumors without other markers of aggressive disease, our findings support a reconsideration of the role of tumor size in surgical decision-making. Although the current ATA guidelines recommend total thyroidectomy for patients with tumors >4 cm in size, the findings from our primary analysis do not indicate that there is a meaningful increase in hazard of death for patients with tumors 4.1–5.0 cm compared with those between 1.1 and 4.0 cm, in the absence of other markers of aggressive disease. In fact, one recent single-institution study found that encapsulated tumors >4 cm without vascular invasion that were treated with lobectomy alone had a near-zero risk of recurrence or disease-specific mortality. 18 Thus, for the ∼20–40% of patients with tumors >4 cm who do not have other markers of aggressive disease, it may be reasonable to consider 5 cm as the criterion for more aggressive surgical therapy. 10 This practice would be supported by our additional finding that, when we tested the increase in risk associated with each additional 1 cm in tumor size in the NCDB, the greatest increases occurred at the 2 cm cutpoint and the 5 cm cutpoint. Practically, this shift would be most relevant for the clinical scenario in which patients undergoing a diagnostic thyroid lobectomy are found to have a tumor 4–5 cm in size in the absence of other high-risk features; for these patients, completion thyroidectomy may not be necessary, in contrast to the current ATA management guidelines.
Several prior studies have sought to investigate the relationship between tumor size and outcomes in well-differentiated thyroid cancer. Most of these studies have used the established tumor classification cutoffs from the American Joint Committee on Cancer’s (AJCC) staging system to assess the prognostic value of tumor size. For instance, one study using the NCDB found an increasing risk of central neck lymph node metastases for T1b (1.1–2.0 cm), T2 (2.1–4.0 cm), and T3 (>4 cm) tumors compared with T1a. 19 Additional single-institution studies have found an increased likelihood of recurrence and disease-specific mortality for T2 and T3 tumors compared with T1. 20 –22 This prior work supports our finding that there is an increase in risk associated with a tumor size cutoff of 2 cm. However, shortcomings of these prior studies include that they did not explore whether 2 cm and 4 cm represent the optimal tumor size cutoffs for risk stratification compared with other potential size cutoffs, and they did not assess for an interaction between tumor size and other markers of aggressive disease. One of the novel findings from this study is that, when potential size cutoffs are tested in successive 1 cm increments in the NCDB, 2 cm and 5 cm emerge as more relevant transitions in risk than 4 cm. Notably, when we attempted to validate this cutoff analysis using the SEER data, the only statistically significant increase in risk was noted at the 1 cm tumor size cutoff. However, we hypothesize that this analysis was limited by the small sample sizes created after stratifying patients into 1 cm tumor size groups; the sample size from the NCDB cohort was over 38 times larger than the SEER sample available for this study.
There are several limitations to the present study. First, neither the NCDB nor the SEER datasets contain information on cancer recurrence, which is relevant in the study of the tumor size as a prognostic indicator. In addition, for the NCDB, the substantial data missingness as well as variability in quality of data entry from participating institutions can introduce bias. 23,24 Similarly, in the SEER database, coding of the receipt of RAI therapy may be missing or inaccurate and therefore may have biased our results. Our SEER sample was also limited in that only adults >65.5 years of age were included, and only those with primary Medicare insurance were included; thus, these subjects may not be representative of all patients with thyroid cancer. Furthermore, our ability to isolate the role of tumor size by accounting for other markers of aggressive disease was limited by the variables available in the datasets used. For example, although the ATA risk stratification system includes several additional features such as size of involved lymph nodes and genetic mutation status to estimate risk of recurrence, these features are not reported in the NCDB or SEER. Thus, it is possible that a subset of high-risk somatic tumor mutations, which are not captured in our analyses, may be driving disease-specific mortality. 25 Relatedly, although the NCDB includes the variable “lymphovascular invasion,” current guidelines suggest that vascular invasion and lymphatic invasion should be reported separately as they differ significantly in their prognostic implications, and SEER does not even report any version of these relevant variables.
In conclusion, in this re-examination of tumor size as a prognostic indicator in well-differentiated thyroid cancer, we found that concomitant high-risk features portend worse survival than large tumor size alone. In the primary cohort, the greatest increases in risk occurred at 2 cm and 5 cm. Further exploration in more granular datasets may support a more nuanced approach to clinical decision-making based on tumor size in the future.
Footnotes
Acknowledgments
The collection of cancer incidence data used in this study was supported by the California Department of Public Health pursuant to California Health and Safety Code Section 103885; Centers for Disease Control and Prevention’s (CDC) National Program of Cancer Registries, under cooperative agreement 1NU58DP007156; and the National Cancer Institute’s Surveillance, Epidemiology and End Results Program under contract HHSN261201800032I awarded to the University of California, San Francisco, contract HHSN261201800015I awarded to the University of Southern California, and contract HHSN261201800009I awarded to the Public Health Institute.
Authors’ Contributions
S.P.G.: Conceptualization, methodology, data curation, formal analysis, and writing—original draft preparation. J.S.: Methodology, formal analysis, and writing—reviewing and editing. J.E.P.: Methodology and writing—reviewing and editing. W.A.: Formal analysis and writing—reviewing and editing. J.M.S.B.: Methodology and writing—reviewing and editing. C.B.F.: Methodology and writing—reviewing and editing. S.M.: Writing—reviewing and editing. R.R.K.: Writing—reviewing and editing. H.W.: Conceptualization, writing—reviewing and editing, and supervision.
Disclaimer
The ideas and opinions expressed herein are those of the author(s) and do not necessarily reflect the opinions of the state of California, Department of Public Health, the National Cancer Institute, and the CDC, or their contractors and subcontractors.
Author Disclosure Statement
S.P.G., J.S., J.E.P., W.A., J.M.S.B., C.B.F., S.M., R.R.K., and H.W. have no conflicts of interest to report.
Funding Information
S.P.G., J.S., J.E.P., W.A., C.J.W., and S.M. report no relevant funding. J.M.S.B. and C.B.F. were partially supported by the National Institutes of Health (NIH) grant 5T32CA251063. R.R.K. was partially supported by NIH grants 1R01AG060612-01A1 and 1R01CA228399-01A1. H.W. was partially supported by NIH grant K08 CA270385.
Supplementary Material
Supplementary Table S1
Supplementary Table S2
Supplementary Table S3