
Abstract
Background:
Artificial intelligence (AI) is increasingly being applied in pathology and cytology, showing promising results. We collected a large dataset of whole slide images (WSIs) of thyroid fine-needle aspiration cytology (FNA), incorporating z-stacking, from institutions across the nation to develop an AI model.
Methods:
We conducted a multicenter retrospective diagnostic accuracy study using thyroid FNA dataset from the Open AI Dataset Project that consists of digitalized images samples collected from 3 university hospitals and 215 Korean institutions through extensive quality check during the case selection, scanning, labeling, and reviewing process. Multiple z-layer images were captured using three different scanners and image patches were extracted from WSIs and resized after focus fusion and color normalization. We pretested six AI models, determining Inception ResNet v2 as the best model using a subset of dataset, and subsequently tested the final model with total datasets. Additionally, we compared the performance of AI and cytopathologists using randomly selected 1031 image patches and reevaluated the cytopathologists’ performance after reference to AI results.
Results:
A total of 10,332 image patches from 306 thyroid FNAs, comprising 78 malignant (papillary thyroid carcinoma) and 228 benign from 86 institutions were used for the AI training. Inception ResNet v2 achieved highest accuracy of 99.7%, 97.7%, and 94.9% for training, validation, and test dataset, respectively (sensitivity 99.9%, 99.6%, and 100% and specificity 99.6%, 96.4%, and 90.4% for training, validation, and test dataset, respectively). In the comparison between AI and human, AI model showed higher accuracy and specificity than the average expert cytopathologists beyond the two-standard deviation (accuracy 99.71% [95% confidence interval (CI), 99.38–100.00%] vs. 88.91% [95% CI, 86.99–90.83%], sensitivity 99.81% [95% CI, 99.54–100.00%] vs. 87.26% [95% CI, 85.22–89.30%], and specificity 99.61% [95% CI, 99.23–99.99%] vs. 90.58% [95% CI, 88.80–92.36%]). Moreover, after referring to the AI results, the performance of all the experts (accuracy 96%, 95%, and 96%, respectively) and the diagnostic agreement (from 0.64 to 0.84) increased.
Conclusions:
These results suggest that the application of AI technology to thyroid FNA cytology may improve the diagnostic accuracy as well as intra- and inter-observer variability among pathologists. Further confirmatory research is needed.
Introduction
Artificial intelligence (AI) is emerging in cytopathological image analysis with promising results. Advancement in AI has enabled the application of computer models, such as artificial neural networks, deep learning, genetic algorithms, and classification, to support diagnosis and treatment decisions. 1 Computational models have been developed to perform pathological image analyses using machine learning. 2 –5 Image analysis can be used not only for surgical or biopsy slide samples but also for cytological slides. 6 It can be used to objectify the diagnostic process, mitigate human effort, and improve the productivity of cytopathological examinations.
In non-gynecological cytology, thyroid fine-needle aspiration (FNA) is the most actively explored field of AI application. 7 This is because AI diagnosis is the preferred modality for the evaluation of thyroid nodules owing to easy access and a generally high accuracy. FNA cytology for thyroid nodules is ideal for applying AI owing to the relatively specific diagnostic criteria for thyroid nodules. Thyroid nodules are observed in an estimated 10% of the general population, of which 5–7% suffer from malignant thyroid nodules. 8 FNA is currently considered the preferred modality for the evaluation of thyroid nodules. 9,10 FNA diagnosis is less invasive compared with others; it is also rapid and has high accuracy. Cytopathologists follow The Bethesda System for Reporting Thyroid Cytopathology (TBSRTC), 11,12 which comprises six categories to evaluate the risk of malignancy in thyroid FNA samples. The categories are as follows: non-diagnostic, benign, atypia of undetermined significance/follicular lesion of undetermined significance, follicular neoplasm/suspicious for follicular neoplasm, suspicious for malignancy, and malignant. The sensitivity and specificity of the current system range from 68% to 98% and 56% to 100%, respectively. 8,11,13,14
Studies on the application of AI in thyroid FNA have promising results; however, they have several limitations, such as a small sample size, lack of z-stacking, and the collection of data only from a single institute. Computational methods have been applied to the cytological analysis of thyroid nodules since 1980. 15,16 In 1999, Karakitsos et al. 17 classified the images of benign and malignant thyroid tumors using a learning vector quantizer artificial neural network and achieved 97.8% accuracy. Study by Cochand-Priollet et al. identified malignant and benign nodules using May-Grunwald-Giemsa-stained smears and four independent classifiers. Subsequently, the performances of the classifiers were compared. The most successful classifier, the k-nearest neighbor, achieved an overall accuracy of 88.71%. 18 Convolutional neural networks have been used to predict malignancy from 908 whole slide images (WSIs), and a sensitivity of 92.0% and specificity of 90.5% 19 have been achieved. In another study, an artificial neural network was used to classify 447 cases into two categories, benign and malignant, using the radial basis function, and an overall sensitivity of 95.0% and specificity of 95.5% were achieved. 20 Guan et al. conducted a study using a deep convolutional neural network and fragmented image, which were classified using VGG-16; they obtained an accuracy of 97.66%. 21 Previous studies have evaluated the diagnostic performance of AI, but few studies have explored the AI usefulness with enough amount of training and validation datasets.
The second challenge of developing effective AI for thyroid cytology is the lack of consideration for z-stacking in the training and validation datasets. In cytology, distinct from histological samples, individual cells and three-dimensional cell clusters are suspended in a medium, floating in the space between the glass and cover slides, typically spanning 50–100 microns. This space is referred to as the z-axis, and it is crucial to scan cytological slides at various z-layers of focus to capture clearly focused images of these clusters. 22 This is especially important for samples like thyroid FNAs, which naturally include large papillary clusters. Previously, there has been no special focus on z-stacking for digital cytology images in AI research related to cytology. 22,23 However, through our recent comparative analysis of image quality across different scanners, we have identified the minimal requirements for appropriate z-stack layers based on sample types. 24 For instance, at least three layers are necessary for liquid-based preparations (LBPs) and five layers for conventional smears. Scanning digital cytology images with these specified z-stack layers, tailored to the sample type, is vital for developing robust AI models that can be effectively applied in daily practice. Moreover, as the third challenge, AI models in past studies have been developed and validated using datasets from only a single or two institutions. 23 This approach lacks the diversity and scale needed for good generalizability. There is a pressing need for multi-institutional or national-level datasets to enhance the AI models’ applicability and reliability in various clinical settings.
To address the aforementioned limitations, we built a dataset that contained a sufficient number of cases and z-stacks from nationwide institutions to develop an AI model for thyroid FNAs.
Materials and Methods
The study was approved by the Institutional Review Board (IRB) of the Catholic University of Korea, College of Medicine (UC21SNSI0064), the Institutional Review Board of the Yonsei University College of Medicine (4-2021-0569), Institutional Review Board of the National Cancer Center (NCC2021-0145), and Institutional Review Board of the St. Vincent’s Hospital College of Medicine, Catholic University of Korea (VC22RISI0131). The informed consents from the patients were waived by these IRBs. The use of quality assurance program slides of the Korean Society of Cytopathology was approved by the society executive board. A schematic overview of the proposed method and workflow is shown in Figure 1.
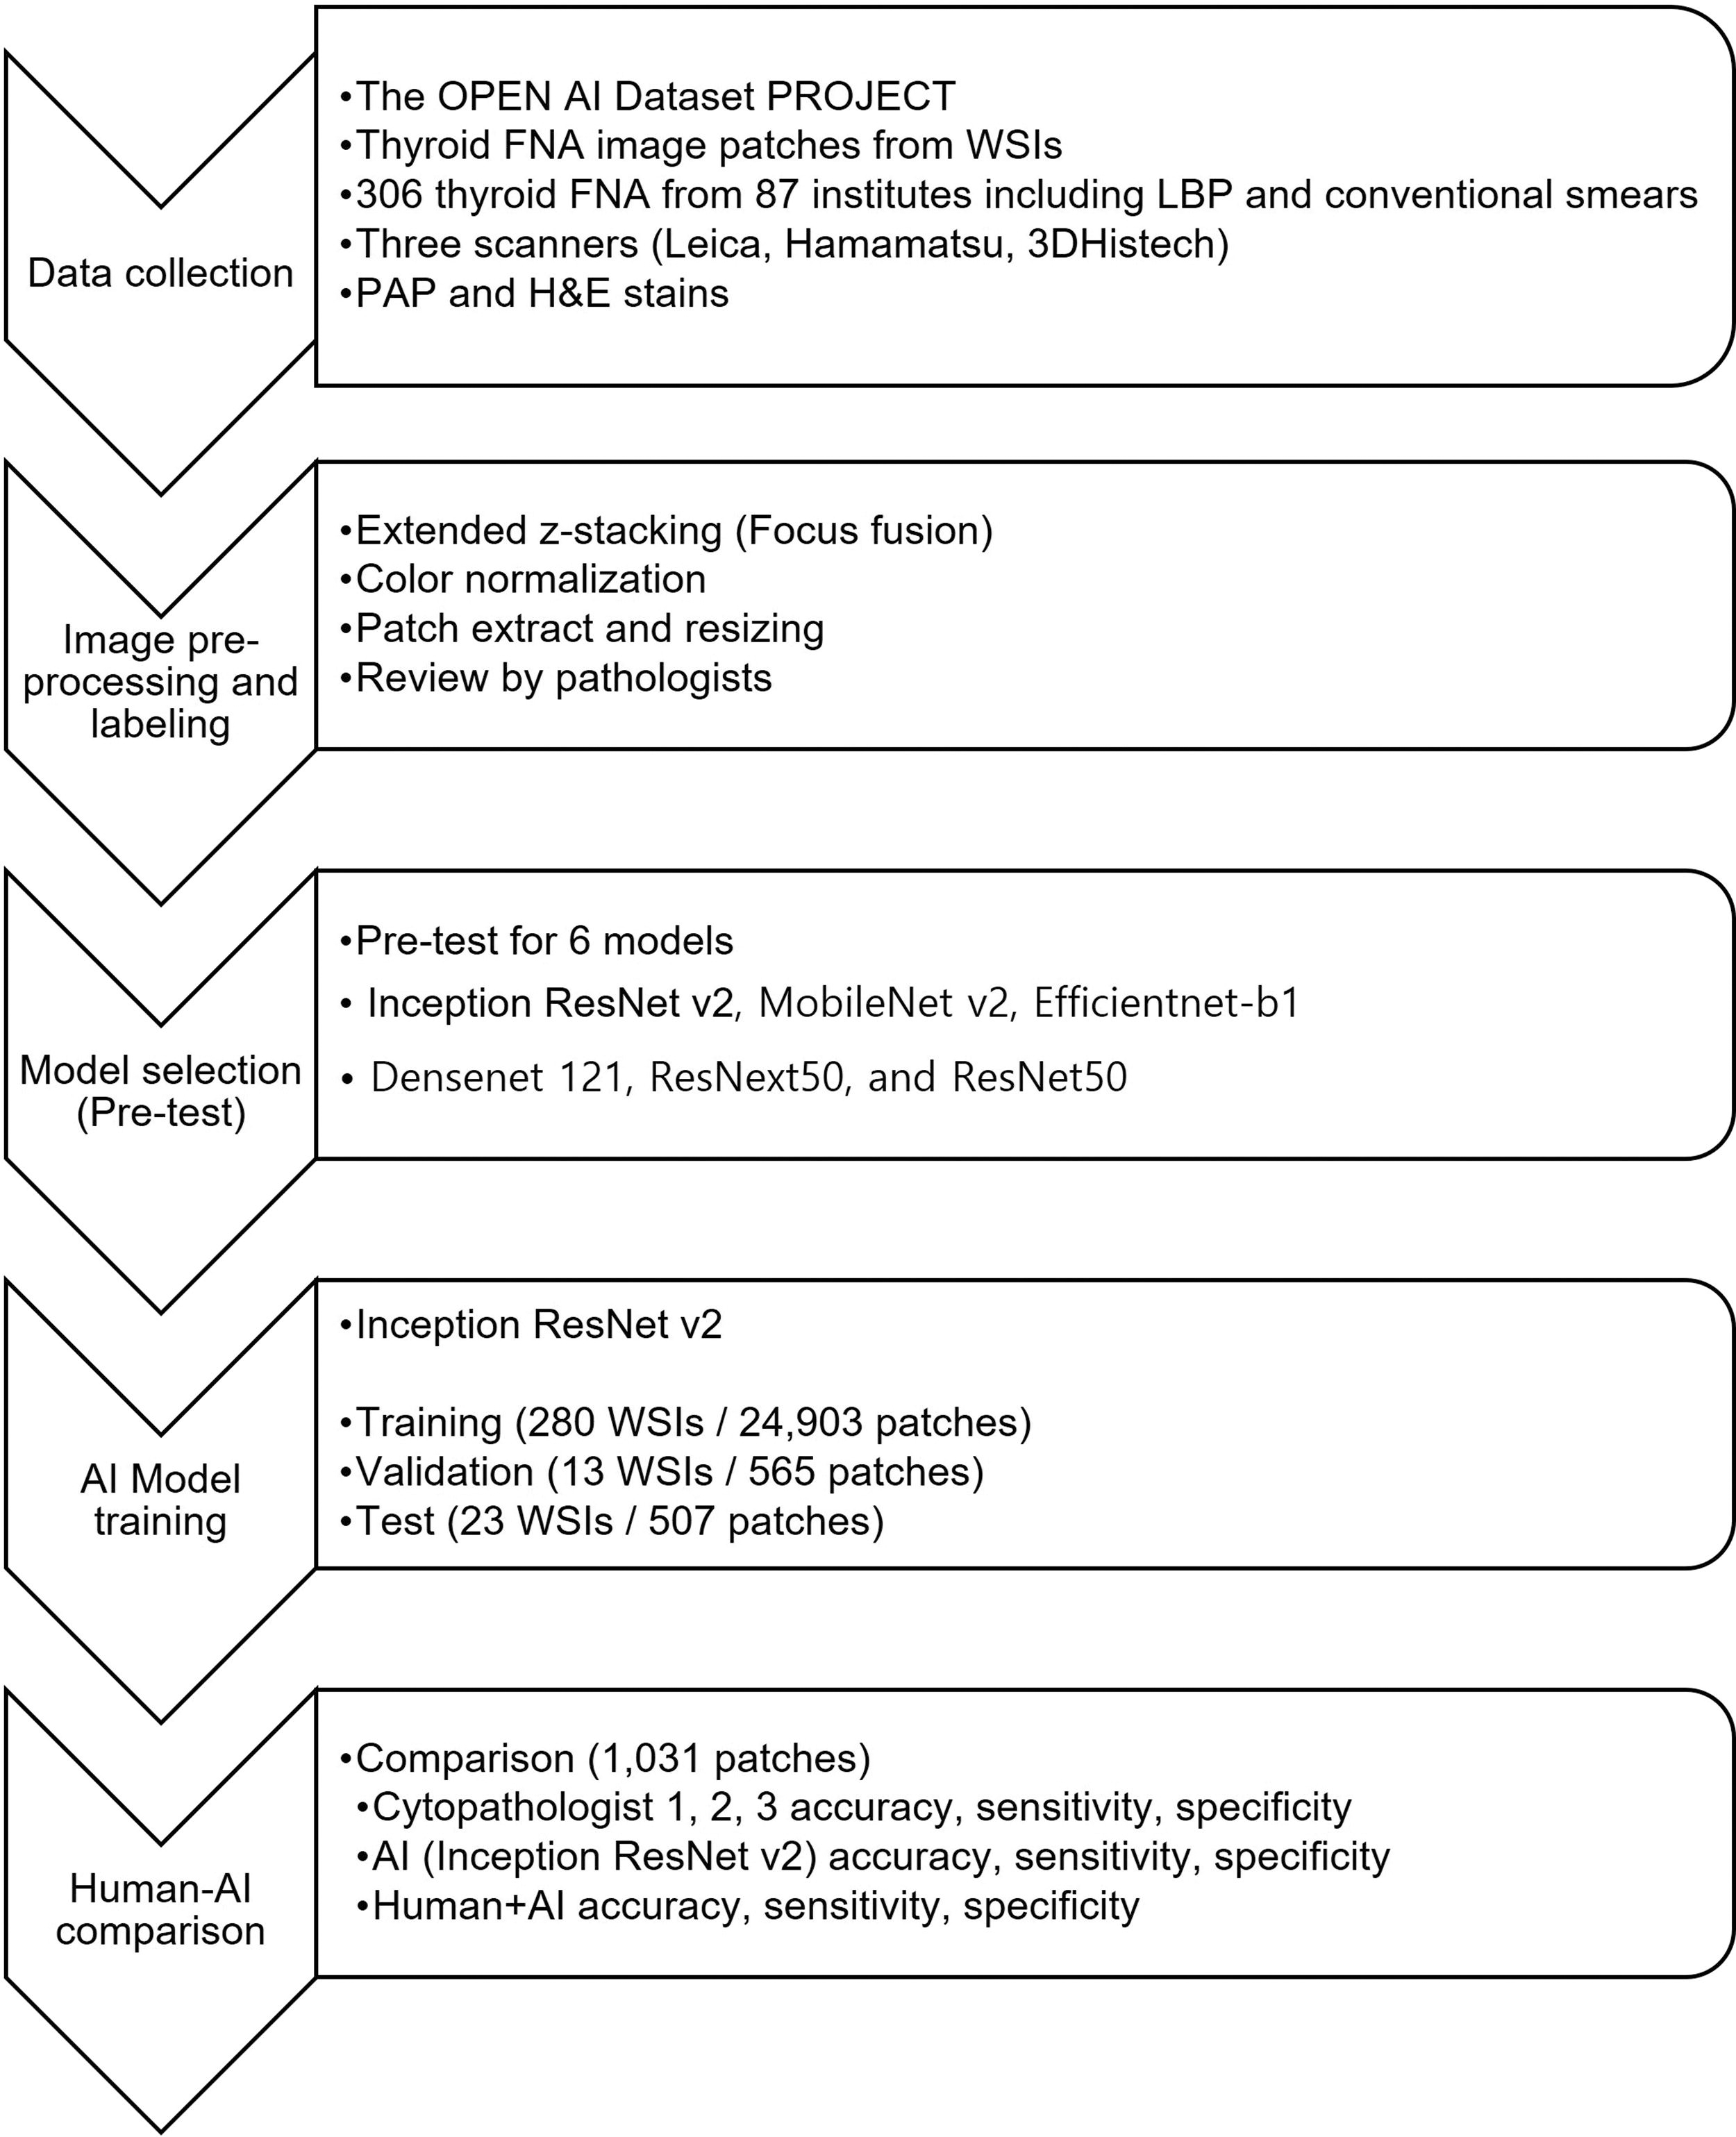
Schematic workflow of this study.
Data collection
This is a multicenter retrospective diagnostic study. Training, validation, and testing were performed using images of thyroid FNA specimens from a dataset provided by an AI research project known as “the Open AI Dataset Project” (Fig. 2). The Open AI dataset consists of digitalized images of cytopathology slides collected from 3 university hospitals and quality control slides from 215 institutions in South Korea. Because of the data imbalance, we only included papillary carcinoma but no other histological subtypes for malignant cases. The slides were scanned using AT2 (Leica Biosystems, Germany), NanoZoomer S360 (Hammatsu, Japan), and Pannoramic 250 Flash III (3DHistech, Hungary) at a ×40 objective magnification at the focal planes. Each dataset contained multiple z-stacks, with conventional smears having five layers and LBP slides having one to three layers. The selection of cytological samples was stringently managed by 12 board-certified cytopathologists and 5 cytologists. Each sample was initially confirmed to match its corresponding histological slides by the institute’s board-certified cytopathologists. Following this, another set of board-certified cytopathologists assessed the slide quality and determined their suitability for inclusion in the Open AI dataset. Subsequently, the quality of the scanned images was meticulously reviewed by another group of board-certified cytopathologists.
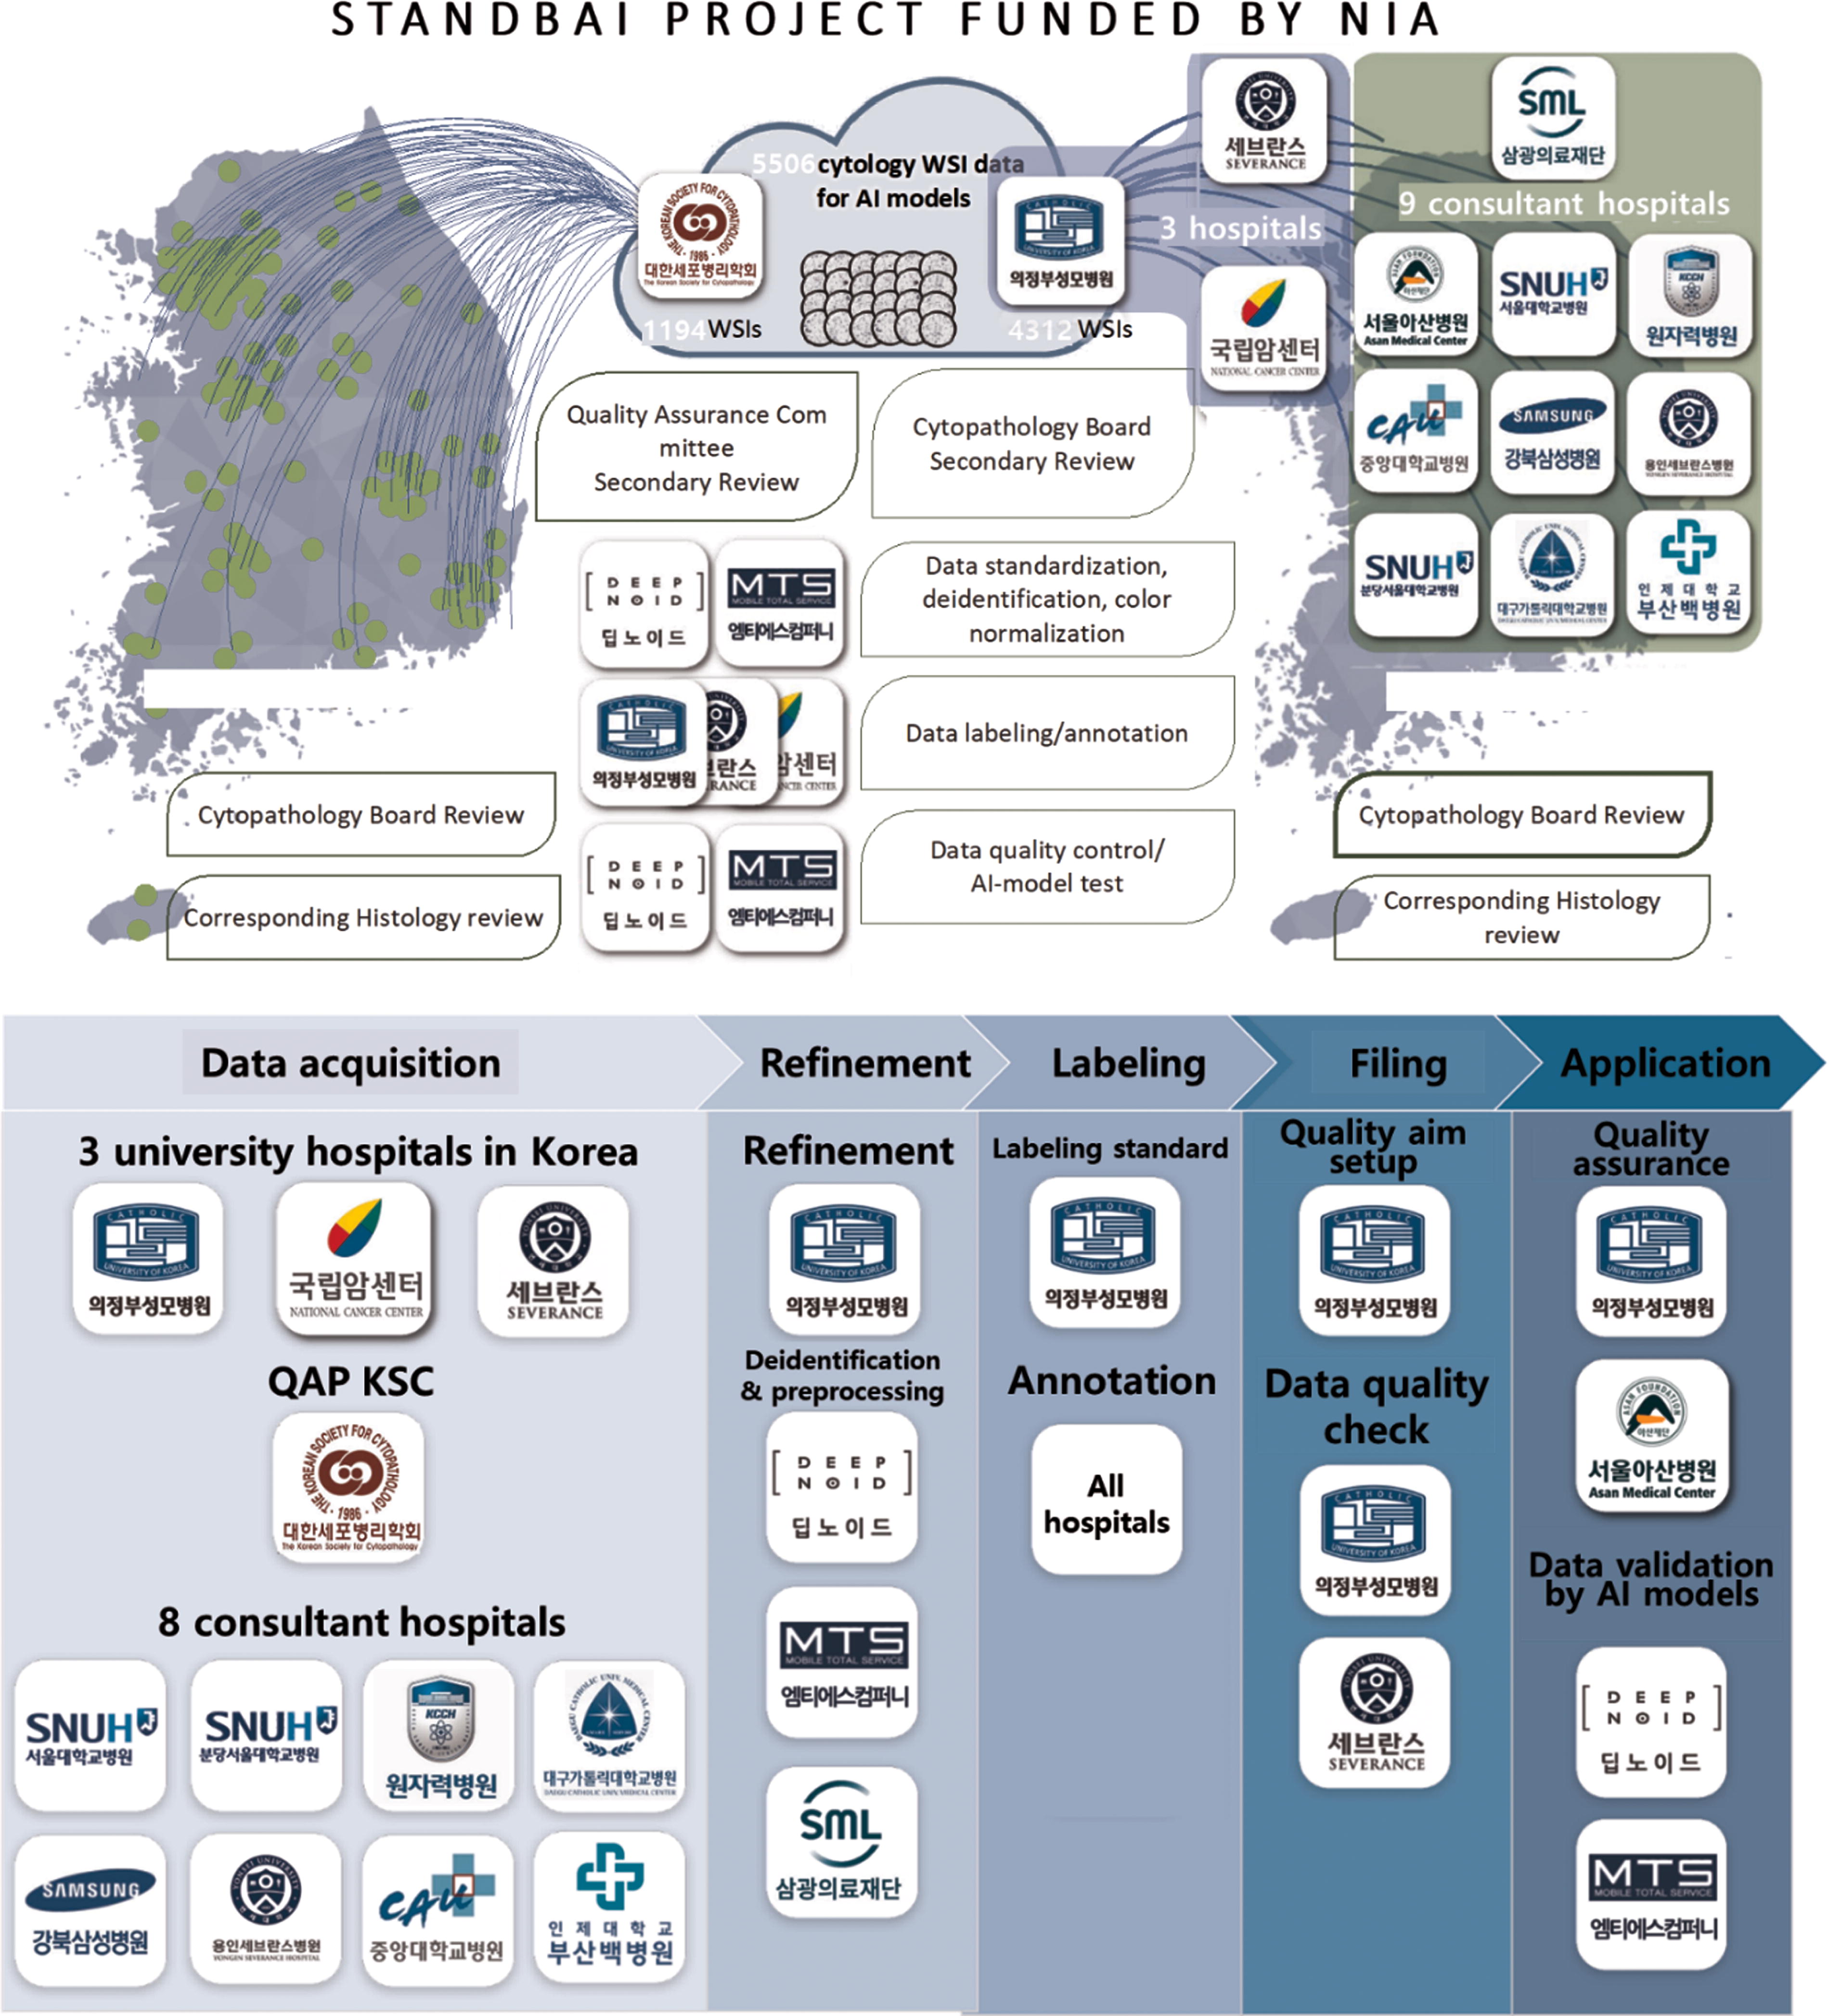
Overview of the Open AI Dataset Project.
A total of 5500 WSIs including all the non-gynecological samples such as respiratory tract, body fluid, urine, thyroid FNAs, and other FNAs were collected. 1100 WSIs of textbook cases were from quality control slides of 215 all registered cytopathology laboratories in Korea achieved for quality assurance program of the Korean Society for Cytopathology, while another 4400 WSIs of daily practice cases were collected from 12 major hospitals in Korea. Among the Open AI Dataset, we exclusively utilized thyroid FNA samples other than other types of samples for this study. We also excluded the samples that are not eligible for AI training such as bad image quality. Finally, thyroid 306 FNAs samples were collected from 86 institutions and used in this study (Supplementary Table S1). We included LBP samples as well as conventional smear, Papanicolaou-stained samples, and hematoxylin and eosin-stained samples.
From the 78 malignant WSIs, 7994 malignant image patches and 33,245 benign image patches were created. From the 228 benign WSIs, 202,345 benign image patches were created. Owing to data imbalance, all the benign patches from malignant and benign WSIs were merged, resulting in a total of 235,590 benign image patches. To address this imbalance, 227,699 benign image patches were randomly excluded. Finally, for this study, 7994 malignant and 7891 benign image patches were used for the development of the AI model.
Image preprocessing
To deal with the multiple images with different z-axis, we first generated the extended z-stack images from three to six images with different z-axis by enhanced focus-fusion technology (Fig. 3). By this process, we obtained WSIs with only one evenly focused layer for three-dimensional cell clusters. Color normalization was performed on the integrated images before patch extraction. Images were cropped and extracted as 1024 × 1024 pixel-sized image patches and resized to 256 × 256 pixels before using them as inputs for model training (Fig. 4). The image patches were evenly divided into grids from the WSIs. Each patch image was reviewed by trained cytopathologists to confirm the benign or malignant and another group of cytopathologists reviewed the labeling, and the image patches with discordant opinions were excluded from the dataset as mentioned in the prior section. Image patches with no follicular cells have been removed, and image patches with both benign and malignant follicular cells have been considered as malignant. The RAND function in Excel was utilized to assign a random number to each image patch for the selection in Microsoft Excel (Version 2021, Build. 14827.20192).

Enhanced focus-fusion processing to generate evenly perfectly focused “extended z-stack images” for three-dimensional cell clusters of the cytology samples from three to six layers of different z-axis focus.

Image preprocessing including focus fusion (extended z-stack image generation), color normalization, image patches extraction from WSIs, and resizing. WSI, whole slide image.
Image patch labeling
For the categorization of image patches, those extracted from negative samples were collected as negative image patches (Supplementary Figure 1). In contrast, patches derived from positive samples were further classified into two categories: those containing cancer cells and those without. This classification was performed by board-certified cytopathologists. Finally, to ensure the utmost accuracy and consistency, these categorized image patches underwent a further review by yet another group of board-certified cytopathologists. If there is a discordant opinion between the 1st and 2nd reviewers, the image patches were removed from the dataset. This rigorous process underscores the commitment to the highest standards of accuracy and reliability in this dataset for AI training.
From the 78 malignant WSIs, 7994 malignant image patches and 33,245 benign image patches were created. From the 228 benign WSIs, 202,345 benign image patches were created. Owing to data imbalance, all the benign patches from malignant and benign WSIs were merged, resulting in a total of 235,590 benign image patches. To address this imbalance, 227,699 benign image patches were randomly excluded. Finally, for this study, 7994 malignant and 7891 benign image patches were used for the development of the AI model.
Pretest for AI model selection
Prior to model selection, we tested six models: Inception ResNet v2, MobileNet v2, Efficientnet-b1, Densenet 121, ResNext50, and ResNet50. Subsequently, we compared their performances. The training, validation, and testing were performed using random WSI patches of 78 malignant and 88 benign cases. A total of 2351 image patches were created from the malignant and 2518 from the benign WSIs. The number of benign and malignant patches used for training, validation, and testing was adjusted similarly, and a total of 3797 image patches were used for training, 565 for validation, and 507 for testing.
AI model training
For model training, 15,975 augmented patch images were created from the dataset. The images were flipped vertically and horizontally and rotated clockwise for data augmentation. The augmented dataset included 7981 benign and 7994 malignant image patches. A total of 14,903 image patches were used for training, 565 for validation, and 507 for testing (Table 1). The performances of the AI models trained using augmented, non-augmented, and reduced datasets were also compared along with a 95% confidence interval (95% CI).
Number of Whole Slide Images (Image Patches) Used for Training, Validation, and Testing
Comparison of the performances between experts and AI model
Of the 15,975 image patches, 1031 image patches were randomly selected to compare the diagnostic accuracies of experts and the AI model. The RAND function in Excel was utilized to assign a random number to each image patch for the selection in Microsoft Excel (Version 2021, Build. 14827.20192). The diagnostic accuracy of the AI model was compared with that of three experienced cytopathologists. In addition, the diagnostic accuracy of the cytopathologists after referring to the AI results was investigated. Standard deviations were also analyzed for the comparison results.
Statistical analysis
To analyze the diagnostic agreement among pathologists, the Fleiss’ Kappa coefficient was used. The 95% CI of the Fleiss’ Kappa coefficient was also analyzed. The analysis was performed using R statistical programming (Version 3.4.1; http//www.r-project.org, accessed on May 21, 2023).
RESULTS
Data collection
A total of 306 WSIs were included in the dataset, 78 of which were malignant (papillary thyroid carcinoma) and 228 were benign (25.5% vs. 74.5%), 133 cases were the textbook cases with typical cytological features from the Quality Assurance Program slides from 85 institutions, while the other 173 cases were daily practice-level cases collected from Uijeongbu St. Mary’s Hospital and Yonsei University Severance Hospital (43.5% vs. 56.5%). Of the slides included in the dataset, 121 were hematoxylin and eosin-stained and the remaining 185 were Papanicolaou-stained (39.5% vs. 60.5%). The dataset contained 239 LBP slides, which is approximately thrice the number of conventional cytology slides (67, 78.1% vs. 21.9%). Of the 306 WSIs, 149 cases were scanned by Leica AT2, 83 by Hamamatsu, and 74 by 3DHistech scanner (48.7%, 27.1%, and 24.2%, respectively). Each WSI scan contained at least three to six z-stack layers. Supplementary Table S2 summarizes clinical and pathological information about the dataset included.
Pretest for AI model selection
Inception ResNet v2 exhibited the highest accuracy of 97.04%. MobileNet v2, Efficientnet-b1, Densenet 121, ResNext50, and ResNet50 achieved an accuracy of 95.07%, 94.67%, 95.07%, 94.28% and 95.27%, respectively. Inception ResNet v2 exhibited a high sensitivity and specificity. MobileNet v2 achieved 100% sensitivity; however, the accuracy was low because the specificity was only 90.77%. By contrast, ResNext50 exhibited the highest specificity but a relatively low sensitivity (Fig. 5).

Sensitivity, specificity, and accuracy of the convolutional neural network models in the pretest to select the best model for benign/cancer image patch classification.
AI model training
Inception ResNet v2 showed the highest accuracy when the augmented datasets were used for training (Table 2). The model obtained 99.72% (95% CI, 99.64–99.80%) accuracy, 99.87% (95% CI, 99.81–99.93%) sensitivity, and 99.58% (95% CI, 99.48–99.68%) specificity for training dataset, 97.70% (95% CI, 96.46–98.94%) accuracy, 99.57% (95% CI, 99.03–100.00%) sensitivity, and 96.37% (95% CI, 94.83–97.91%) specificity for validation dataset, and 94.87% (95% CI, 92.95–96.79%) accuracy, 100% (95% CI, 100.00–100.00%) sensitivity, and 90.41% (95% CI, 87.85–92.97%) specificity for test dataset. Examples correctly diagnosed and misdiagnosed samples by AI (Fig. 6). Result of the non-augmented and the reduced dataset is shown in Supplementary Table S3.

Representative images of malignant
Performance of Artificial Intelligence Model (Inception ResNet v2) for Training, Validation, and Test Dataset (Augmented Dataset)
The data in parentheses presents a 95% confidence interval.
Comparison of the performances between the AI model and the experts
A total of 1031 image patches were randomly selected from all datasets for comparison. The image patches included 513 negative cells and 518 malignant cells (papillary thyroid carcinoma). Three pathologists and the AI model reviewed and labeled the patches. The three pathologists showed an average sensitivity of 87.26% (95% CI, 85.22–89.30%), a specificity of 90.58% (95% CI, 88.80–92.36%), and an accuracy of 88.91% (95% CI, 86.99–90.83%). The Fleiss’ Kappa coefficient for diagnostic agreement between pathologists A, B, and C was 0.66 (95% CI, 0.63–0.68), indicating moderate agreement. The AI model showed an average sensitivity of 99.81% (95% CI, 99.54–100.00%), a specificity of 99.61% (95% CI, 99.23–99.99%), and an accuracy of 99.71% (95% CI, 99.38–100.00%). Examples of images diagnosed differently by the pathologists and the AI model are shown in Figure 7. After referring to the diagnostic results obtained by the AI model, the diagnostic accuracy of the three pathologists increased to 95.76% (95% CI, 94.53–96.99%). The sensitivity and specificity increased to 95.24% (95% CI, 93.94–96.54%) and 96.30% (95% CI, 95.15–97.42%), respectively (Fig. 8). The Kappa coefficient for diagnostic agreement between pathologists also increased from 0.66 (95% CI, 0.63–0.68) to 0.86 (95% CI, 0.83–0.88), indicating very good agreement.
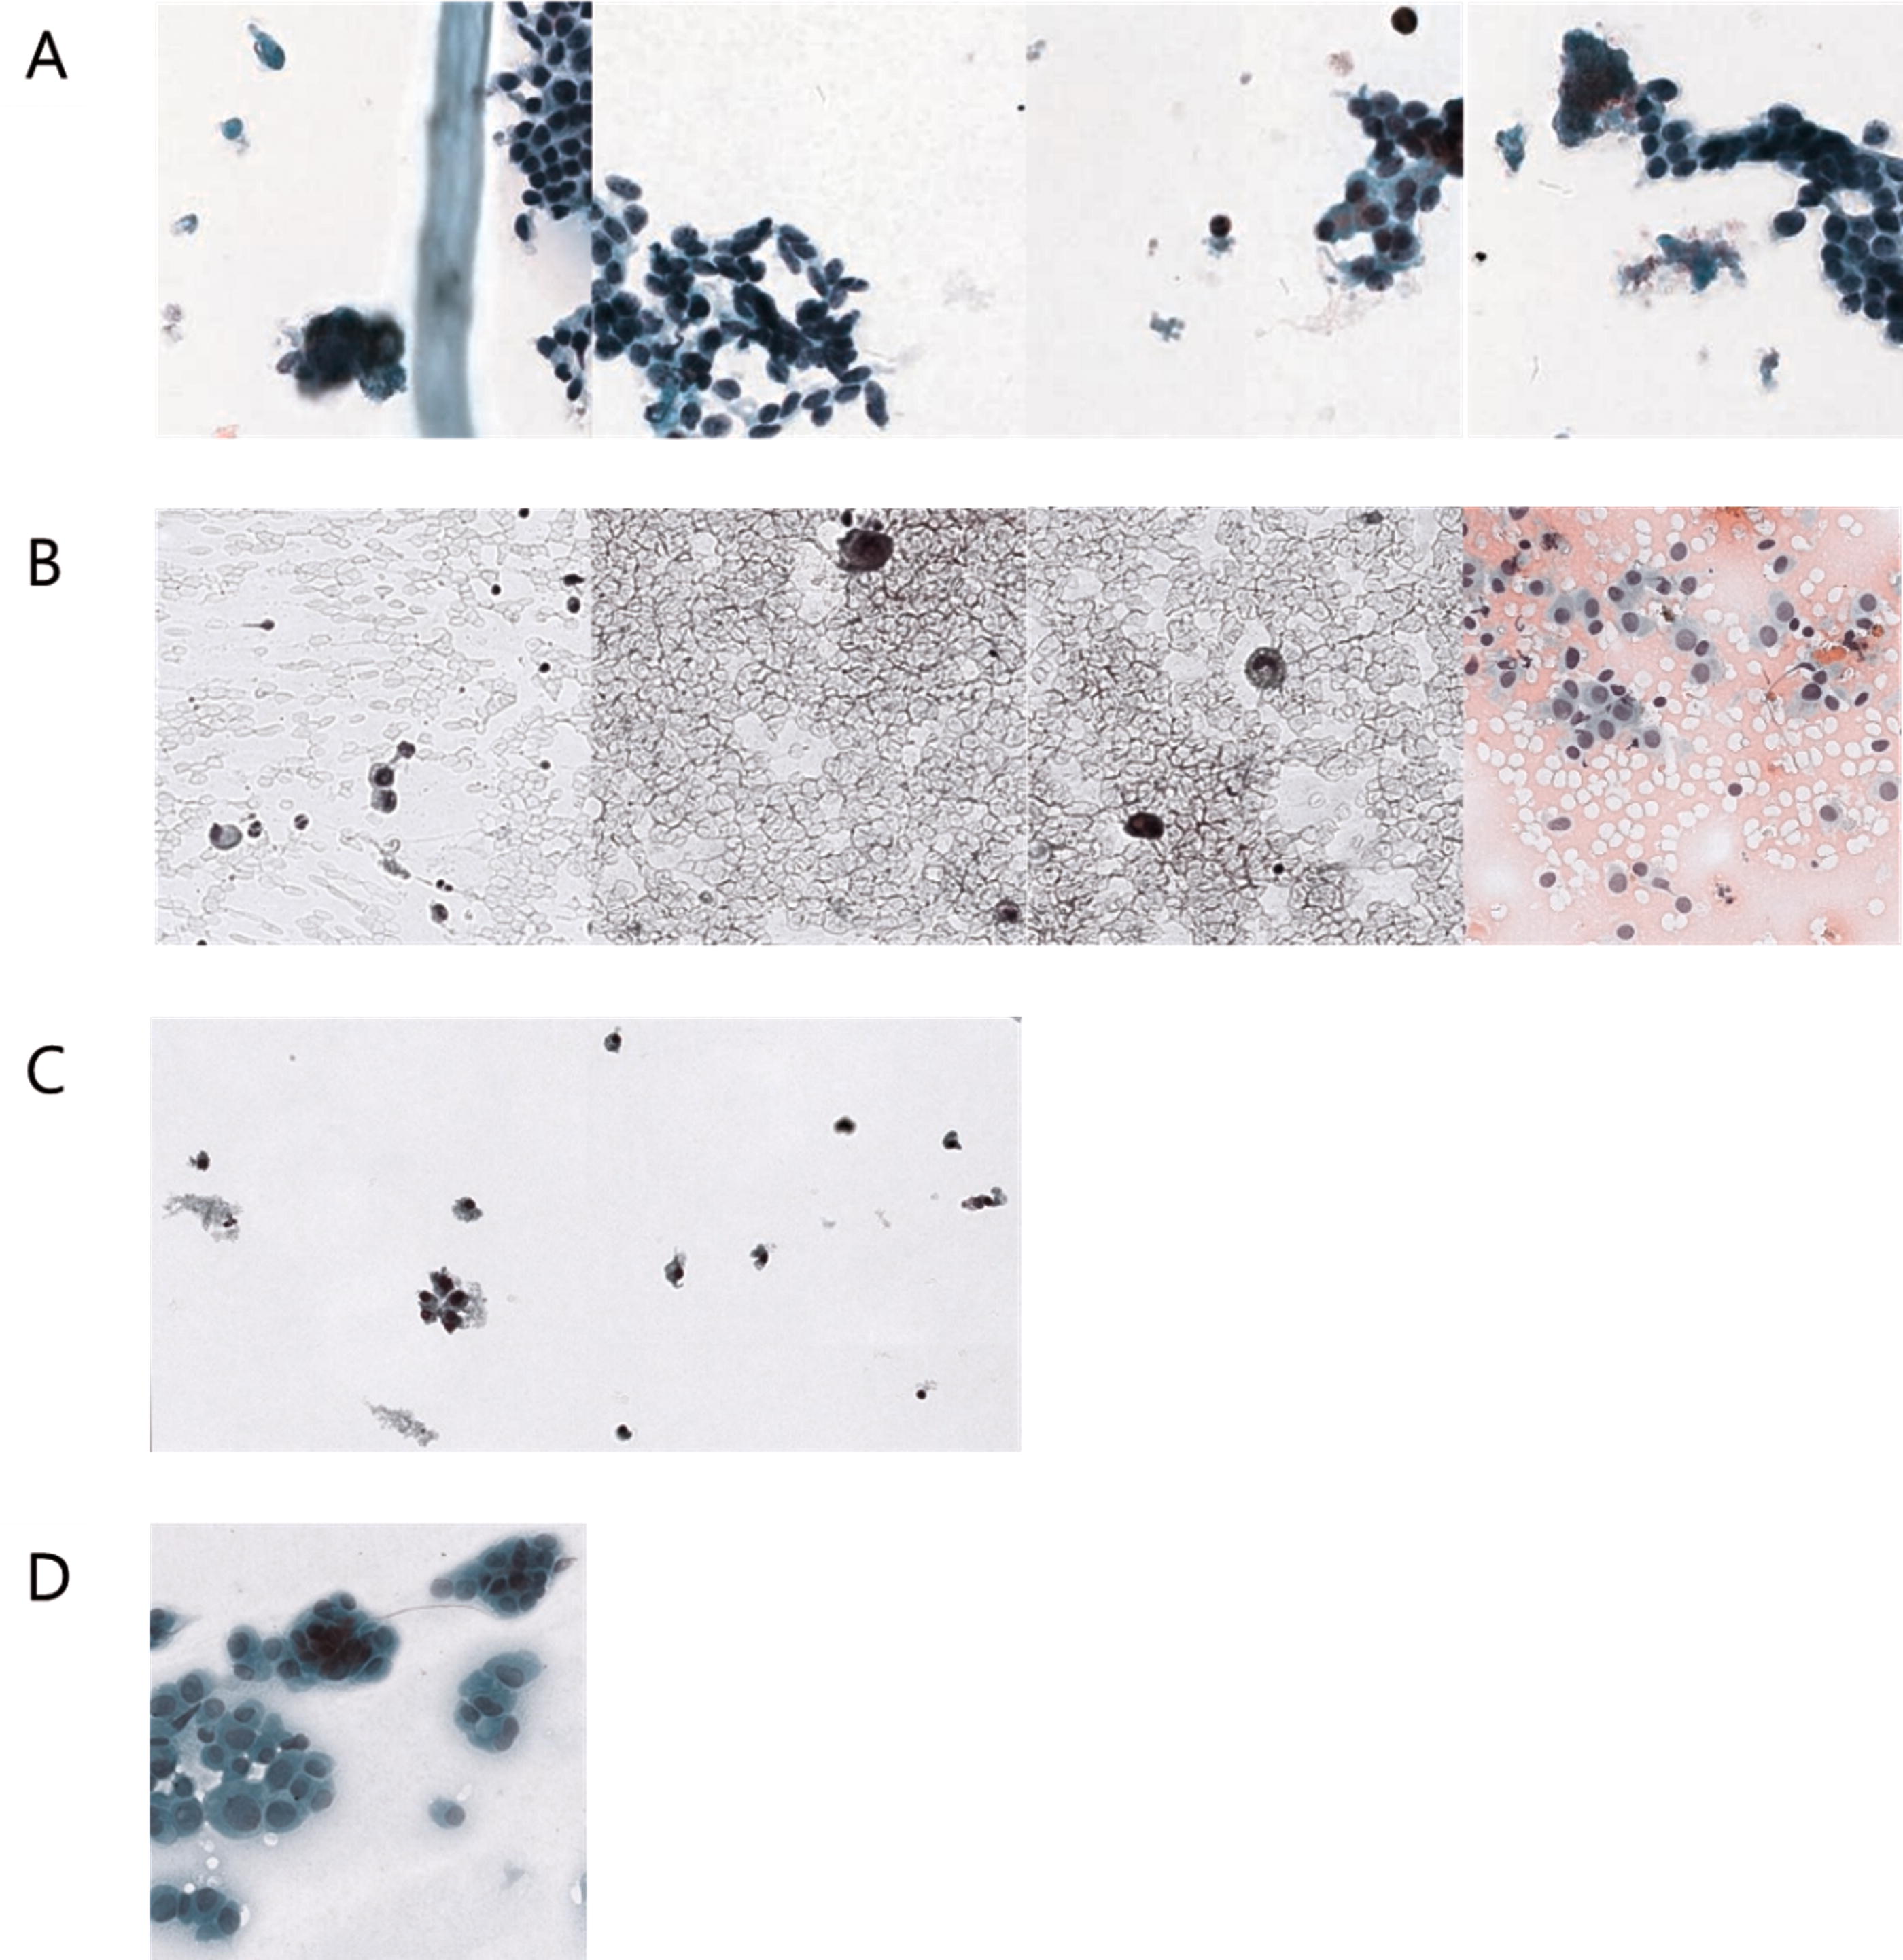
Representative images classified differently by the cytopathologists and the AI model. AI correctly diagnosed benign

Comparison of the performances between the human cytopathologists and AI model. In addition to displaying the sensitivity, specificity, and accuracy results for humans and their combination with AI, the figure also presents the standard deviation.
Discussion
This study developed an AI model, which exhibited a competitive performance with an accuracy of 99.7%, using 15,975 thyroid image patches obtained from 306 WSIs. The image patches were collected from approximately 200 hospitals nationwide with the help of the Korean Society for Cytopathology and 3 major institutions participating in the Open AI Dataset Project. The accuracy of the AI model was higher than that of the pathologists (99.71% vs. 88.91%). In addition, the diagnostic accuracy of the pathologists was improved upon referring to the AI results.
The slides included in the dataset were collected nationwide. To include a sufficient number of z-stacks in the image and reduce the data-storage space required by the z-stacks, at least three layers were integrated to create an extended z-stack image. Previous studies have reported that utilizing a z-stack was difficult because it required a large storage space. 19 Many studies either avoided using any z-stack images or used only the middle layer of complete images 19,25,26 ; however, multifocus images must be analyzed to increase the accuracy of diagnosis based on cytology slides. Image integration can be applied to obtain clear images of multiple foci without necessitating large capacities. There are a recent technical advances in the scanning technology for cytology such as volumetric scanning by Hologic (Marlborough, MA), multicamera image capture and focus-fusion technology by Vieworks (Anyang, Republic of Korea), and pixel level z-scanning technology by Pramana, Inc. (Morrisville, North Carolina). 27,28 This new technique will revolutionize the practical application of digital cytology and the use of AI.
Although the revised College of American Pathologists guideline regarding the validation of cytology for diagnostic purposes indicates insufficient evidence supporting the use of digital cytology for primary diagnosis, recently, many efforts have been made to strengthen the idea of the role of digital cytology and AI. 29 –31 Recent studies using AI technology on thyroid FNAs have shown very promising results in addition to the gynecological cytology screening AI software that were recently introduced in the market with CE mark and FDA approval by several companies, such as Hologic (Genius Digital Diagnostic System, USA), TechCyte (UT, USA), Datexim (CytoProcessor, France), Cell Solutions (BestCyte Cell Sorter Imaging System, USA), Landing Med (China), and KF Bio (China). 27,32 Some of these AI software adopted more advanced scanning technology that enhanced the scanning speed and image quality such as volumetric scanning by Hologic (Marlborough, MA), multicamera focus-fusion technology by Vieworks (Anyang, Republic of Korea), and pixel level z-stacking by Pramana, Inc. (Morrisville, North Carolina). 28 These changes show the possibility of fundamental changes in digital cytology and the potential application of AI soon.
Our model showed the best diagnostic performance of 99.71% accuracy in the thyroid FNAs among all the previous published studies. 39 –45 The highest accuracy reported for the cytological classification of thyroid nodules in the previous studies is 97.66%. 21 A study in 2020 developed an artificial neural network model and obtained an accuracy of 95% using a larger number of image patches and 447 WSIs 20 (Supplementary Table S4). Among the papers reported to date, the study that utilized the largest number of samples, 908 WSIs, achieved a sensitivity of 92% and specificity of 90.5% through VGG-11, a type of convolutional neural network. 19 In a subsequent study conducted by the same authors, the performances of AI models were compared with that of expert pathologists in predicting malignancy from WSIs; the AI models and experts showed similar accuracies. 26 Interestingly, the performances of the AI models improved and the diagnosis became similar to that of the experts when the models underwent a fully supervised training to identify the region of interest.
In this study, the diagnostic accuracy of the AI model was significantly higher than that of the experts, and the diagnostic accuracy of the experts improved after referring to the AI results. Previous studies have compared human and AI performance and assessed diagnostic agreement with screeners, 26 however, this is the first study to evaluate how diagnostic accuracy changes when humans refer to AI results. Of the 1031 image patches used for comparison, only one image patch of a malignant case was accurately diagnosed by the experts but was misdiagnosed by the AI model (Fig. 7D). As is well known, typical papillary thyroid carcinoma has nuclear features such as enlargement, elongation, crowding, irregular contours, grooves, pseudoinclusions, and chromatin clearing. 33 The case exhibited the characteristic features of typical papillary thyroid carcinoma, such as overlapping nuclei and intranuclear pseudoinclusions; however, the image patch showed relatively fine chromatin and smooth cell membrane. The AI model misdiagnosed benign nodules as malignant in two image patches. In both patches, it showed many lymphocytes and histiocytes, which might have been mistaken for malignant cells (Fig. 7C). In lymphocytic thyroiditis, the nuclei of neighboring follicular cells frequently undergo a slight enlargement and exhibit atypical features in response to chronic inflammation. This phenomenon could account for the AI model’s erroneous positive predictions. By contrast, the AI model accurately distinguished the characteristics of malignant cells with pseudoinclusions or irregular cell membranes, even in the images of regions with low cellularity (Fig. 7B). After referring to the AI’s results, the pathologists were able to identify small or fuzzy pseudoinclusions to base their judgment on. In addition, the AI model accurately diagnosed benign nodules containing clumping follicular cells, which the experts misdiagnosed as malignant nodules (Fig. 7A). In the actual benign cases where AI got the diagnosis right and the pathologist got it wrong, the confusing factors that influenced the pathologist’s judgment were features like focal overlapping nuclei, high cell density, and relatively irregular nuclear size. However, the nuclei of these cells retained a fine chromatin pattern and smooth membrane, which lacks evidence of malignancy.
While it is possible to compare images of cases for which the AI made a correct or incorrect diagnosis and assume that cells such as histiocytes would have been misdiagnosed as malignant, or a small intranuclear inclusion may have helped it diagnose the malignant cell correctly, it is actually difficult to interpret exactly what criteria the AI uses to distinguish between malignant and benign cells. In the case of this study, it’s especially hard to know which cases AI is more likely to misdiagnose, since AI got most of the diagnoses right. This makes it difficult to decide which of the AI’s judgments to trust and which not to trust. Recently, quantitative scoring methods have been attempted to develop interpretable AI, 4 and in the case of typical papillary thyroid carcinoma, we can think of ways to let the AI calculate the nuclear scoring system 33 to make a quantitative assessment or mark areas in the image that are likely to be malignant cells. However, it is important to consider that there is a trade-off between explainability and performance. 34 –37
Our study made three pathologists determine the initial diagnosis of 1031 image patches, revise their diagnoses based on the AI’s diagnosis, and then compare their results. After noting that some of their diagnoses were different from AI readings, the pathologists reviewed and revised at least one of their misdiagnoses. Referring to AI gave pathologists the opportunity to review their diagnosis in more detail if it differs from the AI’s, and ultimately contributed to improving agreement level and diagnostic accuracy. Initially, the Fleiss’ Kappa coefficient diagnostic agreement between pathologists A, B, and C was 0.66, indicating moderate agreement. Pathologist A tended to have high specificity and low sensitivity, while pathologist C had high sensitivity and low specificity (95.71%, 71.04%, 95.37%, and 85.96%, respectively, data not shown). Pathologist B’s sensitivity was higher than A’s and the same as C’s, specificity was higher than C’s and lower than A’s, and accuracy was the highest. The sensitivity, specificity, and accuracy of all three pathologists increased after referring to the AI’s diagnosis. Notably, pathologist A’s sensitivity increased to 90.73% and pathologist C’s specificity increased to 96.88% after referring to the AI’s diagnosis (data not shown). The diagnostic agreement between pathologists also increased to 0.86, indicating very good agreement. This means that AI can help calibrate pathologists’ diagnoses to increase sensitivity or specificity and reduce inter-observer variation owing to individual pathologist tendencies.
However, this study has a few limitations. We classified thyroid cell slides into only two categories, malignant and benign, without segmenting the diagnosis according to TBSRTC. The model produces highly accurate results; however, there are several limitations in categorizing cases as indeterminate lesions or FN using the model. Up to 30% of the FNA specimens were diagnosed as indeterminate. 8 In addition, because TBSRTC is not an ordinal system, the risk of misclassification and intra- or inter-observer variation are inevitable. Because indeterminate diagnosis leads to unnecessary surgery, 8 the accuracy of FNA diagnostic screening must be increased. In addition, recent studies have already focused on building AI neural networks that can identify papillary carcinoma and follicular neoplasm 19,26 ; therefore, the model employed in the present study, which only distinguishes between papillary carcinoma and benign nodules, is relatively conventional. In other words, malignancy predicted by the classifier should be evaluated for the cases that are correctly identified as atypia with undetermined significance or follicular neoplasm.
Another limitation is that the study was conducted at the image patch level, but the actual diagnosis is performed at the WSI level and is based on clinical information in routine practice, making it difficult to directly apply the results of this study to the clinical field. The performance of this AI cannot be guaranteed in situations where more comprehensive judgment is required, and external validation using external datasets, preferably WSI, unrelated to training, is required to prove its usefulness as a diagnostic tool.
To address the aforementioned limitations, it is necessary to develop an algorithm that guarantees accuracy both at the WSI level and image level. Furthermore, it would be ideal to develop a tool that can classify slide images as per the diagnostic criteria recommended by TBSRTC, such as a model that can categorize cases into atypia with undetermined significance or follicular neoplasm rather than only distinguish between the nuclei of papillary carcinoma and benign nodules. We can consider training with a setup called multiple instance learning as a way to let the AI predict a diagnosis of WSI from multiple image patches. Multiple instance learning groups multiple separated items into a single bag with a global decision and requires semi-supervised learning, which uses less training effort and is considered to be optimized for methodologies such as ours 38 ; however, literature has shown that multiple instance learning has lower accuracy than the methods using supervised learning. 25 Further studies are needed to address these challenges.
Conclusion
We have successfully developed an AI model that distinguishes the malignant papillary thyroid carcinoma from benign lesions using image patches from FNA cytology slides of thyroid nodules. The model helped improve the diagnostic accuracy of expert pathologists. This study is significant in that it used datasets collected from multiple nationwide institutions, utilized images including multiple z-stacks, showed a high accuracy rate of 99.7%, and helped improve the diagnostic accuracy of expert pathologists. The performance in WSI prediction cannot be guaranteed, and the results are based on classification into only two categories, benign and malignant, rather than a diagnosis based on TBSRTC categories, which remains a challenge and should be addressed in future research.
Footnotes
Acknowledgments
We thank Ms. In Park (CUK), Dr. Ah Reum Kim (CUK), Dr. Seona Shin (National Cancer Center [NCC]), Dr. Na Young Han (NCC), Dr. Joon Young Shin, and Dr. Ms. Sook Hee Kang for their data collection, retrieval, management, annotation, and quality checks. We used datasets from The Open AI Dataset Project (AI-Hub, South Korea). All data information can be accessed through “AI-Hub (![]() )”.
)”.
Authors’ Contributions
Conceptualization: G.G., C.W.Y., H.J.C., and Y.C. Methodology: G.G., C.W.Y., H.J.C., and Y.C. Software: Y.C. Validation: Y.L., M.R.A., H.P., K.Y., K.J.S., G.H., D.K., Y.C., G.G., N.H.C., C.W.Y., H.J.C., and Y.C. Formal analysis: Y.L., M.R.A., H.P., K.Y., K.J.S., G.H., D.K., Y.C., G.G., N.H.C., C.W.Y., H.J.C., and Y.C. Investigation: Y.L., M.R.A., H.P., K.Y., K.J.S., G.H., D.K., Y.C., G.G., N.H.C., C.W.Y., H.J.C., and Y.C. Resources: Y.C. Data curation: Y.L., M.R.A., H.P., K.Y., K.J.S., G.H., D.K., Y.C., G.G., N.H.C., C.W.Y., H.J.C., and Y.C. Writing and original draft preparation: Y.L., H.J.C., and Y.C. Writing—review and editing: Y.L., M.R.A., H.P., K.Y., K.J.S., G.H., D.K., Y.C., G.G., N.H.C., C.W.Y., H.J.C., and Y.C. Visualization: Y.L., H.J.C., and Y.C. Supervision: H.J.C. and Y.C. Project administration: Y.C. All the authors have read and agreed to the published version of the article.
Data Availability Statement
The data presented in this study are available on request from the corresponding author.
Author Disclosure Statement
The authors declare no conflicts of interest.
Funding Information
Supplementary Material
Supplementary Figure S1
Supplementary Table S1
Supplementary Table S2
Supplementary Table S3
Supplementary Table S4