
Abstract
Background:
Thyroid disorders are associated with various dietary factors and nutritional elements. The aim of this study was to investigate the relationships between dietary vitamin E intake and the prevalence of thyroid dysfunction and thyroid antibody positivity using data from the National Health and Nutrition Examination Survey (NHANES) database.
Methods:
Data from the NHANES database collected between 2007 and 2012 were analyzed. A total of 7,773 nonpregnant adults without preexisting thyroid diseases and possessing complete thyroid and vitamin E data were included in the study. The participants were categorized into tertiles based on their dietary vitamin E intake: the lowest group (T1: ≤4.53 mg), the intermediate group (T2: 4.54–8.10 mg), and the highest group (T3: ≥8.11 mg). We used a complex multistage probability sampling design in conjunction with R software. We compared thyroid indices, the prevalence of overt and subclinical hyperthyroidism or hypothyroidism, and the occurrence of thyroid antibody positivity among the three groups based on vitamin E intake. Weighted multinomial logistic regression was used to assess the association between dietary vitamin E intake and thyroid disorders. Restricted cubic splines (RCSs) were used to explore potential nonlinear associations.
Results:
The prevalence rates of subclinical hypothyroidism (SCH) were 3.63%, 3.07%, and 1.85% in T1, T2, and T3, respectively, indicating a decreasing trend (P-trend = 0.013). In the general population, high vitamin E intake (T3) was significantly associated with a lower prevalence of SCH (OR = 0.28, CI = 0.15–0.54, p < 0.001). Subgroup analysis revealed a more pronounced protective effect in males, with both moderate (T2, OR = 0.45, CI = 0.23–0.87, p = 0.020) and high (T3, OR = 0.19, CI = 0.09–0.39, p < 0.001) dietary vitamin E intake being associated with a lower prevalence of SCH. In addition, moderate (T2, OR = 0.59, CI = 0.37–0.93, p = 0.024) and high (T3, OR = 0.52, CI = 0.36-0.75, p < 0.001) dietary vitamin E intake was associated with a lower prevalence of autoimmune thyroiditis (AIT) in males. However, no significant association was observed among females.
Conclusion:
The findings of this study suggest that a higher intake of vitamin E is associated with lower prevalence rates of SCH and autoimmune thyroiditis among males.
Introduction
Thyroid disease is closely related to diet and nutritional factors. Studies have indicated that adequate intake or supplementation of various vitamins and trace elements, such as vitamin D, vitamin A, and selenium, is associated with beneficial effects on thyroid disease. 1 –3 However, clinical practice guidelines lack clear dietary recommendations for patients with autoimmune thyroid disease and thyroid dysfunction.
Vitamin E, a lipid-soluble antioxidant, has various beneficial effects, including antioxidant, anti-inflammatory, antiproliferative, antiangiogenic, and immunoregulatory effects. 4 –6 A recently published umbrella review of meta-analyses demonstrated that the intake of vitamin E was inversely associated with multiple health outcomes, including multiple types of cancer, cardiovascular disease, metabolic syndrome, fracture, and cognitive impairment. 7 The estimated average requirement (EAR) for vitamin E is 12 mg/day, and the recommended dietary allowance (RDA) is 15 mg/day. 8 –10 However, inadequate intake of vitamin E is prevalent according to the National Health and Nutrition Examination Survey (NHANES) data. 10
For thyroid disorders, supplementation with vitamin E, with or without levothyroxine, alleviated damage to myocardial, hepatic, and renal cells and neurons in hypothyroid animal models by reducing oxidative substances. 11 –15 However, population studies investigating the relationship between dietary vitamin E intake and the prevalence of thyroid dysfunction are at present lacking. The aim of the present study was to explore the associations between dietary vitamin E intake and the prevalence of thyroid dysfunction and thyroid antibody positivity using NHANES data from 2007 to 2012.
Materials and Methods
Study population
Our study utilized NHANES database data from the following three survey cycles: 2007–2008, 2009–2010, and 2011–2012. The NHANES is a nationally representative survey designed with a multistage, stratified sampling approach. All participants were subjected to thorough home visits and physical examinations, focusing on evaluating the health and nutritional status of the noninstitutionalized civilian population in the United States. Ethical approval for the NHANES study was granted by the Institutional Review Board of the National Center for Health Statistics (NCHS), and all participants provided informed consent before taking part in the survey. Detailed information about the survey, sampling procedures, and laboratory tests is available on the official website (http://www.cdc.gov/nchs/nhanes).
We integrated the data based on the unique “SEQN” variable assigned to each participant. Initially, there were a total of 30,442 individuals in the NHANES 2007–2012. We excluded individuals who (1) were younger than 18 (n = 11,823), (2) were pregnant (n = 182), (3) had a history of thyroid disease (n = 1,663) or thyroid cancer (n = 2) (based on their medical condition questionnaire), and (4) had incomplete information on thyroid function indicators (n = 8,587) or dietary vitamin E intake (n = 412). Ultimately, the final analysis included 7,773 unique participants, and the participant flow is shown in Figure 1.
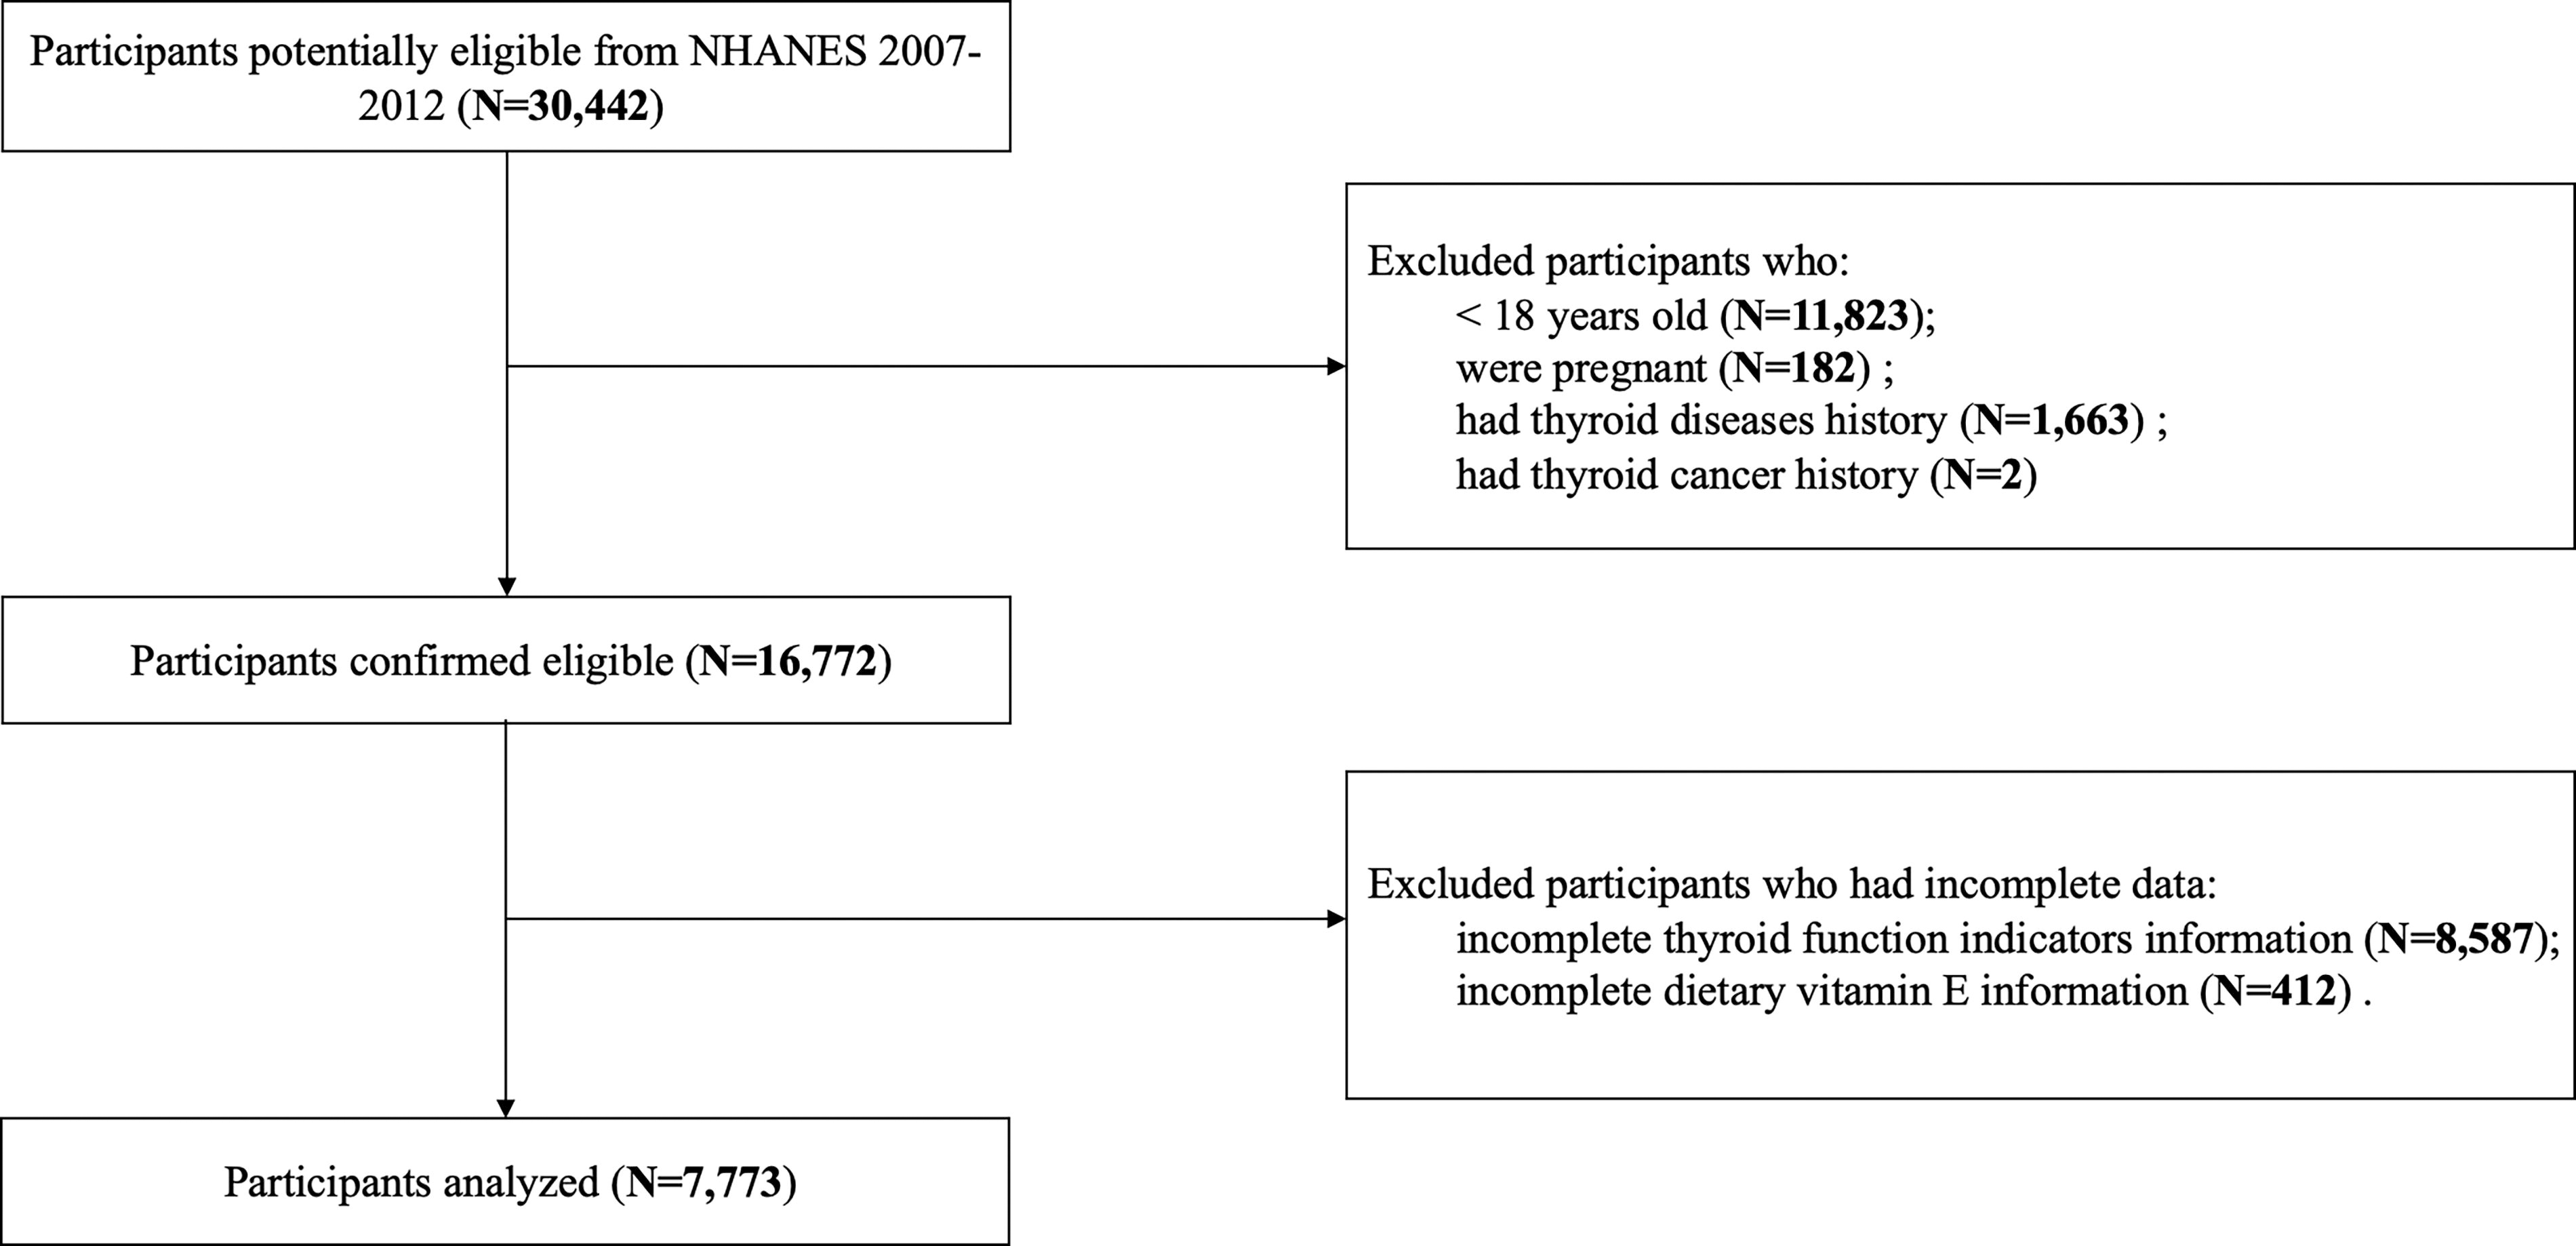
Participant flow diagram.
Diagnostic criteria
The measurement of serum thyroid hormones was conducted according to the following assay methods. The free triiodothyronine (fT3), total triiodothyronine (TT3), and total thyroxine (TT4) concentrations were measured by competitive binding immunoenzymatic assays; the free thyroxine (fT4) concentration was measured by a two-step enzyme immunoassay; and the thyroid-stimulating hormone (TSH) concentration was measured by a third-generation two-site immunoenzymatic assay. Thyroid peroxidase antibody (TPOAb) and thyroglobulin antibody (TgAb) titers were measured using the Beckman Access2 Immunoassay System. The normal range for TSH, fT4, and fT3 was defined as 0.39–4.6 mIU/L, 9–25 pmol/L, and 2.5–3.9 pg/mL, respectively, according to the reference established by previous NHANES studies. 16 –19 TPOAb positivity was defined as ≥9 IU/mL, while TgAb positivity was defined as ≥4 IU/mL. 20,21 Autoimmune thyroiditis (AIT) was defined as positivity for TPOAb or TgAb. The specific diagnostic criteria 20,21 for various thyroid disorders are provided in Table 1. A threshold of 4.5 mIU/L was established for elevated TSH levels, in accordance with the findings reported by Hollowell et al. 17 and recommendations from clinical practice guidelines. 19
Diagnostic Criteria for Thyroid Disorders
AIT, autoimmune thyroiditis; fT3, free triiodothyronine; fT4, free thyroxine; TgAb, thyroglobulin antibodies; TPOAb, thyroid peroxidase antibodies; TSH, thyroid-stimulating hormone.
Dietary vitamin E intake assessment
In the two 24-hour dietary recall interviews in the NHANES, the first 24-hour data were collected by individuals at the Mobile Examination Center (MEC), while the second 24-hour data were gathered via telephone 3–10 days later. To avoid errors resulting from recall bias, we included only the dietary vitamin E intake data from the first 24-hour period to ensure accuracy. 22,23 We utilized the sum of “vitamin E as alpha-tocopherol” and “added alpha-tocopherol (vitamin E)” to represent the total intake of vitamin E. The dietary vitamin E intake was divided into tertiles to classify the participants into the following groups: the lowest group (T1: ≤4.53 mg), the intermediate group (T2: 4.54–8.10 mg), and the highest group (T3: ≥8.11 mg).
Other covariates
The covariates included age, sex (male, female), race (non-Hispanic white, others), body mass index (BMI < 25 kg/m2: underweight and healthy weight; BMI ≥ 25 kg/m2: overweight and obese), education status 24,25 (< high school, high school, > high school), and household income 24,26 (FPL: family income to poverty ≤1.3, 1.3–3.5, and ≥3.5). Smoking status was categorized as nonsmoker (<100 cigarettes smoked during participant’s lifetime) or smoker (≥100 cigarettes smoked during participant’s lifetime). Individuals were classified as nondrinkers (0 alcoholic drinks per week) or drinkers. Participants were classified into three subgroups based on the urinary iodine concentration (UIC): deficient (<100 μg/L), adequate (100–300 μg/L), and excessive (≥300 μg/L). 27,28
Statistical analyses
The complex weighting of NHANES data was performed by the “survey” package in R. According to the recommendations on the NHANES official website, we merged the data based on the SEQN for each participant. Relevant information can be found online (https://www.cdc.gov/nchs/tutorials/nhanes-cms/determine/merge.html). In the final cohort we included, we performed a duplicate value query on the SEQN using R language, and no duplicate participants were identified in our actual analysis. The general population was divided into tertiles based on dietary vitamin E intake. Continuous variables are presented as the mean ± standard error (SE), while categorical variables are expressed as percentages [confidence intervals (CIs)]. We assessed linear trends by calculating the P-trend using unadjusted linear regression. Weighted logistic regression models were used to investigate the association between dietary vitamin E intake and thyroid dysfunction, with the lowest group (T1) serving as the reference group. Model 1 was unknot adjusted for any covariates. Model 2 was adjusted for age, sex, and race, and Model 3 was adjusted for age, sex, race, BMI, education status, household income, smoking status, drinking status, and the UIC. To ascertain the robustness of our findings, we repeated the analysis with a cutoff value of 4.6 mIU/L for TSH as sensitivity analysis.
The nonlinear relationship was evaluated by a restricted cubic spline (RCS) with five knots. This analysis was also adjusted for age, sex, race, BMI, education status, household income, smoking status, drinking status, and the UIC. Sensitivity analysis was conducted by analyzing the interaction between vitamin E concentration and several confounding factors and by stratified analyses of the confounding factors exhibiting interactions. p-Value < 0.05 was considered to indicate statistical significance and was reported with three decimal places, while nonsignificant p-values were indicated with two decimal places. All the statistical analyses were conducted using R version 4.3.0.
Results
Subjects and demographic characteristics
A total of 7,773 subjects were included in the study. The average dietary intake of vitamin E among the general population was 8.60 mg/day, with only 11.80% of participants meeting the RDA for vitamin E. The population was divided into the following three tertiles based on dietary vitamin E intake: T1 (≤4.53 mg), T2 (4.54–8.10 mg), and T3 (≥8.11 mg). Table 2 presents the detailed demographic characteristics of the subjects in the different vitamin E intake groups, while Supplementary Table S1 provides demographic information categorized by sex.
Baseline Characteristics of the Subjects Based on Dietary Vitamin E Intake Tertiles
T1 (≤ 4.53 mg), T2 (4.54 mg to 8.10 mg), and T3 (≥ 8.11 mg).
Mean ± SE for continuous variables: The p-value was calculated by the weighted nonparametric test.
Weighted % (confidence interval) for categorical variables: The P-trend was calculated through unadjusted linear regression. The P difference was calculated by the weighted chi-square test.
BMI, body mass index; GED, general educational development test; T1, lowest dietary vitamin E intake tertile group; T2, intermediate dietary vitamin E intake tertile group; T3, highest dietary vitamin E intake tertile group; UIC, urinary iodine concentration.
Thyroid disorder prevalence and thyroid indicators
The thyroid hormone levels and thyroid disorder prevalence based on dietary vitamin E intake tertiles are shown in Table 3. The prevalence of subclinical hypothyroidism (SCH) was 3.63% (CI = 2.49%–5.00%) in T1, 3.07% (CI = 2.07%–4.00%) in T2, and 1.85% (CI = 1.20%–3.00%) in T3, showing a downward trend (P-trend = 0.013). In addition, we identified significant intergroup differences (P 13 < 0.001, P 23 = 0.016). The prevalence of overt hypothyroidism was 1.21% (CI = 0.64%–2.00%) in T1, 1.01% (CI = 0.46%–2.00%) in T2, and 0.52% (CI = 0.30%–1.00%) in T3, showing a downward trend (P-trend = 0.021). The AIT prevalence was 13.30% (CI = 11.80%–15.00%) in T1, 11.40% (CI = 9.60%–13.00%) in T2, and 11.39% (CI = 9.76%–13.00%) in T3 (P-trend = 0.09). The mean ± SE of TSH in T1, T2, and T3 was 1.94 ± 0.04 mIU/L, 1.93 ± 0.07 mIU/L, and 1.83 ± 0.03 mIU/L, respectively (P-trend = 0.021, P 23 = 0.024). The titers of TPOAb, TgAb, TT4, and thyroglobulin also showed a significant downward trend (Table 3). The prevalence of thyroid disorders and thyroid indices based on dietary vitamin E intake tertiles for different sexes is presented in Supplementary Table S2. Among males, the prevalence rates of SCH in T1, T2, and T3 were 4.56%, 3.45%, and 1.73%, respectively (P-trend = 0.003), indicating a decreasing trend. However, among females, the prevalence was 2.92%, 2.68%, and 2.02%, respectively (P-trend = 0.30). The prevalence rates of overt hypothyroidism in males were 1.05%, 1.09%, and 0.38% in T1, T2, and T3, respectively (P-trend = 0.026). Among females, the rates were 1.32%, 0.9%, and 0.73%, respectively (P-trend = 0.30), indicating no significant trend. For the prevalence of AIT, there was a decreasing trend in males across T1, T2, and T3, with rates of 11.78%, 8.22%, and 8.13%, respectively (P-trend = 0.013). Among females, the prevalence of AIT in T1, T2, and T3 was 14.40%, 14.50%, and 16.60%, respectively (P-trend = 0.21). There was no significant difference observed in the prevalence of subclinical hyperthyroidism or other thyroid indices among the tertile groups. The prevalence of overt hyperthyroidism could not be determined due to the small sample size.
Thyroid Indicators and Prevalence of Thyroid Disorders Based on Dietary Vitamin E Intake Tertiles
T1 (≤ 4.53 mg), T2 (4.54 mg to 8.10 mg), and T3 (≥ 8.11 mg).
P-group comparison*: The Bonferroni correction method was applied for multiple comparisons among different groups based on dietary vitamin E intake. A Bonferroni-corrected p-value of 1 indicated that no significant differences were detected. P12: Comparison between T1 and T2; P23: Comparison between T2 and T3; P13: Comparison between T1 and T3.
Overt hyperthyroidism*: Due to the small sample size of only three patients with overt hyperthyroidism, statistical analysis could not be conducted.
Mean ± SE for continuous variables; P difference was calculated via a weighted nonparametric test.
Weighted% (confidence interval) for categorical variables; P difference was calculated via the weighted chi-square test.
The P-trend value for all variables was calculated through unadjusted linear regression, and the P-group comparison value was calculated using Bonferroni correction.
T1, lowest dietary vitamin E intake tertile group; T2, intermediate dietary vitamin E intake tertile group; T3, highest dietary vitamin E intake tertile group; TSH, thyroid-stimulating hormone; fT4, free thyroxine; fT3, free triiodothyronine; TT4, total thyroxine; TT3, total triiodothyronine; TPOAb, thyroid peroxidase antibody; TgAb, thyroglobulin antibody. (The order is arranged according to the sequence in the table.)
Weighted multiple logistic regression was conducted to examine the association between thyroid disorder prevalence and different levels of dietary vitamin E intake (Table 4). According to both Model 1 and Model 2, T3 was associated with lower prevalence rates of SCH (Model 1: OR = 0.49, CI = 0.29–0.82, p = 0.007; Model 2: OR = 0.44, CI = 0.25–0.76, p = 0.004) and overt hypothyroidism (Model 1: OR = 0.43, CI = 0.20–0.91, p = 0.028; Model 2: OR = 0.41, CI = 0.19–0.92, p = 0.031). However, after adjusting for age, sex, race, BMI, education status, household income, smoking status, drinking status, and the UIC in Model 3, T3 exhibited an association solely with lower prevalence rates of SCH (OR = 0.28, CI = 0.15–0.54, p < 0.001), while no statistically significant association was observed with overt hypothyroidism (p = 0.21). Repeating the analysis with a TSH cutoff value of 4.6 mIU/L yielded consistent findings (Supplementary Table S3). No significant associations were found between vitamin E intake and AIT or subclinical hyperthyroidism.
Multinomial Logistic Regression Analysis for the Relationships of Dietary Vitamin E Intake with Subclinical Hypothyroidism, Overt Hypothyroidism, and Autoimmune Thyroiditis
T1 (≤4.53 mg), T2 (4.54–8.10 mg), and T3 (≥8.11 mg).
p-Values were calculated via weighted logistic regression analysis.
Model 1: This model was not adjusted for any covariates.
Model 2: In the total population, age, sex, and race were adjusted. In the male or female subgroups, age and race were adjusted.
Model 3: In the total population, age, sex, race, BMI, household income, education status, smoking status, drinking status, and urinary iodine concentration were adjusted. In the male or female subgroups, age, race, BMI, household income, education status, smoking status, drinking status, and urinary iodine concentration were adjusted.
BMI, body mass index; OR, odds ratio; CI, confidence interval; T1, lowest dietary vitamin E intake tertile group; T2, intermediate dietary vitamin E intake tertile group; T3, the highest group of dietary vitamin E intake.
RCS analysis
Figure 2 illustrates the dose–response relationships of dietary vitamin E intake with SCH, AIT, and TgAb based on RCSs. For analysis accuracy, individuals with a dietary vitamin E intake exceeding 40 mg/day were excluded to avoid the influence of extreme data. The RCS analysis revealed an “L-shaped” association between dietary vitamin E intake and SCH as well as TgAb in the general population and in males. The results showed a strong nonlinear association between dietary vitamin E intake and SCH in the general population (Fig. 2A, P-overall < 0.001, P for nonlinearity = 0.002), particularly in males (Fig. 2C, P-overall < 0.001, P for nonlinearity = 0.001). In males, there was a significant nonlinear relationship between dietary vitamin E intake and both AIT (Fig. 2D, P-overall = 0.001, P for nonlinearity < 0.001) and TgAb positivity (Supplementary Fig. S1C, P-overall < 0.001, P for nonlinearity < 0.001). However, in females, we did not find any statistically significant or nonlinear relationships between dietary vitamin E intake and SCH, AIT, or the TgAb positivity rate (Supplementary Fig. S1 E/F/G/H).
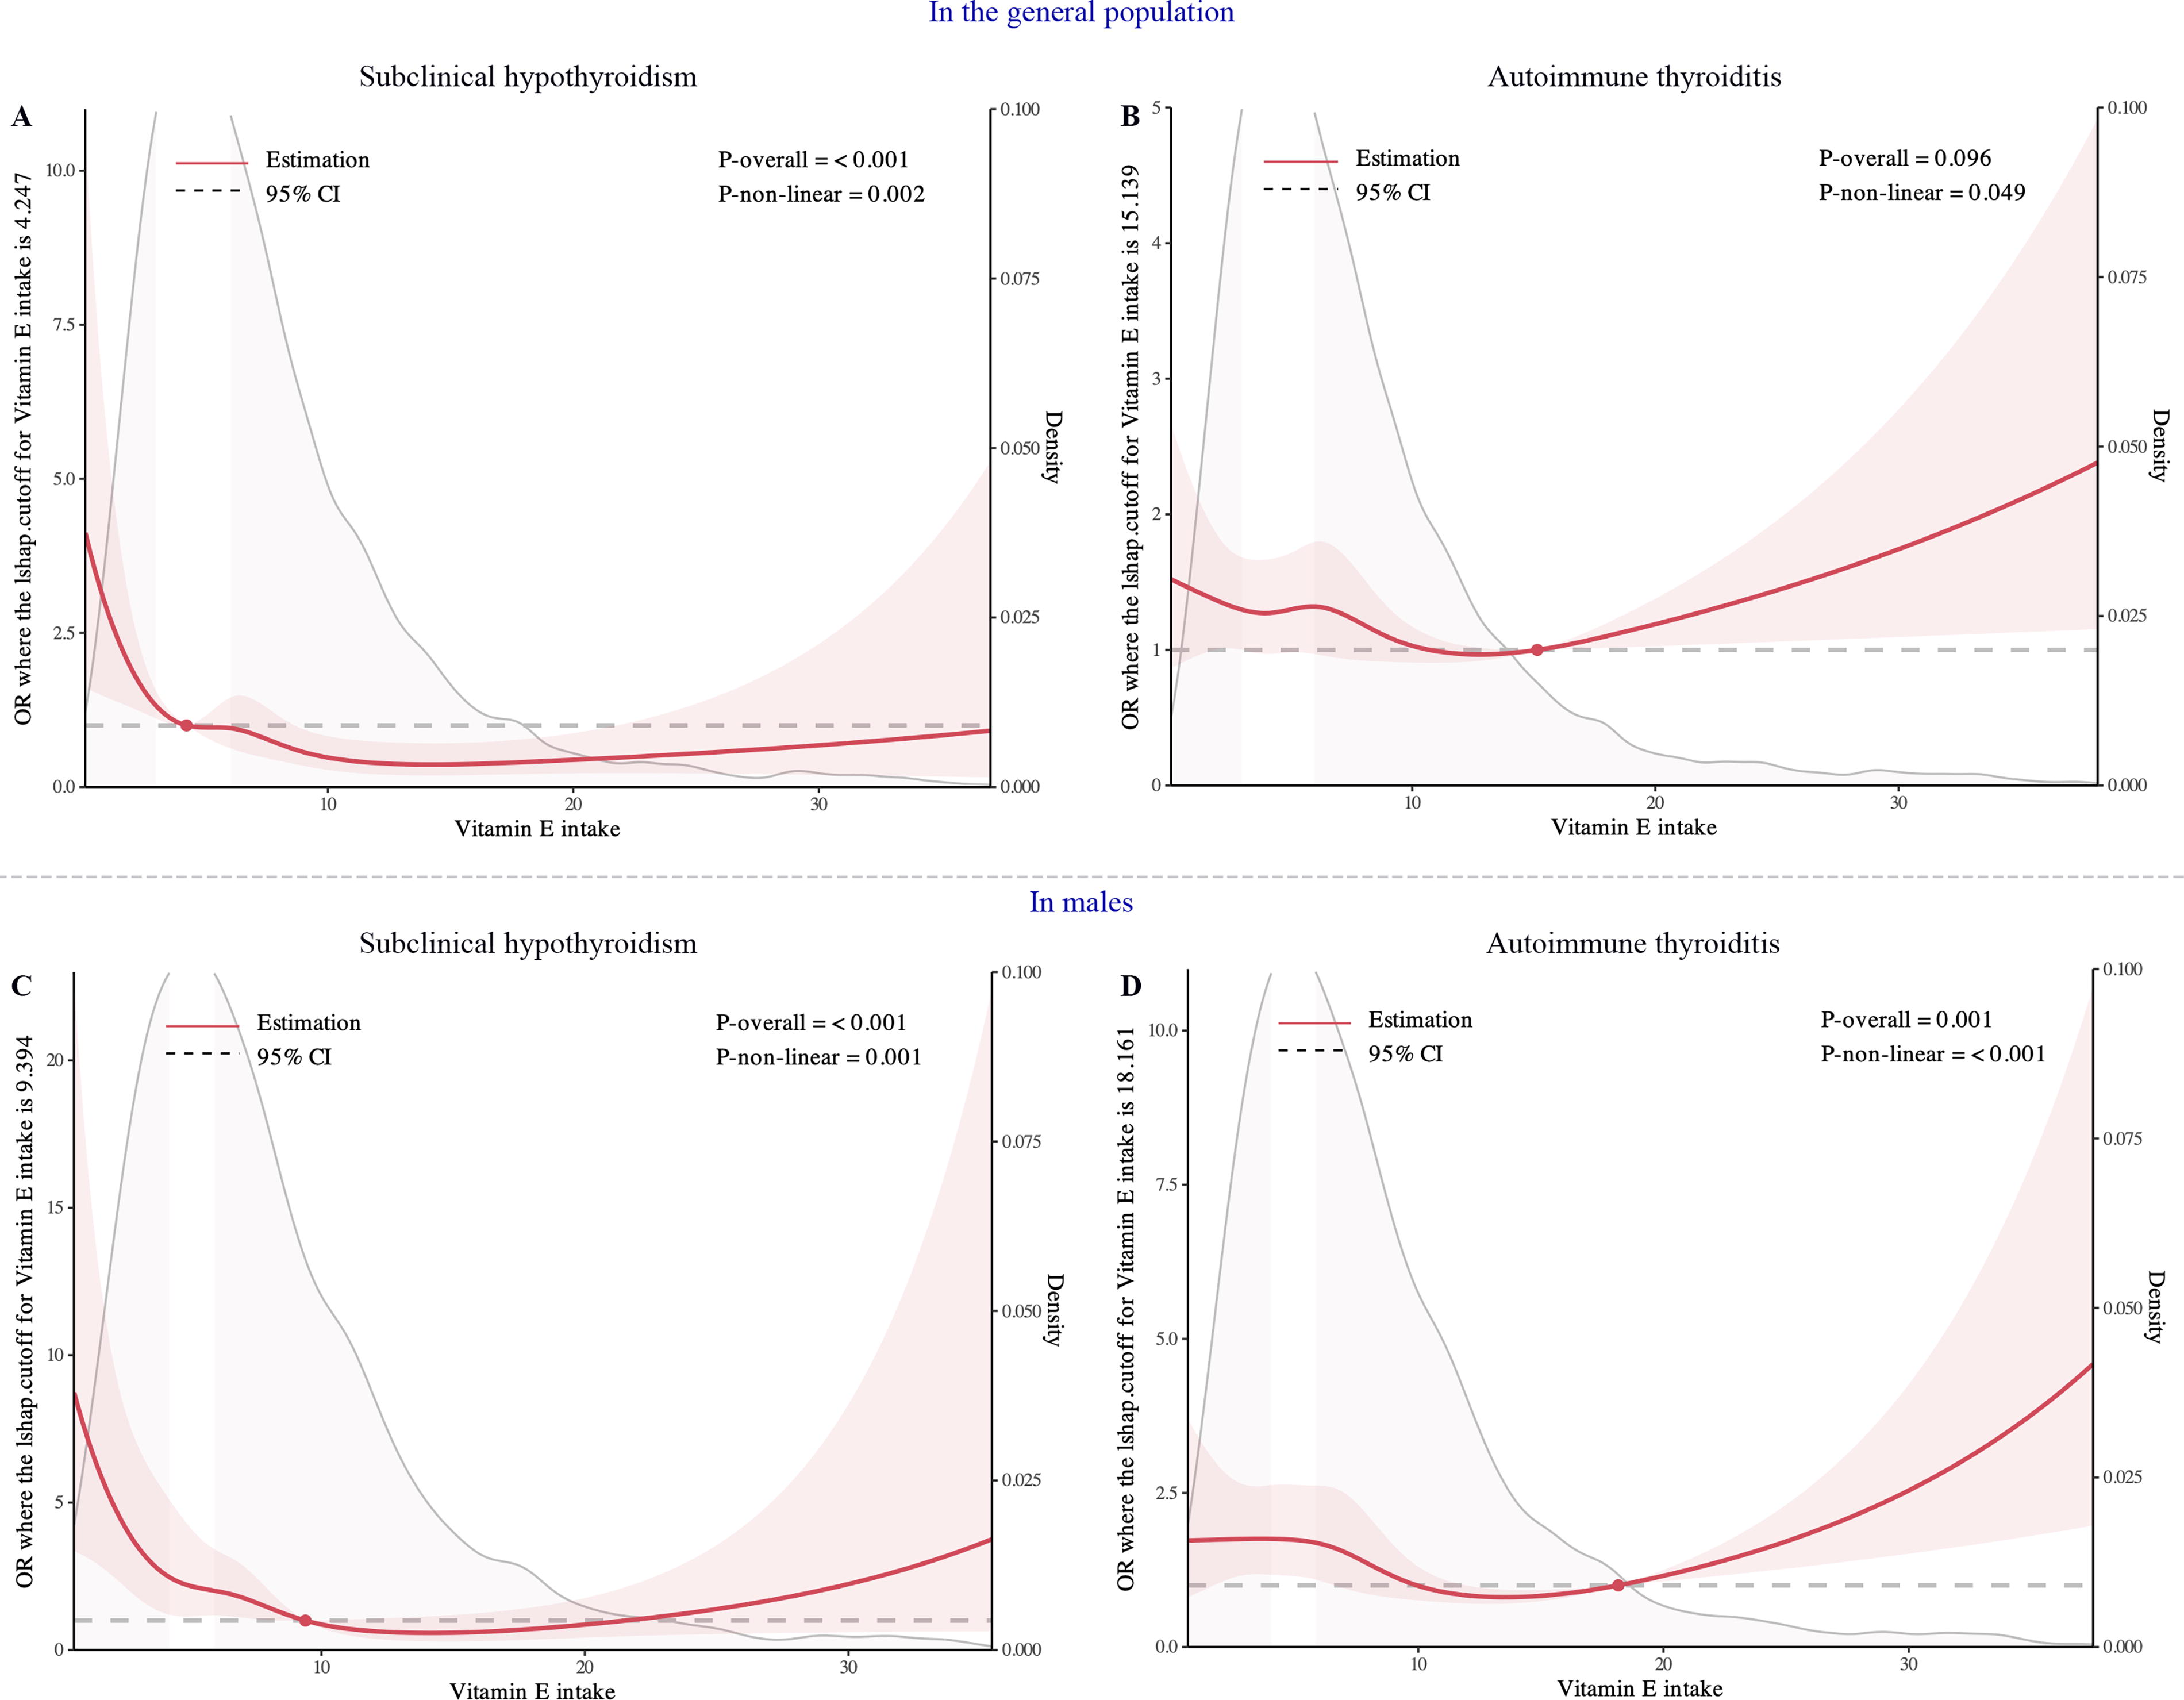
Dose–response relationship using a restricted cubic spline. All models were adjusted for age, sex, race, BMI, educational status, household income, smoking status, drinking status, and the urinary iodine concentration. Red lines represent the estimated hazard ratio, and the shaded red area corresponds to the confidence intervals.
Subgroup and sensitivity analyses
The interaction analysis indicated that the dietary intake of vitamin E interacts with sex (P-interaction = 0.011) and drinking status (P-interaction = 0.024) in relation to SCH (Supplementary Fig. S2). In addition, vitamin E intake had an interaction effect on race (P-interaction < 0.001) and drinking status (P-interaction = 0.024) in participants with overt hypothyroidism (Supplementary Fig. S3). Similarly, interactions between sex (P-interaction = 0.012), drinking status (P-interaction = 0.032), and BMI (P-interaction = 0.041) were observed for AIT (Supplementary Fig. S4).
According to our sex-based subgroup analysis, in males, both moderate (Model 3: T2, OR = 0.45, CI = 0.23–0.87, p = 0.020) and high (Model 3: T3, OR = 0.19, CI = 0.09–0.39, p < 0.001) dietary vitamin E intake were associated with lower prevalence rates of SCH (Table 4). Moderate (T2, Model 3: OR = 0.59, CI = 0.37–0.93, p = 0.024) and high (T3, Model 3: OR = 0.52, CI = 0.36–0.75, p < 0.001) dietary vitamin E intake was associated with lower prevalence rates of AIT in males (Table 4). However, in females, no statistically significant differences were detected for SCH (Model 3: T2, OR = 1.10, CI = 0.50–2.22, p = 0.78; T3, OR = 0.50, CI = 0.20–1.26, p = 0.14), AIT (Model 3: T2, OR = 1.01, CI = 0.73–1.38, p = 0.97; T3, OR = 1.17, CI = 0.79–1.75, p = 0.42), or overt hypothyroidism (Model 3: T2, OR = 1.00, CI = 0.23–4.36, p = 0.99; T3, OR = 0.72, CI = 0.16–3.33, p = 0.67) (Table 4). In addition, among males, higher dietary intake of vitamin E was associated with decreased TgAb and TPOAb positivity, but this trend was not observed in females (Supplementary Table S4).
Subgroup analysis based on drinking status revealed a consistent protective effect of vitamin E on the prevalence of SCH. In addition, higher dietary vitamin E intake was associated with lower prevalence rates of AIT in individuals who were nondrinkers and those with a BMI > 25 kg/m2 (Supplementary Table S5).
Discussion
To explore the impact of dietary vitamin E intake on thyroid dysfunction and the positivity of thyroid autoantibodies, we conducted an analysis using cross-sectional data from the NHANES. Based on the results of our primary analysis, we further used multivariate regression models and subgroup analyses to determine whether the effects of different dietary vitamin E intake levels vary among diverse populations, such as by sex, BMI, or alcohol consumption subgroups.
We observed that higher dietary intake of vitamin E was inversely associated with the overall prevalence of SCH. This impact remained stable across the three logistic regression models, each progressively adjusting for more risk factors. Subgroup analysis revealed a more pronounced effect in males. As the intake of vitamin E increases, the prevalence of overt hypothyroidism decreases. For participants with overt hypothyroidism, the restricted sample size may have impeded a statistically significant multiple regression analysis after we adjusted for confounding factors in Model 3. Validation of these findings would necessitate future clinical follow-up studies with larger sample sizes. Studies have suggested that vitamin E supplementation has a protective effect by reducing reactive oxygen species (ROS) levels and oxidative damage. Research has suggested that fluctuations in ROS levels can influence the activity of deiodinases. 29 We hypothesize that the effect of vitamin E on TSH levels may be linked to its antioxidant properties. However, further animal experiments are needed to explore and validate the specific mechanisms involved.
In addition, we found that moderate-to-high dietary vitamin E intake was associated with a reduced prevalence of AIT in males. Similar reports have also indicated a protective effect of vitamin E in other autoimmune diseases, such as asthma 30,31 and inflammatory bowel disease. 32 This association may be attributed to the direct immunomodulatory functions of vitamin E. Vitamin E has been shown to modulate the immune system by enhancing lymphocyte proliferation, promoting delayed hypersensitivity responses, and reducing the production of proinflammatory cytokines such as IL-6.5 On the contrary, Liu et al. suggested that the gut microbiota might play a role in the protective effect of vitamin E against inflammatory bowel disease. 32 In the context of thyroid disease, direct evidence regarding the effect of vitamin E supplementation on thyroid autoimmunity is at present lacking. A clinical trial of hyperthyroid patients reported that vitamin E supplementation improved symptoms compared with treatment with only methimazole. 33 Furthermore, the protective effects of vitamin E supplementation were observed in experimental hyperthyroid animal models. 34 In addition, in hypothyroid animal models, vitamin E supplementation helped alleviate damage to myocardial, hepatic, and renal cells and neurons by reducing oxidative substances. 11 –15,35
To explore the factors that may influence the protective effect of vitamin E, we conducted subgroup analyses. The sex-specific impact of vitamin E was similarly noted in other contexts. 36,37 Torrens et al. reported that due to the direct or indirect antioxidative effects of estrogen, 38 as well as the potential influence of X chromosome-mediated gene expression on the response to ROS, 39 males exhibited weaker defense mechanisms against ROS than females.
In addition, despite the lack of significant clinical impact, our observation revealed an association between higher dietary vitamin E intake and reduced TT4 and thyroglobulin levels. Thyroglobulin levels tend to increase in response to TSH stimulation. 40 The observed decrease in thyroglobulin levels with an increase in vitamin E in our study may be a result of the decrease in TSH. Thyroxine is predominantly present in the bloodstream in a bound form with thyroxine-binding globulin (TBG), transthyretin (TTR), and albumin (ALB). The concentrations and tightness of the binding of thyroxine to TBG and TTR can influence TT4 levels but do not affect fT4 or fT3 levels, 41 as commonly observed in pregnant women. These findings align with the findings of our study, where TT4 decreased, while fT4 and fT3 did not significantly change. Vitamin E was demonstrated to affect the rate of TTR aggregation by regulating the formation of polyunsaturated fatty acids (ω-3 and ω-6 PUFAs). 42 It is possible that vitamin E affects TT4 levels by influencing TTR levels via this mechanism. In addition, TTR levels are correlated with oxidative stress, 43 and vitamin E is known for its ability to reduce oxidative stress. We speculated that the decrease in TT4 levels may be related to the change in binding proteins, possibly influenced by the antioxidant effects of vitamin E. 44 However, TBG and TTR data are not available in the NHANES data set, hindering a comprehensive understanding of the population. The serum ALB concentration did not significantly impact the TT4 level (p = 0.64; Supplementary Table S6). However, further studies are needed to elucidate the underlying mechanisms behind this phenomenon.
At present, research on the relationship between vitamin E and thyroid dysfunction consists primarily of small-sample case–control studies or animal experiments. Our study, conducted from a population perspective, explored the association between dietary vitamin E intake and thyroid dysfunction, providing evidence for a potential association of lower prevalence rates of SCH and AIT with increased dietary vitamin E intake.
However, it is crucial to acknowledge the limitations of our study. First, as a cross-sectional study, causality cannot be established, and the underlying reasons for the observed associations between dietary vitamin E intake and SCH or AIT cannot be elucidated. In the future, randomized controlled trials are needed to investigate the therapeutic effects of vitamin E supplementation in patients with SCH and AIT. Second, the NHANES data did not include accurate information regarding vitamin supplementation, which might affect the precise estimation of vitamin E intake. Third, there are no concurrent data on vitamin E measurements available within the NHANES data set to serve as validation for the dietary recall interviews. In addition, the lack of TBG and TTR data hinders the validation of our speculation on the potential associations of the downward trend in TT4 with TBG and TTR.
In conclusion, we found that higher dietary vitamin E intake is associated with lower prevalence rates of SCH and AIT, predominantly in males. These findings suggest a potential avenue for future research to explore the supplementation of vitamin E as a means to improve SCH and AIT.
Footnotes
Authors’ Contribution
S.L.: Conceptualization, data curation, formal analysis, software, writing—original draft, and writing—review and editing. C.L.: Data curation, formal analysis, methodology, and software. L.H.: Data curation and methodology. Z.S.: Conceptualization, supervision, and writing—review and editing. W.T.: Conceptualization, supervision, and writing—review and editing. Y.L.: Formal analysis, methodology, supervision, and writing—review and editing. T.L.: Conceptualization, data curation, formal analysis, writing—original draft, supervision, and writing—review and editing.
Author Disclosure Statement
No competing interests exist.
Funding Information
This work was supported by the National Natural Science Foundation of China (Grant number: 81800700) and the Scientific Research Fund of Liaoning Provincial Education Department (Grant number: QNZR2020002).
Supplementary Material
Supplementary Figure S1
Supplementary Figure S2
Supplementary Figure S3
Supplementary Figure S4
Supplementary Table S1
Supplementary Table S2
Supplementary Table S3
Supplementary Table S4
Supplementary Table S5
Supplementary Table S6