
Abstract
Background:
3,5,3′-Triiodothyroacetic acid (TRIAC) is a T3-receptor agonist pharmacologically used in patients to mitigate T3 resistance. It is additionally explored to treat some symptoms of patients with inactivating mutations in the thyroid hormone (TH) transporter monocarboxylate transporter 8 (MCT8, SLC16A2). MCT8 is expressed along the blood–brain barrier, on neurons, astrocytes, and oligodendrocytes. Hence, pathogenic variants in MCT8 limit the access of TH into and their functions within the brain. TRIAC was shown to enter the brain independently of MCT8 and to modulate expression of TH-dependent genes. The aim of the study was to identify transporters that facilitate TRIAC uptake into cells.
Methods:
We performed a whole-genome RNAi screen in HepG2 cells stably expressing a T3-receptor-dependent luciferase reporter gene. Validation of hits from the primary and confirmatory secondary screen involved a counter screen with siRNAs and compared the cellular response to TRIAC to the effect of T3, in order to exclude siRNAs targeting the gene expression machinery. MDCK1 cells were stably transfected with cDNA encoding C-terminally myc-tagged versions of the identified TRIAC-preferring transporters. Several individual clones were selected after immunocytochemical characterization for biochemical characterization of their 125I-TRIAC transport activities.
Results:
We identified SLC22A9 and SLC29A2 as transporters mediating cellular uptake of TRIAC. SLC22A9 encodes the organic anion transporter 7 (OAT7), a sodium-independent organic anion transporter expressed in the plasma membrane in brain, pituitary, liver, and other organs. Competition with the SLC22A9/OAT7 substrate estrone-3-sulfate reduced 125I-TRIAC uptake. SLC29A2 encodes the equilibrative nucleoside transporter 2 (ENT2), which is ubiquitously expressed, including pituitary and brain. Coincubation with the SLC29A2/ENT2 inhibitor nitrobenzyl-6-thioinosine reduced 125I-TRIAC uptake. Moreover, ABCD1, an ATP-dependent peroxisomal pump, was identified as a 125I-TRIAC exporter in transfected MDCK1 cells.
Conclusions:
Knowledge of TRIAC transporter expression patterns, also during brain development, may thus in the future help to interpret observations on TRIAC effects, as well as understand why TRIAC may not show a desirable effect on cells or organs not expressing appropriate transporters. The identification of ABCD1 highlights the sensitivity of our established screening assay, but it may not hold significant relevance for patients undergoing TRIAC treatment.
Introduction
Among the proteins capable of thyroid hormone (TH) transmembrane transport, monocarboxylate transporter 8 (MCT8) is the most important in humans. Male patients affected with pathogenic variants in MCT8 (Allan–Herndon–Dudley Syndrome; AHDS; OMIM 300523) suffer from severe developmental delay, including lack of speech development.
1
–4
Since MCT8 can transport T3 (3,3′,5-triiodo-
It is known that the T3R-agonist, 3,5,3′-triiodothyroacetic acid (TRIAC), is not transported by MCT8. 12 TRIAC appears to cross the BBB even in case of defective MCT8 and to enter the nucleus of the target cells. There, TRIAC binds to and activates nuclear T3R. 13,14 In Mct8-deficient mouse models, TRIAC and other pharmacological T3R agonists such as TETRAC (3,5,3′,5′-tetraiodothyroacetic acid), DITPA (3,5 diiodothyropropionic acid), 15 and sobetirome-methylamide (Sob-AM2) have been shown to partially rescue T3R-dependent brain development. 16 –22 Based on some of the former preclinical studies and because TRIAC is a registered drug for other TH-related diseases, clinical trials on the use of TRIAC as a drug for patients with AHDS (#NCT02060474 and #NCT02396459) 23,24 have been conducted with partially promising, but not entirely satisfying, results. The mixed results may be related to the expression patterns of TRIAC transporters that may lead to some cells being TRIAC responsive, while cells without appropriate transporter remain insensitive to TRIAC. Knowledge of the TRIAC transporters involved and their cellular and developmental expression patterns could, therefore, help to better understand and rationalize achieved effects of TRIAC treatment—and effects unexpectedly not achieved. Thus, ultimately, knowledge of TRIAC transporters will help improve TRIAC treatment paradigms. In this study, we performed a genome-wide RNAi screen using a cellular T3R-reporter gene system and identified SLC29A2 (equilibrative nucleoside transporter 2, ENT2), SLC22A9 (organic anion transporter 7, OAT7), and ABCD1 (adrenoleukodystrophy protein, ALDP) as human TRIAC transporters.
Methods
Cell culture
The C11 HepG2 cells were maintained in low glucose DMEM (Gibco, Life Technologies) containing 10% FBS (v/v) (FBS Superior, Merck), 100 units/ml penicillin, and 100 μg/ml streptomycin, supplemented with 700 µg/ml G418 (Gibco, Life Technologies) at 37°C and 5% CO2. No ethics statement is required.
Nonradioactive uptake assay
Nonradioactive uptake assays were performed as described 25 except 5-minute incubation of HepG2-cells with TRIAC instead of 15 minutes with T3. The shortened incubation time and the different TRIAC concentrations were necessary to stay in the linear range of the colorimetric destaining reaction. T3 or TRIAC uptake is detected in a colorimetric assay where free iodine moieties (released by oxidative digestion) catalyze the destaining of ceric solution (25 mM (NH4)4 Ce(SO4)4, 0.5M H2SO4) after adding arsenous solution (25 mM NaAsO2, 0.5M H2SO4, 0.2M NaCl). Changes in absorption at 415 nm (dOD 415 nm) were recorded (25°C, Microplate Reader 3550 with incubator, Bio-Rad). For relative uptake quantification, the difference of absorption at the starting point (1 minute) and after 21 minutes (dOD20min) was equalized to cellular iodine content reflecting the relative uptake of TRIAC or T3, respectively.
TR-reporter assay in 384-well format
For concentration–response curves, 8500 cells/well were seeded in 40 µl antibiotic-free DMEM with 20% v/v Opti-MEM® (Life Technologies) and 0.125% v/v FBS per well of 384-well assay plates (white opaque 384-well plates; Corning) using a BioTek EL406TM dispenser. After incubation for 48 hours, medium was aspirated to 10 µl and refilled with 30 µl of phenol red-free DMEM without FBS. After another 24 hours, cells were stimulated in quintuplicate with 1 µM, 100 nM, 10 nM, 1 nM, 333 pM, 100 pM, 33.3 pM, 10 pM, 1 pM, 333.3 fM, 100 fM, 10 fM, or 1 fM of TRIAC or T3, by addition of 10 µl of a fivefold stock solution. After 5 hours the wells were aspirated to 10 µl, and then 15 µl of luciferase-substrate/Cell lysis solution (ONE-Glo; Promega) were added to each well. Five minutes after substrate addition, bioluminescence was measured in a Safire2 plate reader (Tecan).
RNAi screen
The “Dharmacon ON-TARGETplus human siRNA library” (Horizon Discovery) used for the screen covers a total of 18,090 target genes with 4 pooled siRNAs each and is arranged in 66 separate 384-well plates. For the screen, each well of the 384-well assay plate received 10 µl of a premixed siRNA-Lipofectamine® RNAiMAX transfection reagent (Life Technologies)–Opti-MEM® (Life Technologies) solution. Subsequently, 8500 cells/well in antibiotic-free DMEM were seeded onto the predispensed transfection mixture (BioTek EL406TM dispenser) resulting in a final concentration of 40 nM siRNA and 0.15 µl Lipofectamine® RNAiMAX in a total volume of 40 µl per well. After incubation for 48 hours, medium was aspired to 10 µl and refilled with 30 µl of phenol red-free DMEM without FBS. After another 24 hours, cells were stimulated with 1 nM of TRIAC to induce luciferase expression. Four hours later, CellTiter-Fluor (Promega) was added according to the manufacturer’s recommendations supplemented with 1 nM TRIAC to keep the final TRIAC concentration in the well unchanged, to allow a cell viability readout. After another hour, first the cell viability was measured (excitation at 380 nm with fluorescence measured at 505 nm), then the wells were aspirated to 10 µl, and finally 15 µl of luciferase-substrate/cell lysis solution (ONE-Glo; Promega) were added to each well. Five minutes after substrate addition, bioluminescence was measured in a Safire2 plate reader.
In the primary screen, 89 plates (a 384-wells) were processed. Sixty-six plates for final analysis were selected based on the Z-prime factors. Z-Prime factors of the plates were calculated using the following controls: mock transfection with medium (8 wells) and mock transfection stimulated with 1 nM TRIAC (8 wells). Average Z-prime factor of the primary screen was 0.69 (66 plates, max. = 0.89, min. = 0.25) indicating an excellent assay performance. For plate-wide normalization of luminescence values, the Z-score was calculated (Z-score = (x-m_x)/(MAD_x); x = luminescence value of the well; m_x = median of all luminescence values of the plate; MAD_x = mean absolute deviation of the luminescence values of the plate).
Secondary screen
The 1512 most highly ranked candidate siRNAs from the primary screen were rescreened. The “percentage of control (POC)” was used for normalization [POC = (x/K_pos) ×100; x = luminescence value of the well; K_pos = mean value of the luminescence of the positive controls = per plate 22-well mock transfection stimulated with 1 nM TRIAC].
Deconvolution of the siRNA pools
The pools of 4 siRNAs targeting 126 candidates were resolved. Cells transfected with individual siRNAs were stimulated in tetraplicate with 1 nM TRIAC or 10 nM T3. For normalization, the POC was again used, and a POC_TRIAC and POC_T3 were calculated for each siRNA. For further analysis, candidates were selected that had a POC_TRIAC <80% or >130% and at the same time a cell viability >71% (POC_fluorescence).
Validation
The best 53 individual siRNAs (Dharmacon ON-TARGETplus; Horizon Discovery) were used in the 96-well plate assay format (white opaque 96-well plates; Nunc, Thermo Fisher). Reverse transfection was performed with a final concentration of 20 nM siRNA, 0.5% (v/v) Lipofectamine RNAiMAX, and 20% v/v Opti-MEM with 1 × 10⁵ cells per well and 80% v/v DMEM without FBS and phenol red. Plates were incubated for 48 hours, followed by a complete exchange of medium to 90 µl of DMEM without FBS and phenol red. After 24 hours, 1 nM TRIAC or 10 nM T3 was added (10 µl of a 10-fold stock solution). After 5-hour incubation at 37°C, followed by 30-minute equilibration to room temperature, 100 µl of ONE-Glo (Promega) solution was added and bioluminescence was detected with a Safire Pro plate reader (Tecan).
A second round of validation was carried out with different siRNAs (Silencer® Select, Invitrogen) under the same conditions. See also schematic protocol for 96-well and 384-well T3R reporter assay in Supplementary Figure S1. In both validation rounds in the 96-well plate assay format, the luciferase signal (relative light unit, RLU) was normalized to the nonstimulated signal [fold change in luciferase signal (S/N) = μ_pos/μ_con, μ_pos = mean RLU stimulated; μ_con = mean RLU nonstimulated].
Cloning of transporter cDNAs into expression vectors, transfection, and characterization
The transporter cDNAs were prepared by gene synthesis with a C-terminal myc-tag and cloned into pCMV6 OriGene (Rockville, USA) with the following order numbers: SLC22A9 (NM_080866; RC211997), SLC29A2 (NM_001532; RC210776), and ABCD1 (NM_000033; RC206885). Madin-Darby kidney cells (MDCK1) cells were stably transfected as previously described with minor modifications. 26 Resulting mixed clones were recloned by serial dilution and cell lines selected exhibiting ≥89% α-myc-positive immunolabeling. Immunocytochemical staining was performed with α-myc antibody (9B11, Cell Signaling, 1:500) and α-E-cadherin (Decma-1, Sigma; 1:2000) and visualized using immunofluorescence with preabsorbed secondary antibodies (Jackson ImmunoResearch). DAPI (Sigma; 1:000) served as nuclear stain. Images were acquired on a Zeiss Apotome 2 equipped with a 63x objective.
Radioactive uptake measurements
Three days before the experiment, stably expressing and nontransfected MDCK1 cells were seeded into 24-well plates. For each transporter, two different cell clones were measured in duplicates in two independent experiments. Results were combined into one graph. Replicate measurements from different days with different specific radioactivity were combined after normalization to readings from nontransfected cells.
125I-TRIAC was purchased from Hartmann Analytics (Braunschweig, Germany).125I-T3 and 125I-T4 were obtained from Perkin Elmer (Waltham, USA). Purification of 125I-labeled compounds from iodine was performed by adsorption chromatography as described. 27 125I-labeled compounds with or without the respective nonradioactive compound were diluted in DMEM/F12 (1:1) for uptake measurements. Estrone-3-sulfate (E3S, Sigma) and nitrobenzyl-6-thioinosine (NBTI, Sigma) were diluted in methanol and dimethylformamide, respectively.
Results
Nonradioactive iodine-dependent assay and establishment of a T3-responsive luciferase reporter system in HepG2 cells
Hepatocytes are known to express a plethora of transporter genes. We therefore explored whether human hepatocarcinoma cells, HepG2, show measurable TRIAC uptake. The uptake of the iodine-containing molecules was followed by a nonradioactive iodine-dependent assay. 25,28 After 5 minutes of incubation with different TRIAC concentrations, HepG2 cells showed a saturation of TRIAC uptake above 30 µM (Fig. 1A), reaching an intracellular accumulation of more than 60% of the available 30 µM TRIAC (Fig. 1B). TRIAC accumulation was temperature dependent suggesting a transporter-mediated process. 29 T3 uptake into HepG2 served as a positive control, with saturation above 15 µM T3 (Fig. 1C). The maximum percentage of available T3 taken up in HepG2 cells was 16% at 5 µM T3 (Fig. 1D).
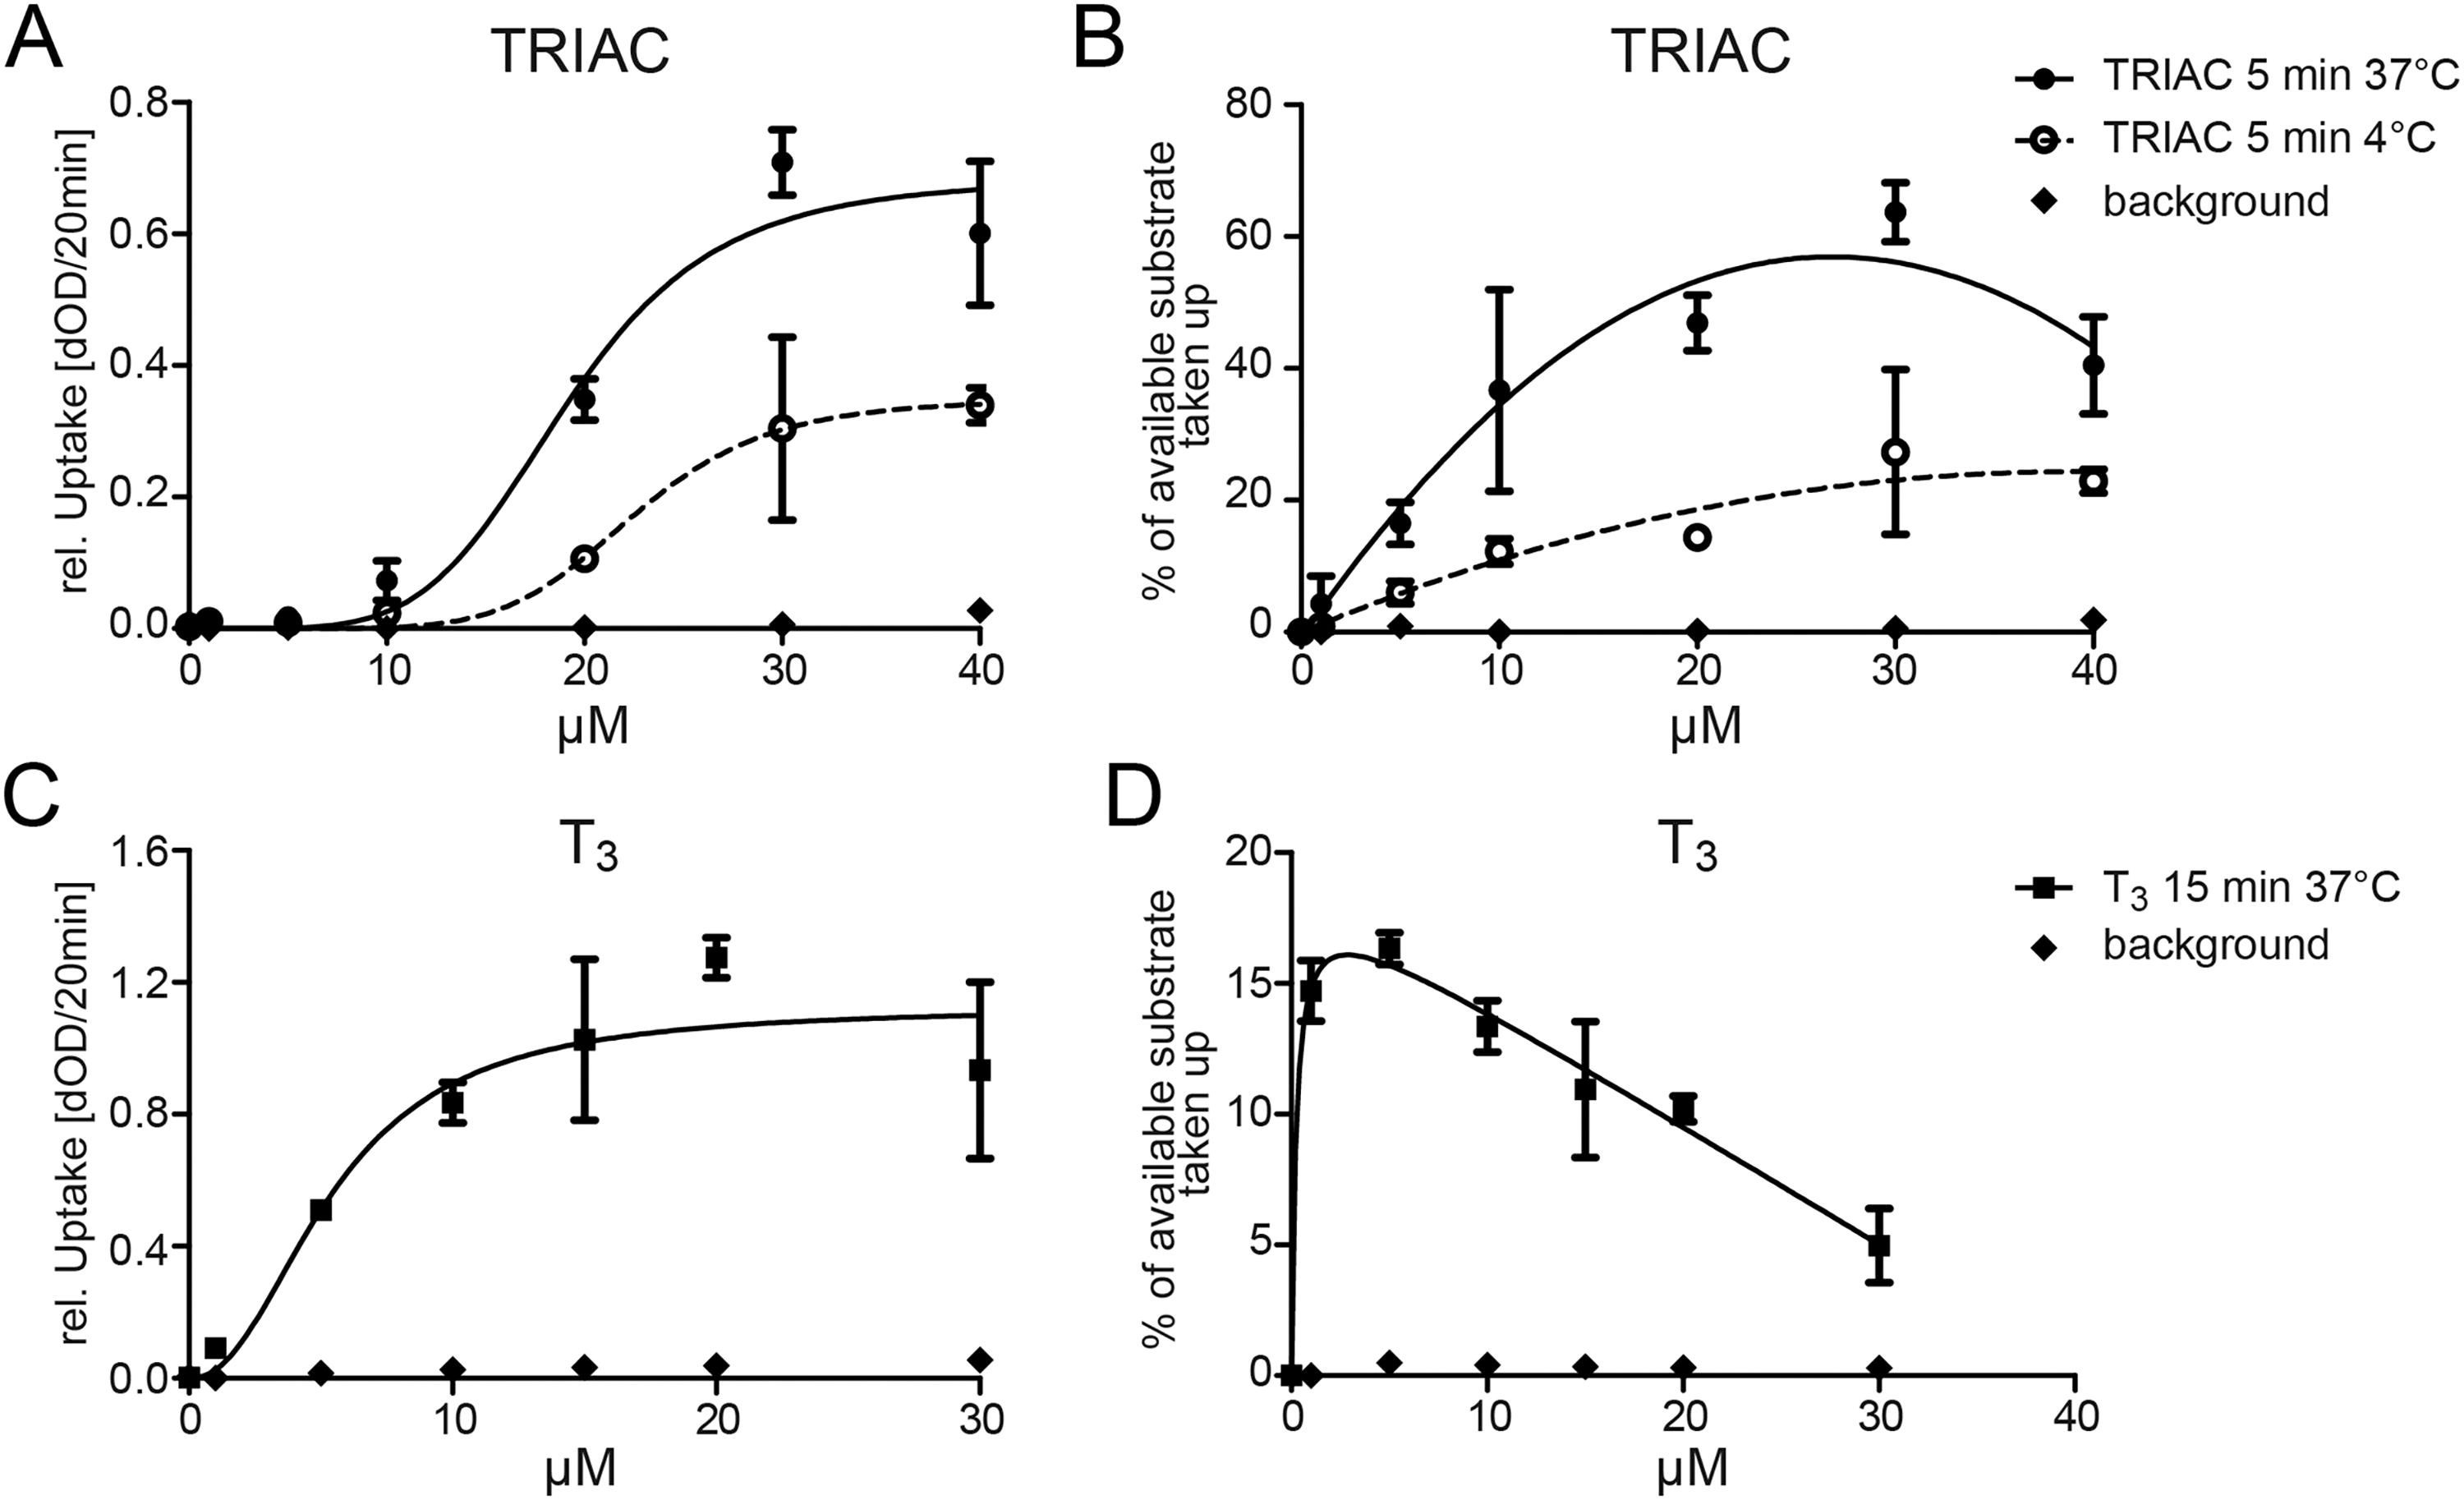
The uptake of TRIAC in HepG2 cells is saturable and temperature dependent.
We previously reported a sensitive T3R-dependent luciferase reporter construct in HepG2 cells, which is based on endogenous T3R expression. 30 In this study, we established a stably transfected HepG2 reporter cell line, C11, and showed its sensitive luciferase response to TRIAC and T3 under screening conditions in the 384-well format (Fig. 2). The effective concentration yielding 50% of the maximum signal (EC50) for TRIAC was 289 pM (CI: 256–326 pM) (Fig. 2A). The EC50 for T3 was higher, 631 pM (CI: 542–734 pM) (Fig. 2B). In order to have maximum sensitivity for changes in the intracellular TRIAC and T3 concentrations, we decided to perform the screening experiments with 1 nM (10−9 M) TRIAC and 10 nM (10−8 M) T3.
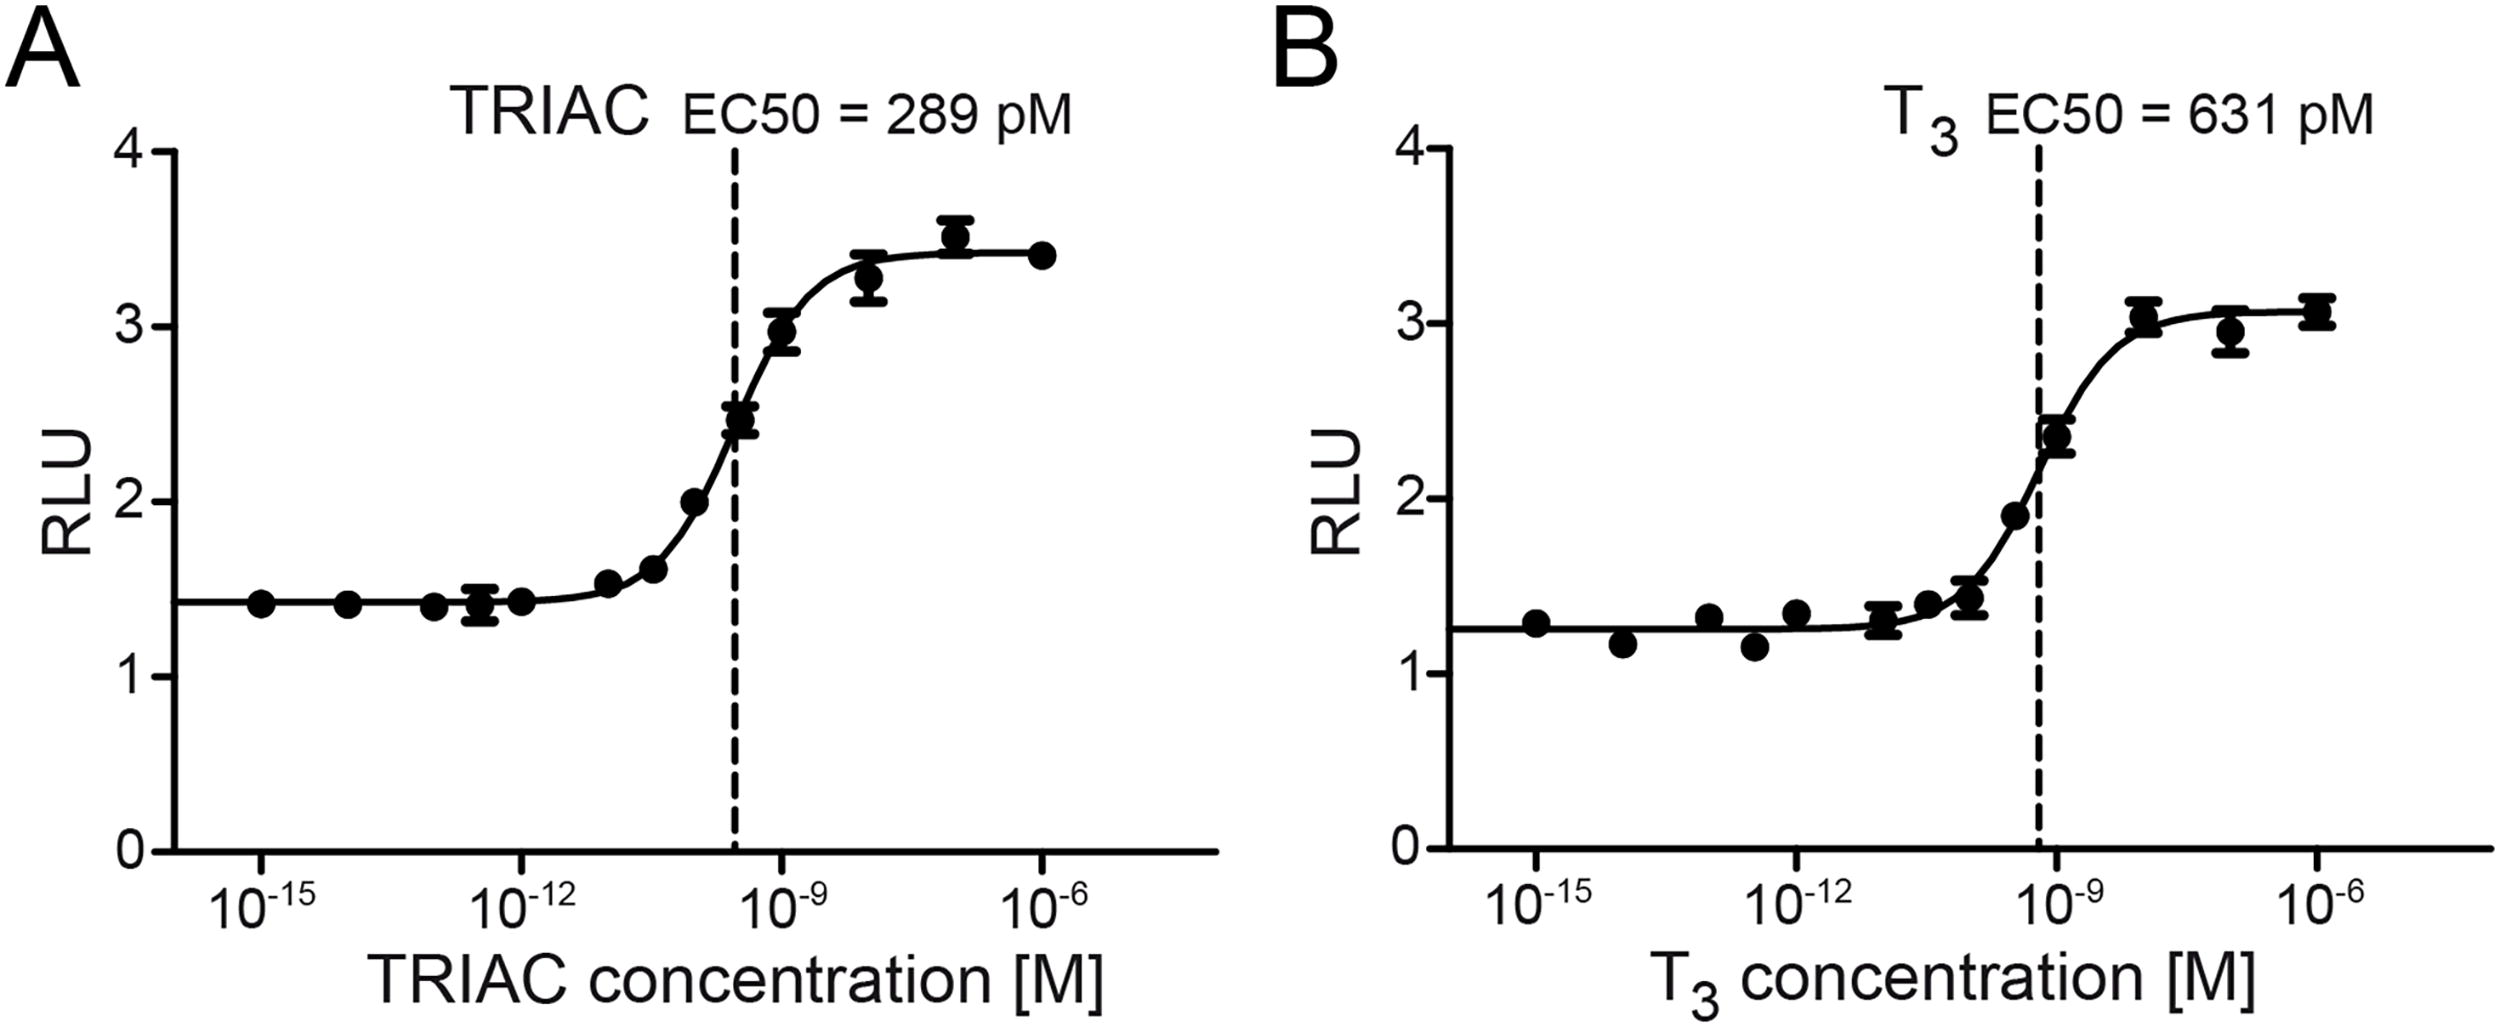
Representative concentration–response curves for
Genome-wide RNAi screen
We based our screening system on C11 HepG2 cells with the idea that knockdown of a TRIAC transporter gene would reduce the ligand-dependent luciferase response when stimulated with TRIAC (Fig. 3). We performed a counter screen with T3 as a validation step in order to exclude gene hits that affected the gene expression machinery. Knockdown of a TRIAC transporter would be specific for the TRIAC-, but not for the T3-response (Fig. 3). In the primary screen, we tested the knockdown of 18,090 human target genes (Fig. 4A). The Z-scores of all genes tested in the primary screen followed a normal distribution (Fig. 4B). Potential hits were defined as genes whose knockdown resulted in a Z-score < −2 or a Z-score > 3 (marked red in Fig. 4C), yielding 1512 genes that were selected for the secondary screen. Hence, our screening strategy not only picked up genes that decreased T3 signaling upon siRNA-mediated knockdown but also genes increasing the T3 response upon knockdown.
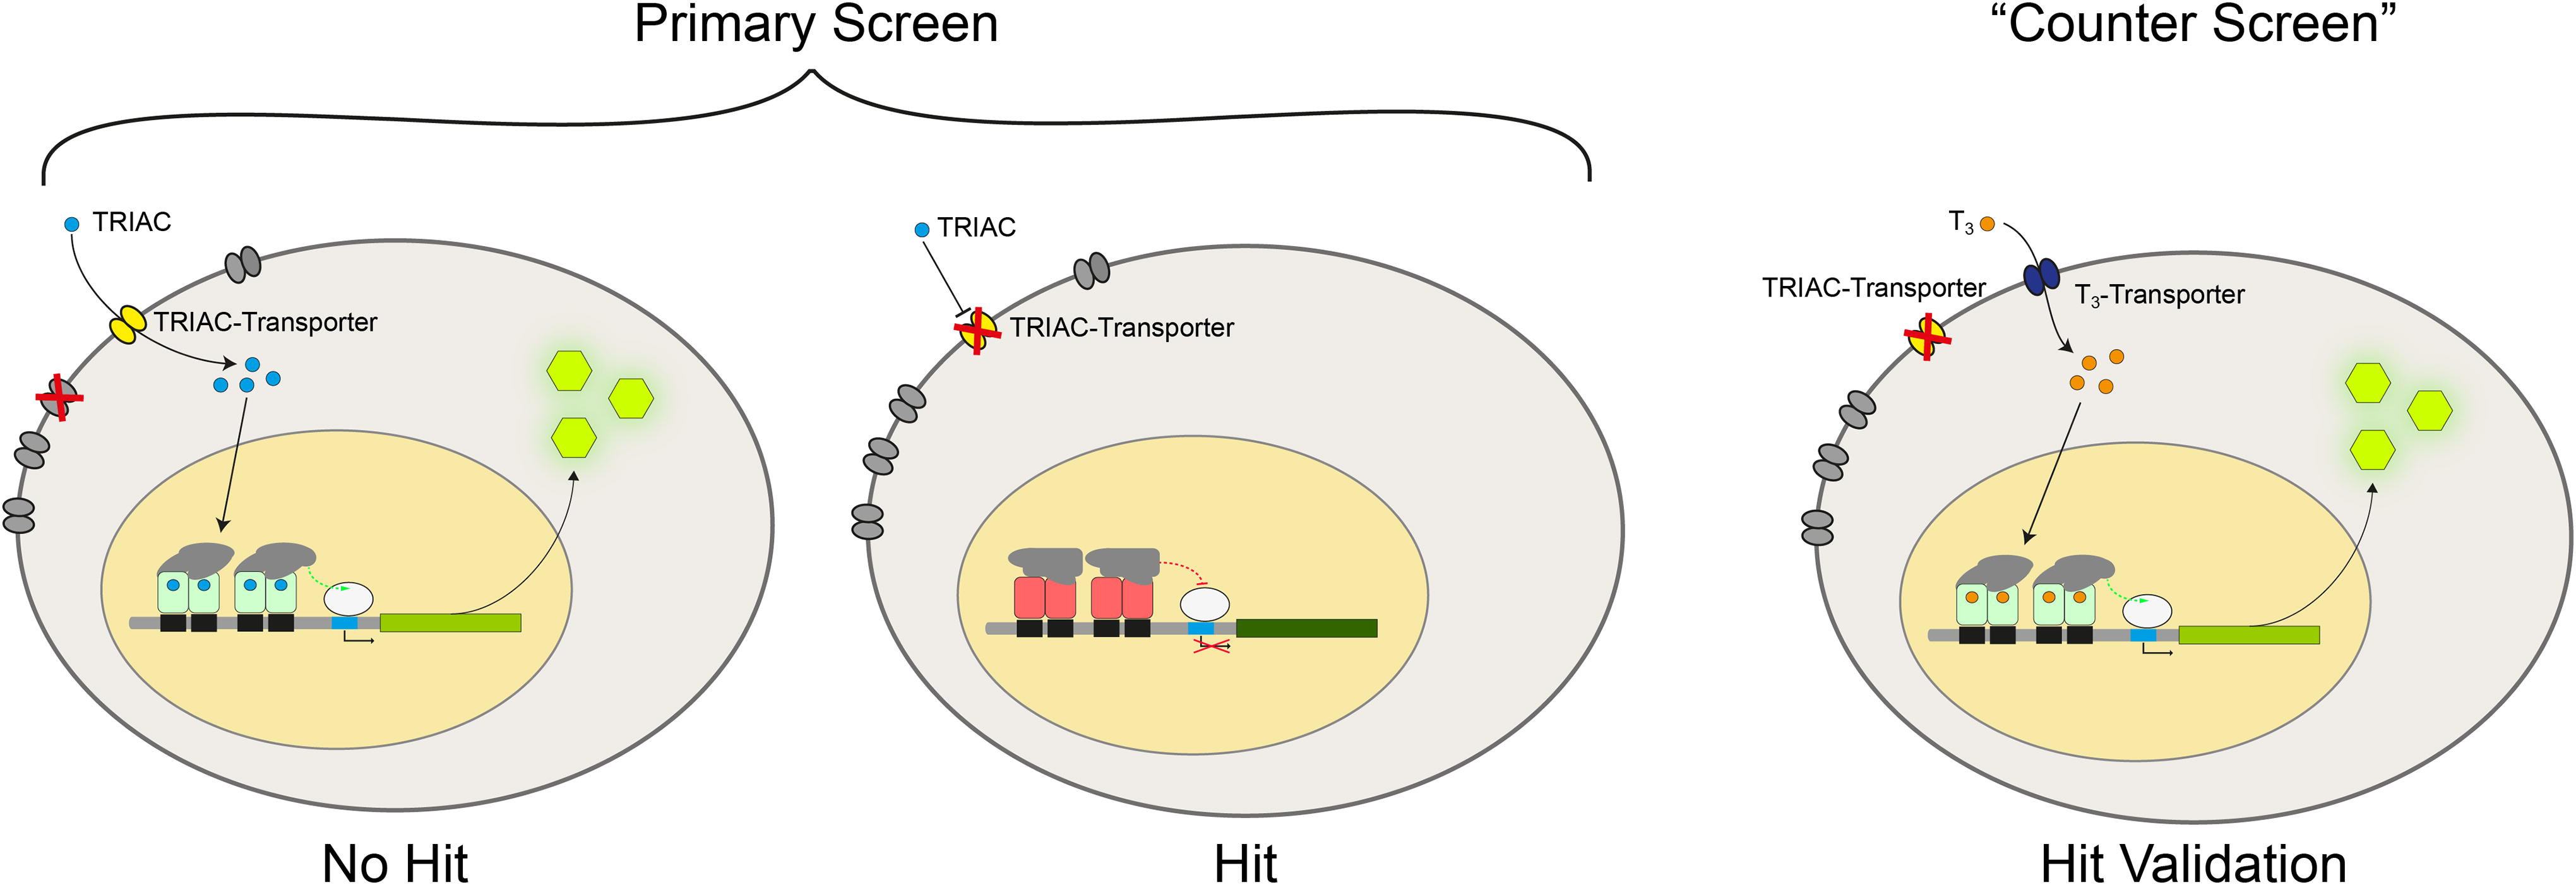
Schematic diagram of the RNAi screen of a human genome library of small interfering RNA using a T3-receptor reporter gene (luciferase assay). A reduced luciferase signal indicates a hit, that is, a reduced TRIAC dependent reporter gene signal (middle panel). Hit validation was carried out using T3 as positive reporter gene inducer (right panel). TRIAC, 3,5,3'-triiodothyroacetic acid.

RNAi screen overview.
To confirm our initial results (and rule out false positives), we performed a secondary screen with the resulting 1512 candidate genes of the primary screen. Knockdown of the 1512 candidates was repeated with the same pooled siRNAs as in the primary screen. However, the POC was now used as normalization. Hits in the secondary screen were now defined as POC < 80 or > 135. This procedure reduced the initial 1512 candidates to 126 potential hits after secondary screen (Fig. 4).
A deconvolution of the siRNA pools was carried out with these 126 candidates, that is, instead of four pooled siRNAs per gene per well, the siRNAs were now applied individually (i.e., 4 wells per gene). This process (see selection criteria in Fig. 4) narrowed down the list to 50 candidates, including, for example, THRA (Supplementary Table S1). We then validated our hits by testing whether the response to 10 nM T3 remained normal. This left us with a total of 13 candidates with a significant reduction of the TRIAC-induced signal, but unchanged T3-induced luciferase signal (Table 1).
Genes Resulting from the siRNA Screen after Screening and Deconvolution
Final set of 13 candidate genes after a stringent whole genome siRNA screen, rescreen, deconvolution of siRNA-pools, and validation using siRNA from a different supplier.
To test these 13 candidate genes further, we obtained a set of different siRNAs from another supplier (Supplementary Fig. S2). Three candidate genes, SLC22A9, SLC29A2, and ABCD1, again showed a significantly different relative luciferase increase in response to TRIAC compared to T3 (Fig. 5). This difference suggested that the knockdown of these genes affected luciferase induction by T3 and TRIAC differently. To study this further, the candidate proteins were subsequently subjected to direct biochemical analysis.
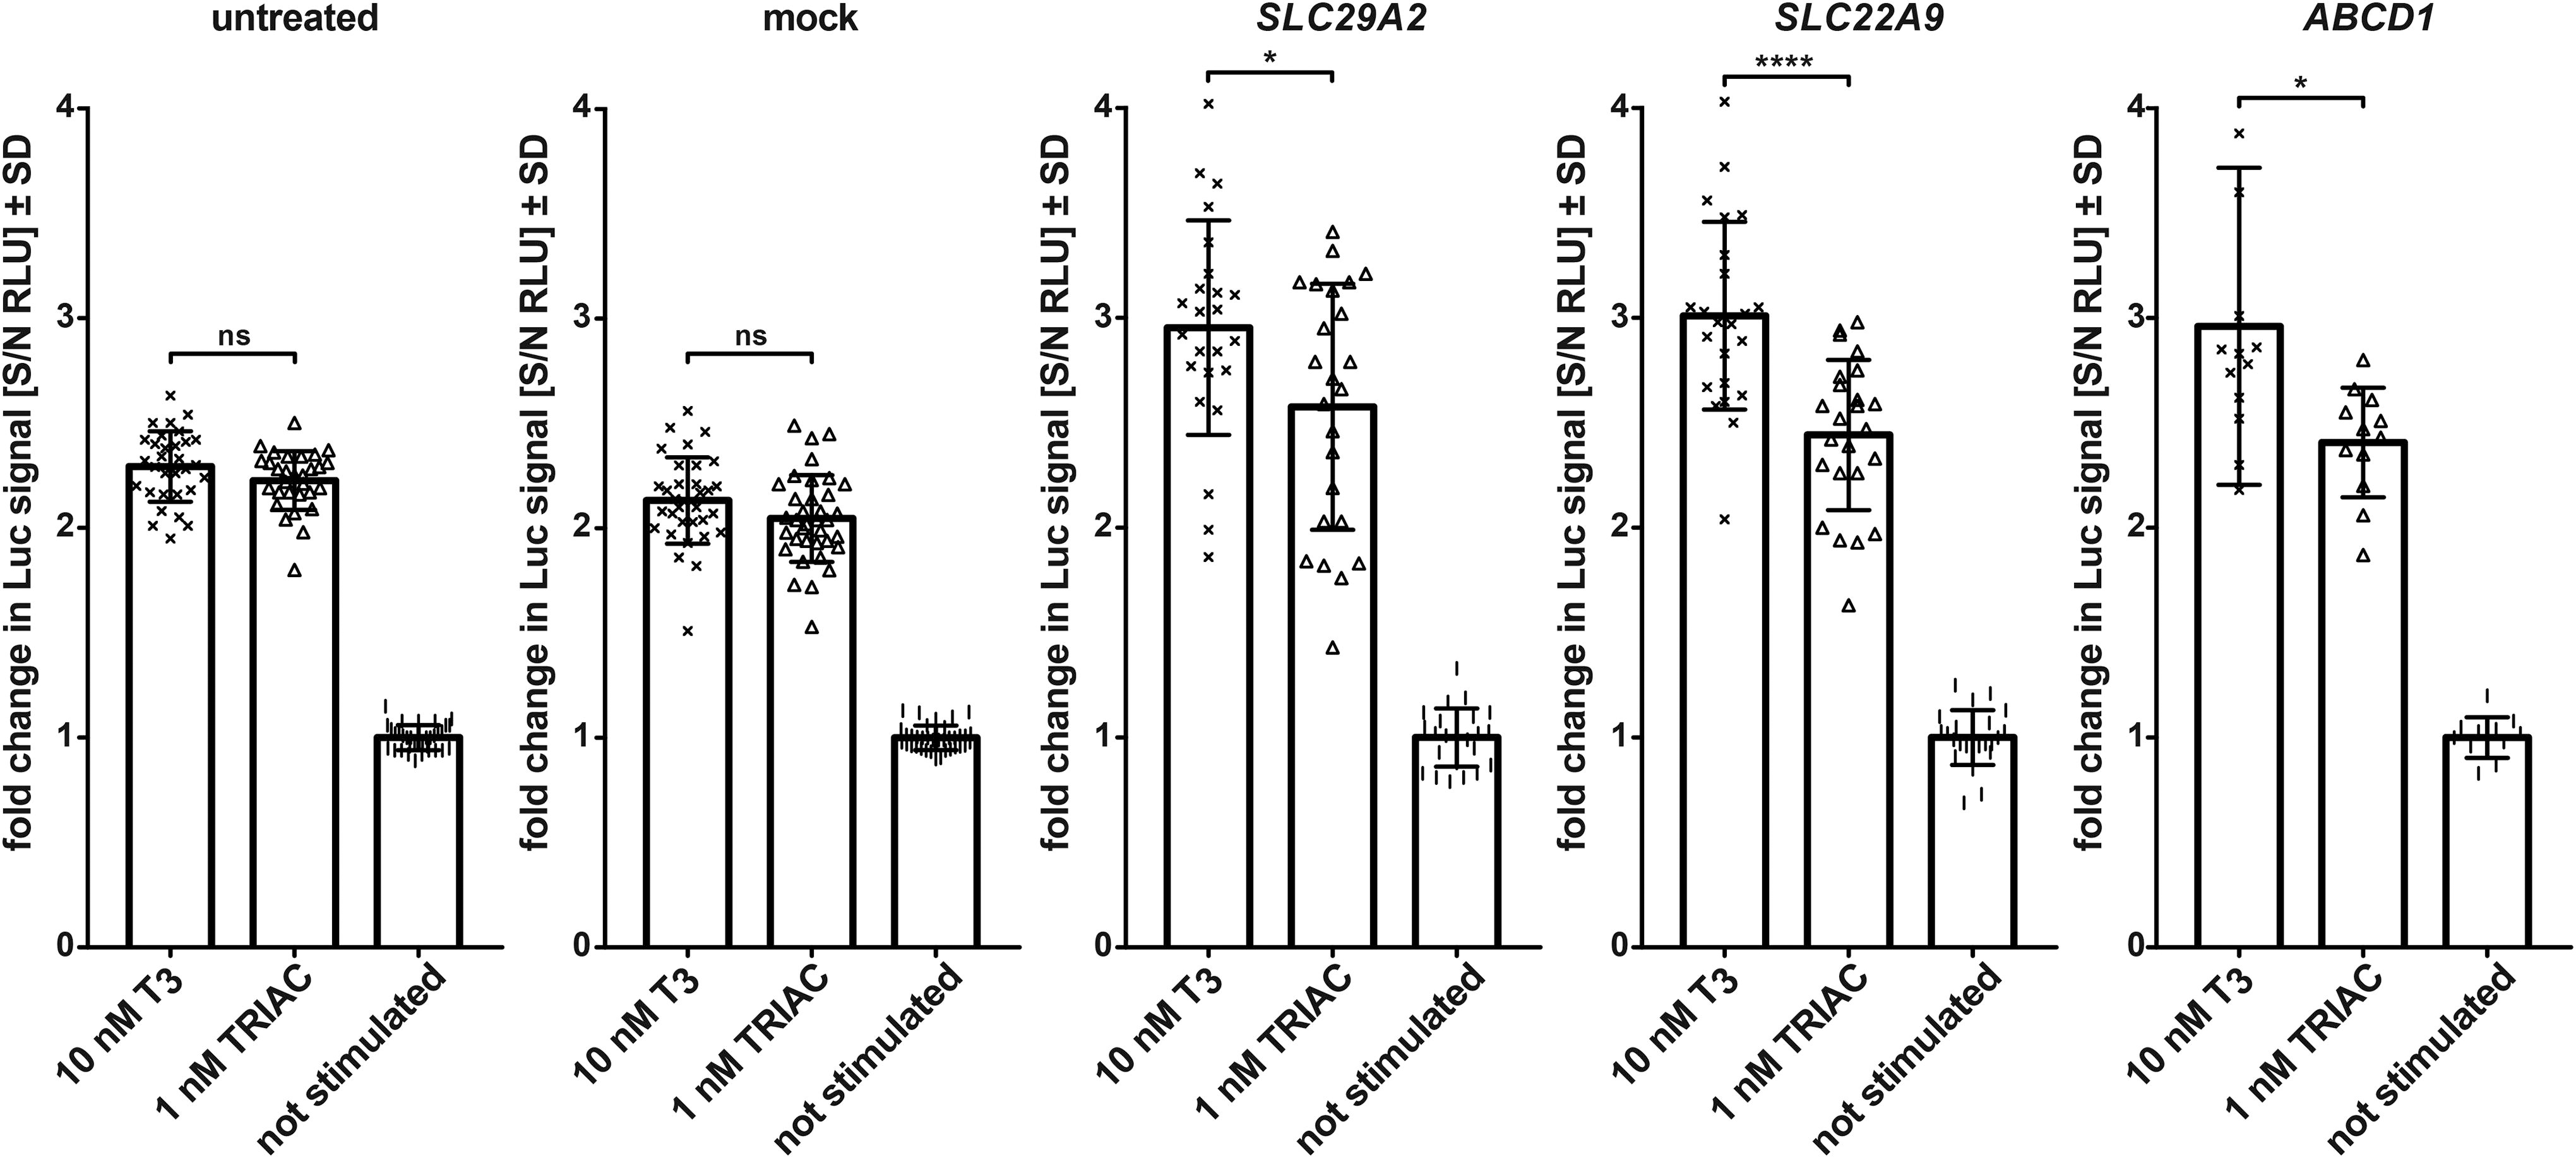
Knockdown of SLC29A2, SLC22A9, or ABCD1 results in a significant difference in the relative luciferase signal from TRIAC compared with T3 in contrast to mock-transfected cells or nontransfected cells. Shown is the change in luciferase signal (fold change in luciferase signal [S/N RLU] ± SD) after stimulation with 10 nM T3 (×) or 1 nM TRIAC (Δ) normalized to the signal without stimulation (|). n ≥ 12. ns, not significant, *p < 0.05, ****p < 0.0001. SD: standard deviation. RLU, relative light unit; TRIAC, 3,5,3'-triiodothyroacetic acid. Data for all 13 candidates from Table 1 are shown in Supplementary Fig. S2.
Cloning of TRIAC transporters and establishment of stably expressing cells
We cloned the three candidate TRIAC transporter cDNAs with a C-terminal myc-tag into an expression vector, which was used to stably transfect MDCK1 cells. Stable transfection was chosen, because we assumed that TRIAC transport is not the primary physiological function of these transporters. Hence, we expected a low signal-to-noise ratio in direct TRIAC uptake assays. We then selected individual MDCK1 cell clones with a high fraction (≥ 89%) of myc-positive cells for further characterization.
Costaining with E-cadherin demonstrated that SLC29A2/ENT2 was strongly expressed in the cells, but only a fraction of immunoreactive protein was expressed along the plasma membrane (Fig. 6). SLC22A9/OAT7 was strongly expressed in the cells and located mainly to the plasma membrane (Fig. 6). ABCD1/ALDP is reported to be primarily located to endoplasmic reticulum, mitochondria, lysosomes, and peroxisomes. Interestingly, the C-terminal myc-tag appeared to partially disrupt its usual targeting, permitting some expression at the plasma membrane (Fig. 6).
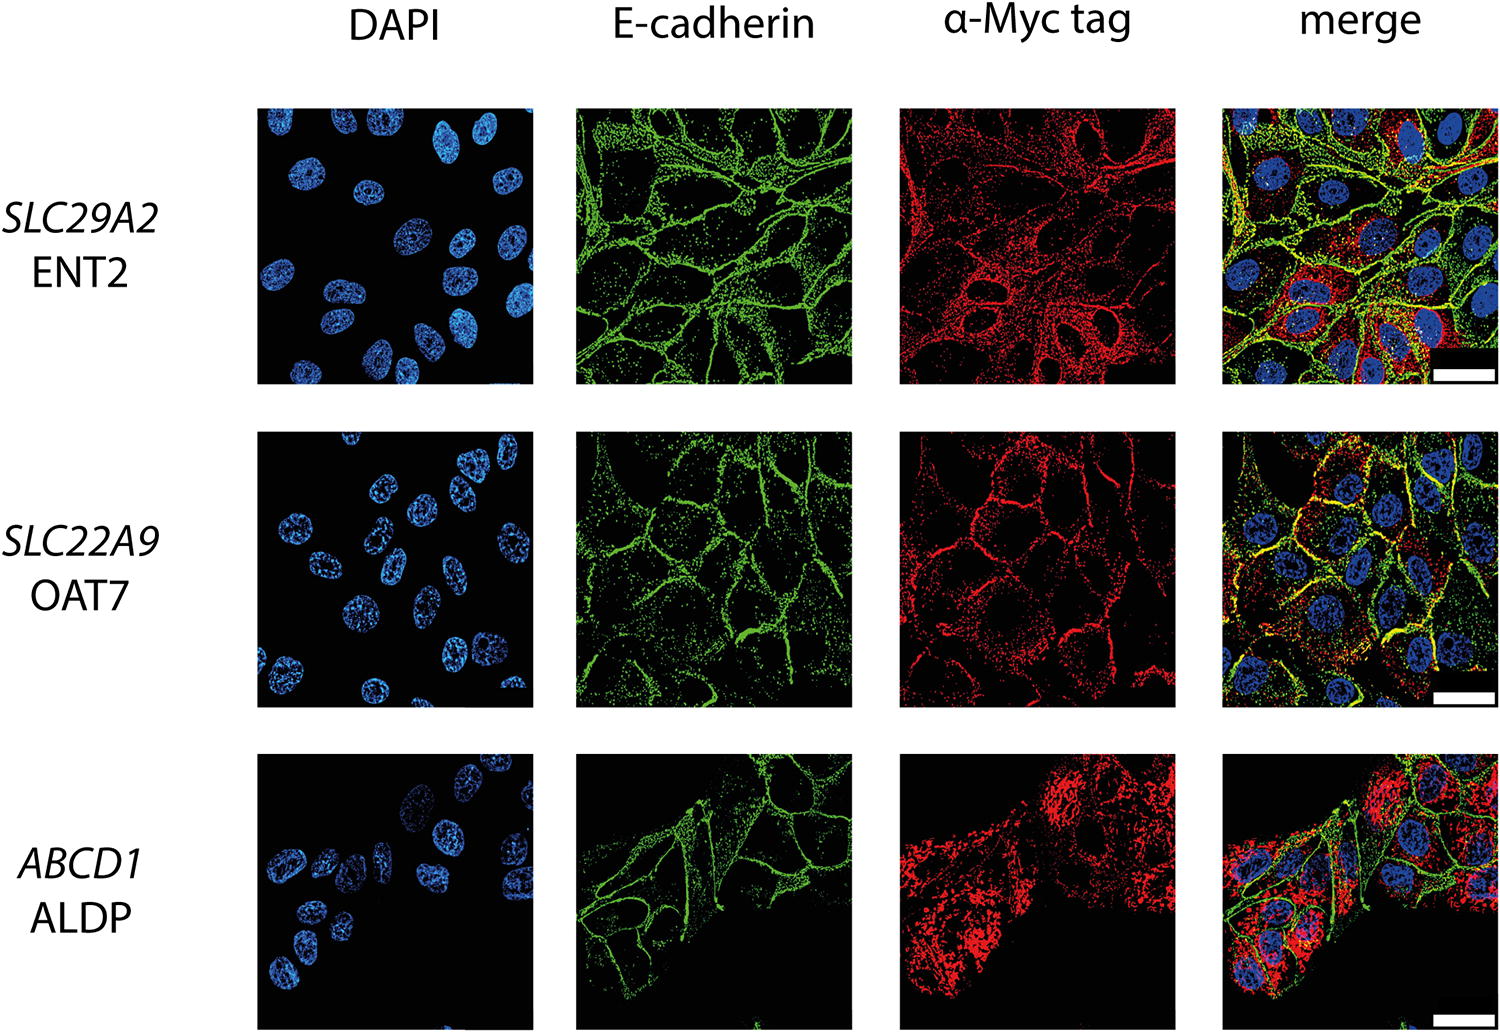
Immunocytochemical detection of TRIAC transporters expressed in MDCK1 cells. Transgenic expression of the transporters is detected by an antibody against the C-terminal myc-tag of the recombinant proteins. The plasma membrane was stained with an antibody against E-cadherin. Nuclei are marked with DAPI. Representative images of one stable clone per transporter. Scale bar: 30 µm. TRIAC, 3,5,3'-triiodothyroacetic acid.
Specific 125I-TRIAC transport by MDCK1 cells stably expressing the candidate transporters
To directly demonstrate the uptake of TRIAC by the candidate transporters, we incubated two independent SLC29A2/ENT2-expressing MDCK1 cell clones with 125I-TRIAC and found a clear time-dependent uptake of radioactivity compared to nontransfected MDCK1 cells (Fig. 7A). Accordingly, coincubation of SLC29A2/ENT2-expressing clones with 125I-TRIAC and the known inhibitor NBTI concentration-dependently reduced 125I-TRIAC uptake (Supplementary Fig. S3).
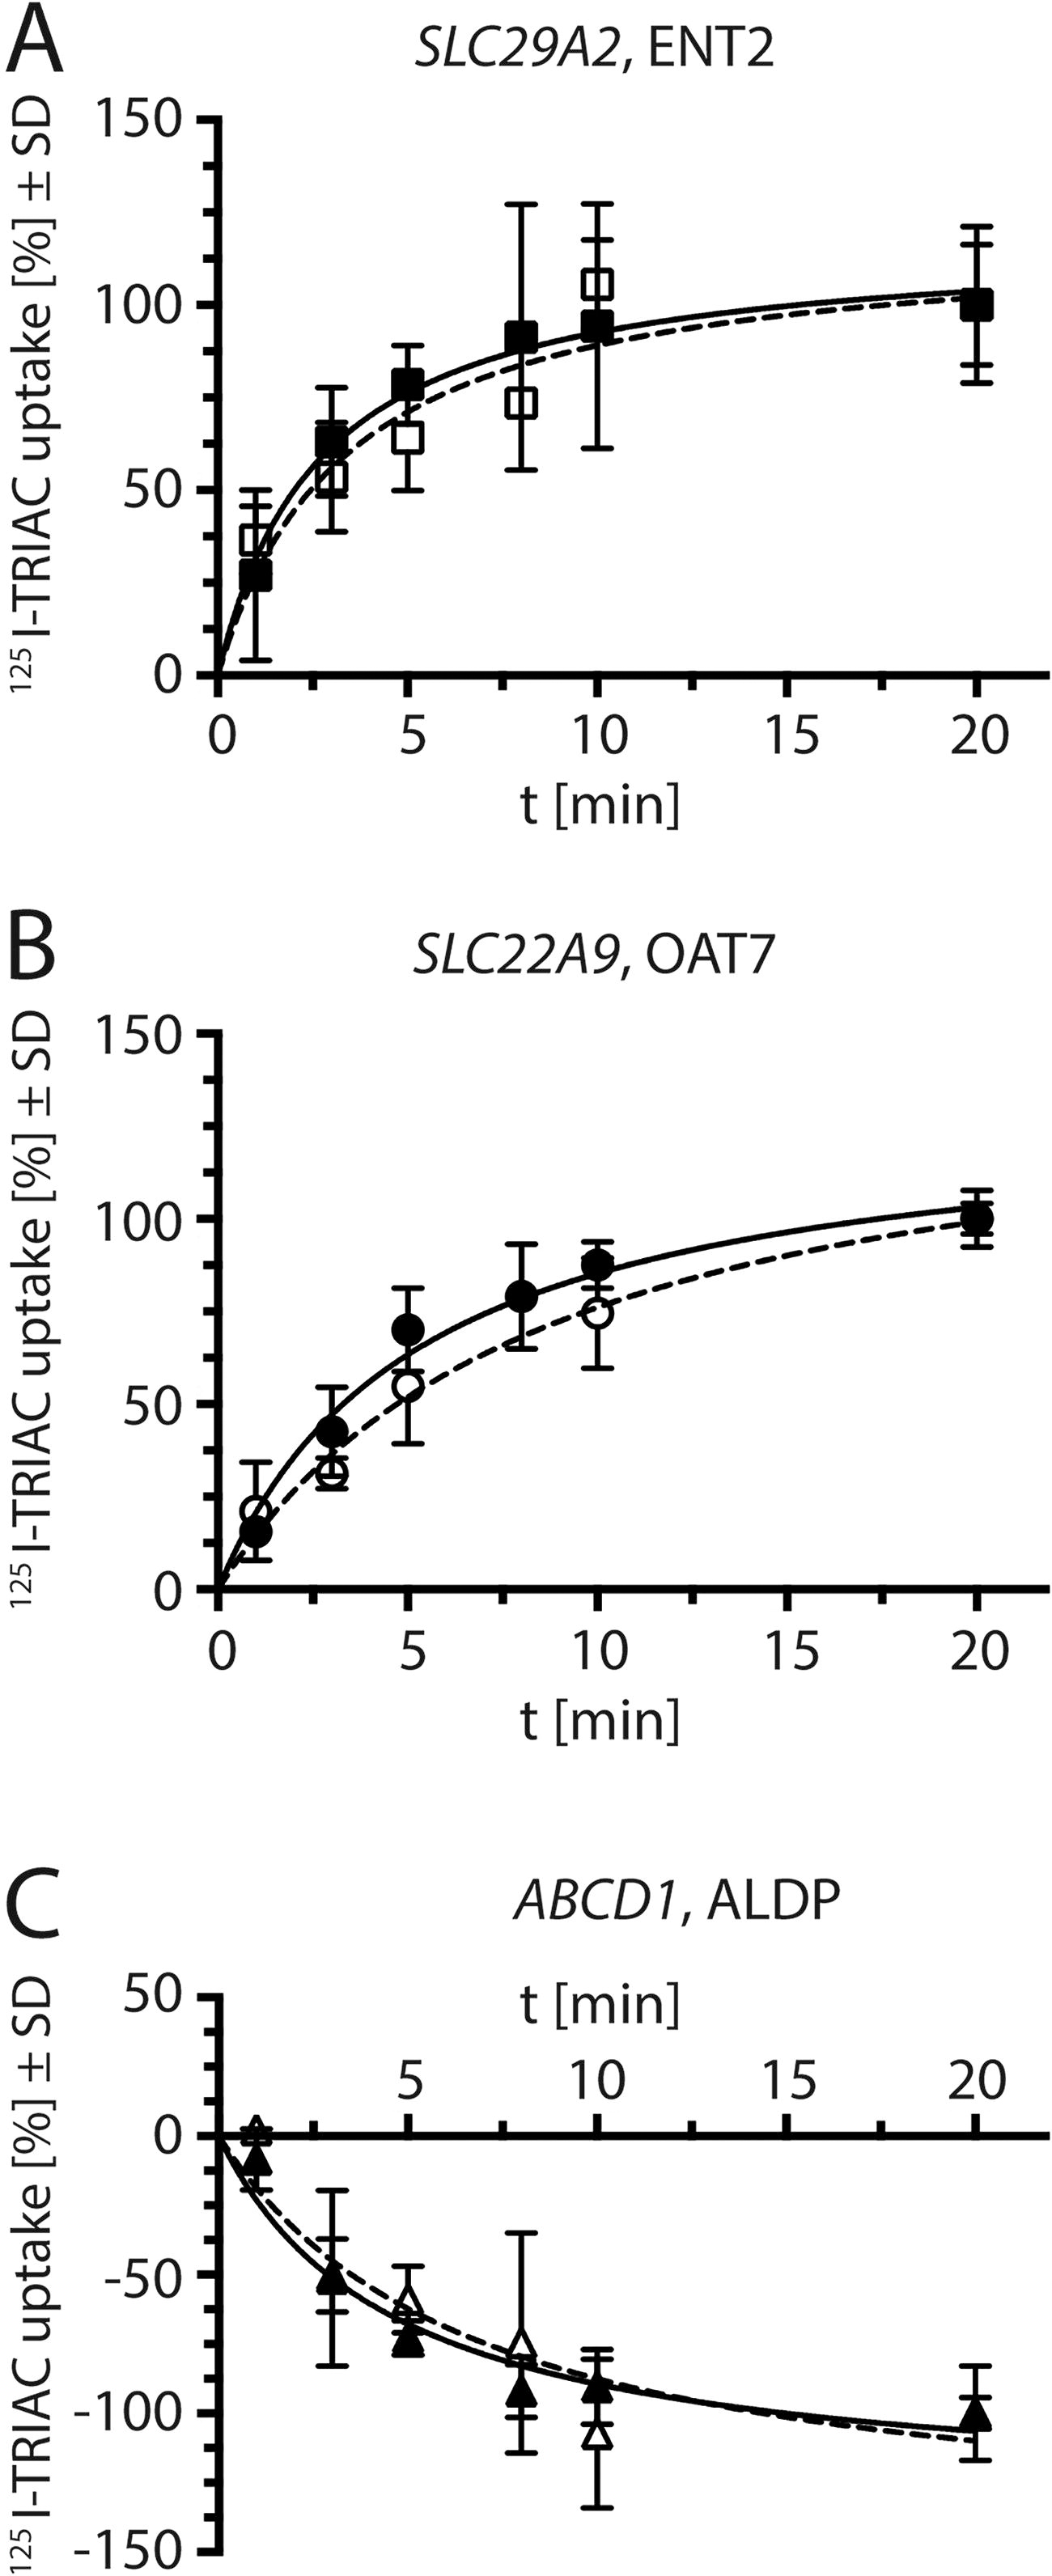
125I-TRIAC transport activity of stably transfected MDCK1 cells.
Two independent SLC22A9/OAT7-expressing clones showed a time-dependent uptake of 125I-TRIAC above the uptake of nontransfected cells (Fig. 7B). Again, coincubation of SLC22A9/OAT7-expressing clones with 125I-TRIAC and the inhibitor estrone-3-sulfate (E3S) reduced 125I-TRIAC uptake in a concentration-dependent manner (Supplementary Fig. S3).
In order to further characterize these transporters and because SLC22A9/OAT7 reportedly exhibited weak T4 uptake activity, 31 we tested the direct uptake of 125I-T3 and 125I-T4 in our transfected cells. Only SLC22A9/OAT7 displayed weak T4 uptake activity (Supplementary Fig. S4). ABCD1/ALDP is an ATP-dependent pump, which implies that the substrate is exported from the side of the membrane where ATP is hydrolyzed. Hence, it is clear that this protein acts as an exporter. Accordingly, in two independent clones 125I-TRIAC uptake was counter-acted by ABCD1/ALDP expression, showing a decrease of radioactivity compared to nontransfected cells (Fig. 7C). Taken together, SLC29A2/ENT2 and SLC22A9/OAT7 are transporters capable of TRIAC transport into cells. ABCD1/ALDP can act as a TRIAC exporter from cells.
Discussion
Through a genome-wide RNAi screen followed by biochemical characterization, we have identified two human SLC-family transporters, SLC29A2/ENT2 and SLC22A9/OAT7, that can mediate the uptake of TRIAC into cells and may represent the basis for the effects of TRIAC in MCT8-deficient patients. ABCD1/ALDP was identified within the same screen as a TRIAC exporter. Expression of this protein may thus limit the efficacy of TRIAC treatment in certain cells. That TRIAC is taken up into cells in a protein-dependent manner is supported by decreased uptake at lower temperature, sensitivity to inhibitors, knockdown of transporter genes in a reporter gene assay, and enhanced uptake or export of 125I-TRIAC by cells overexpressing the candidate transporters. The same criteria were used for establishing that TH depends on MCT8. 12,29
SLC29A2/ENT2 is ubiquitously expressed in many cell types and organs, including liver, pituitary, and brain. Its expression has been described along the BBB at luminal and abluminal membranes of endothelial cells, in astrocytes, and neurons. 32,33 SLC29A2/ENT2 has been described as comparably abundant along the BBB. 34 Others described its localization along the basolateral membrane of transfected polarized MDCK1 cells 35 and at the apical membrane of Sertoli cells. 36 The physiological substrates of the ENT2 uniporter activity include purine and pyrimidine nucleobases and, at 10-fold lower KM, the respective nucleosides. 37 Hence, TRIAC is a substrate of similar size and shape compared to nucleosides, but carries a negative charge in contrast to the previously described substrates. Based on its ubiquitous expression pattern, in particular its expression along the blood–brain barrier, we speculate that SLC29A2/ENT2 may be involved in the cerebral uptake of TRIAC. This could be tested in mouse models lacking Slc29a2 expression.
SLC22A9/OAT7 is expressed in hepatocytes, endothelial cells, and neurons. Hence, while the expression pattern is more limited compared to SLC29A2/ENT2, this transporter could contribute to TRIAC uptake in liver and neurons. The substrate spectrum of SLC22A9/OAT7 ranges from conjugated steroids and T4 to pravastatin. 31,38,39 In addition, it was shown that SLC22A9/OAT7 also accepts short chain fatty acids like propionate, butyrate, and valerate, which may be exchanged with E3S and DHEA-S. 38 Based on its properties as an organic anion transporter, we deem it very likely that TRIAC might be its substrate also in vivo. Again, experiments using Slc22a9-deficient mouse models could help to confirm this idea.
ABCD1/ALDP has been identified as the gene mutated in X-linked adrenoleukodystrophy. 40 It is expressed in many organs, including the brain, and is located to peroxisomes, endoplasmic reticulum, and mitochondria. Its main function is the ATP-dependent transfer of very long chain fatty acids (VLCFA) into the peroxisome, where they are subjected to beta-oxidation. 41 It appears that ABCD1/ALDP also exports TRIAC from the cytoplasm in HepG2 cells and it was thus identified in the RNAi screen. In direct 125I-TRIAC uptake experiments, ABCD1/ALDP worked against TRIAC accumulation. Such a result is only compatible with export of 125I-TRIAC from the cells over the plasma membrane, even though only a small fraction of transfected ABCD1/ALDP was found at the plasma membrane, possibly because the addition of a C-terminal myc-tag impinged on protein targeting. We speculate that endogenous ABCD1/ALDP is rather expected to transfer TRIAC into peroxisomes, possibly into mitochondria. Inhibition of ABCD1/ALDP is likely not a viable therapeutic option for the treatment of MCT8-deficient patients, because of its essential function in VLCFA oxidation.
TRIAC transporters are apparently expressed in neural cells during early brain development. Cortical organoids deficient for MCT8 responded to TRIAC and normalized neuronal and glial gene expression in response to TRIAC. 10 In MCT8-deficient patients treated with TRIAC, 23,24 thyrotropin s suppressed in the pituitary and T3 and T4 levels are massively decreased resulting in an improvement of the previously thyrotoxic state. This observation implies that TRIAC is taken up into thyrotropic cells. Furthermore, it has been reported that the patients’ heart rates are normalized suggesting that, while T3 levels are reduced, TRIAC does not, in turn, stimulate heart rate on its own. Hence, TRIAC may not be readily taken up into the heart and this is the basis of its use in patients with resistance to thyroid hormones. 11 Knowledge of TRIAC transporter expression patterns, also during brain development, may thus in the future help to interpret observations on TRIAC effects, as well as understand why TRIAC may not show a desirable effect on cells or organs potentially not expressing appropriate transporters. In addition, drug interactions may be rationalized once the transporters involved are known. Due to the stringency of our screening procedure and because we limited our screen on HepG2 cells, we cannot rule out that more human transporters exist that are capable of TRIAC uptake.
Footnotes
Acknowledgments
The authors thank Sabrina Kleissle for her technical support during the screening set up and screening process, Tobias Stauber, Florian Ulrich, and Thomas Jentsch for consulting and discussions in the early development of the screening system, and Claudia Rutz for the discussions and expertise in developing the stable cell line.
Authors’ Contributions
P.C.B.: investigation and review and editing. M.G.-S.: investigation and review and editing. K.L.: investigation. N.S.: investigation and review and editing. D.B.: investigation and review and editing. I.M.: investigation and review and editing. K.R.: methodology. L.S.: supervision and review and editing. J.K.: supervision and review and editing. J.P.v.K.: investigation and supervision. U.S.: conceptualization, supervision, writing—original draft, and review and editing. G.K.: conceptualization, supervision, writing—original draft, and review and editing. J.P.: conceptualization, supervision, writing—original draft, and review and editing.
Data Availability
Full analysis of each of the separate screening stages can be obtained from the authors upon request.
Author Disclosure Statement
The authors have nothing to disclose.
Funding Information
Deutsche Forschungsgemeinschaft DFG PR1616/2-1 to Jonas Protze, KR1273/9-1 to Gerd Krause, SCHW914/7 to Ulrich Schweizer, BR5614/1 to Doreen Braun. Lutz Schomburg is supported by DFG, CRC/TR 296 “Local control of TH action” (LocoTact, P17).
Supplementary Material
Supplementary Figure S1
Supplementary Figure S2
Supplementary Figure S3
Supplementary Figure S4
Supplementary Table S1