
Abstract
Background:
The thyroid gland is susceptible to abnormal epithelial cell growth, often resulting in thyroid dysfunction. The serine–threonine protein kinase mechanistic target of rapamycin (mTOR) regulates cellular metabolism, proliferation, and growth through two different protein complexes, mTORC1 and mTORC2. The PI3K-Akt-mTORC1 pathway’s overactivity is well associated with heightened aggressiveness in thyroid cancer, but recent studies indicate the involvement of mTORC2 as well.
Methods:
To elucidate mTORC1’s role in thyrocytes, we developed a novel mouse model with mTORC1 gain of function in thyrocytes by deleting tuberous sclerosis complex 2 (TSC2), an intracellular inhibitor of mTORC1.
Results:
The resulting TPO-TSC2KO mice exhibited a 70–80% reduction in TSC2 levels, leading to a sixfold increase in mTORC1 activity. Thyroid glands of both male and female TPO-TSC2KO mice displayed rapid enlargement and continued growth throughout life, with larger follicles and increased colloid and epithelium areas. We observed elevated thyrocyte proliferation as indicated by Ki67 staining and elevated cyclin D3 expression in the TPO-TSC2KO mice. mTORC1 activation resulted in a progressive downregulation of key genes involved in thyroid hormone biosynthesis, including thyroglobulin (Tg), thyroid peroxidase (Tpo), and sodium–iodide symporter (Nis), while Tff1, Pax8, and Mct8 mRNA levels remained unaffected. NIS protein expression was also diminished in TPO-TSC2KO mice. Treatment with the mTORC1 inhibitor rapamycin prevented thyroid mass expansion and restored the gene expression alterations in TPO-TSC2KO mice. Although total thyroxine (T4), total triiodothyronine (T3), and TSH plasma levels were normal at 2 months of age, a slight decrease in T4 and an increase in TSH levels were observed at 6 and 12 months of age while T3 remained similar in TPO-TSC2KO compared with littermate control mice.
Conclusions:
Our thyrocyte-specific mouse model reveals that mTORC1 activation inhibits thyroid hormone (TH) biosynthesis, suppresses thyrocyte gene expression, and promotes growth and proliferation.
Introduction
Tuberous sclerosis (TS) is an autosomal dominant disorder resulting from mutations in TSC1 or TSC2 gene, leading to hyperactivation of the mechanistic target of the rapamycin complex 1 (mTORC1) pathway. 1,2 Dysregulated mTORC1 signaling in these patients leads to increased cell growth and proliferation, manifesting as benign tumors in the brain, skin, heart, lungs, and kidneys. 3 Neurological symptoms, including seizures, autism spectrum disorder, and cognitive disability, are also observed. 4 The incidence of TS is approximately 1 case per 6,000–10,000 live births. 5 Emerging evidence suggests that the thyroid gland is a target of TS. 6 –12 In routine chest computed tomography for lung disease assessment, 20% of TS patients exhibited thyroid nodules, with half of them diagnosed with multiple nodules. 7 Thyroid abnormalities in TS, although less frequent, encompass papillary and medullary thyroid carcinoma, 6,8 as well as hypothyroidism. 9,10
mTORC1 is a downstream effector for growth factors, hormones, cellular energy, and nutrients—particularly amino acids—and integrates information on nutritional abundance and environmental status to balance anabolism and catabolism. 13 –17 mTORC1 has been proposed as the intracellular hub for the cooperative action of TSH, insulin (INS), and IGF1 in thyrocyte proliferation and growth. 18 –21 In addition, mTORC1 activity is enhanced in the thyroid of mice undergoing diet-induced goiter. 20 –23 Data from transgenic mouse models also indirectly suggest that mTORC1 is critical for TSH and INS/IGF1 signals. 23 –25 Moreover, several common oncogenic signaling pathways converge to mTORC1 26 –28 and evidence indicates its involvement in the progression of more lethal forms of thyroid cancer. 29 –34 In this context, both PI3K-AKT and RAS-RAF-ERK signaling pathways converge to TSC1/2 to stimulate mTORC1 activity. 35 –37 Nevertheless, the direct in vivo effects of mTORC1 on thyrocytes have not been addressed so far.
While the mTORC1 pathway has been studied in the context of thyrocyte proliferation and growth, its role in TH synthesis and thyroid function remains unclear. 38 –40 The regulation of NIS expression and activity exemplifies this controversy. Studies demonstrated that INS and IGF1 have opposing actions of TSH by inhibiting NIS expression in the thyrocytes. 19,41,42 This inhibitory effect was shown to be mediated by PI3K 19,41,42 and mTORC1.41 However, recent studies in primary human thyrocytes reported that TSH and IGF1 elicit synergistic effects on NIS mRNA and protein. 39,40 Whether mTORC1 controls NIS expression and thyrocyte differentiation is clinically relevant because the loss of NIS expression in thyroid cancer is the proposed mechanism for the refractory response to radioiodine therapy. 43 However, recent data in papillary thyroid carcinoma indicate that mTORC2, but not mTORC1, is overactivated and suppresses NIS expression. 30,31
The discrepancy likely stems from the lack of in vivo animal models to study mTORC1 or mTORC2 induction. Our present understanding of mTORC1’s role in thyrocytes is primarily based on in vitro studies, which do not fully recapitulate in vivo TH synthesis and secretion due to the disruption of the critical angiofollicular unit and cell polarity. 44 To assess the impact of mTORC1 activation on thyrocyte function, we generated a new mouse model of mTORC1 gain of function by specifically deleting the TSC2 gene in thyrocytes (TPO-TSC2KO mice). These mice exhibit highly active mTORC1 activity in the thyroid gland, allowing us to directly investigate mTORC1 biological effects.
Material and Methods
Animals
All experimental procedures were planned following the American Thyroid Association guide to investigating TH economy and action in rodent and cell models 45 and approved by the local Institutional Animal Care and Use Committee (IACUC 20–166). Mice were maintained at 22 ± 1°C on a 12-hour light–dark cycle, with free access to food and water. Thyroid-specific TSC2 knockout mice (TPO-TSC2KO ) were generated by crossing Tsc2flox / flox mice 46 (Jax lab-Strain #:027458) with mice expressing the Cre recombinase gene under the control of the TPO promoter. 47 We used littermates Tsc2flox / flox or TPO-cre mice as controls. The age and sex of mice are highlighted in all the figure legends. Rapamycin-treated mice received daily intraperitoneal injections of either 2 mg/Kg of b.w. Rapa (Cayman Chemical Company) or vehicle [5.2% poly(ethylene glycol) and 5.2% Tween 80; Sigma-Aldrich] from 3 to 8 weeks of age.
Body composition and hormone measurements
Dual-energy X-ray absorptiometry (DEXA; Lunar Pixi) determined lean body mass and fat mass. Mice were fasted for 4–5 hours and anesthetized with ketamine–xylazine (36 mg/kg and 4 mg/kg) before imaging. For hormone assessment, blood samples were collected in K2EDTA-coated tubes and centrifuged at 1000 g for 10 minutes within 30 minutes of collection. Total thyroxine (T4) and total triiodothyronine (T3) were measured using 25 μL of plasma and ELISA kits (Cusabio). TSH levels were determined using Luminex multiplex technologies with one-plex beads (Milliplex Mouse Pituitary Magnetic Bead Panel, Millipore). All hormone determinations were performed according to the manufacturer’s instructions.
Western blotting
One thyroid lobe was lysed in buffer containing 125 mM Tris (pH 6.8), 1 mM dithiothreitol, 2% SDS, 1 μM phenylmethylsulfonyl fluoride, and protease and phosphatase inhibitor cocktails (Roche Diagnostics). Thirty micrograms of protein was denatured in the presence of 10% β-mercaptoethanol and separated by electrophoresis into 4–20% gradient SDS–PAGE gels. Proteins were transferred to polyvinylidene difluoride (PVDF) membranes (Millipore) overnight. After 1 h in blocking buffer, membranes were incubated overnight at 4°C with primary antibodies, listed in Supplementary Table S1. Immunocomplexes were detected using fluorescent secondary antibodies and the Odyssey FC Imager (LI-COR Biosciences). Quantification was performed using ImageJ 1.43 u software.
Real-time PCR
One thyroid lobe was used for total RNA extraction (RNeasy Micro Kit, Qiagen). cDNA was synthesized using reverse transcriptase reaction (High-Capacity cDNA Reverse Transcription kit, Applied Biosystems). Real-time PCRs were run in duplicate using PerfeCTa SYBR Green FastMix ROX gene expression assay (Quantabio) in the QuantStudio 3 real-time PCR system (Applied Biosystems). mRNA expression was calculated using the relative standard curve method and normalized for the housekeeping gene CycloB. Primers were validated using a standard curve prepared with a mixture of cDNA from all samples (r 2 > 0.98 and efficiency ∼80–110%), and are listed in Supplementary Table S2.
Histological analysis
Thyroids were fixed in 4% paraformaldehyde overnight, followed by dehydration in ethanol. Five microgram paraffin sections were stained with periodic acid-Schiff (PAS) or hematoxylin and eosin for morphometric analysis, according to. 45,48,49 High-resolution images were obtained using a digital camera (DFC360FX camera, Leica Microsystems) coupled to a microscope (Leica DM5500B, Leica Microsystems). Images were captured with Leica Application Suite X (LAS X). PAS images were used for the quantification of follicular, colloid, and epithelial (total area—colloid area) areas. 45,48,49 At least 100 follicles per mouse were included in the analysis. All the measurements were performed using the ImageJ software.
Thyrocyte proliferation quantification
Mouse thyroids attached to the trachea were fixed by immersion in 4% paraformaldehyde overnight at 4°C and embedded in paraffin. To determine the number of proliferating thyrocytes, 5 μm sections were stained for Ki-67 and TTF-1 (nuclear thyroid marker) using anti-Mo/Rt Ki-67 (Invitrogen) and anti-TTF-1 (D2E8) rabbit mAb (Cell Signaling Technology) primary antibodies. Fluorescent images were captured with a Leica DM5500B microscope equipped with a motorized stage and a DFC360FX camera (Leica Microsystems). The microscope was controlled by the OASIS-blue PCI controller and the Leica Application Suite X (LAS X). Ki-67+ and TTF-1+ cells were quantified by ImageJ.
Statistical analyses
For normally distributed data, results are presented as mean ± standard error of the mean (SEM) and analyzed as follows: (1) Student’s t-test for comparisons between two groups or (2) two-way ANOVA to analyze the effect of two independent factors followed by Tukey post hoc analysis. Non-normal distributed data are presented as median and quartiles (violin plot), and the Mann–Whitney U test was used to compare the two groups. Results were considered statistically significant if p < 0.05. Statistical analyses and graphing were performed using GraphPad Prism version 9.4 (GraphPad Software).
Results
Activation of mTORC1 promotes thyroid gland growth
Thyroids of TPO-TSC2KO mice had a 70–80% decrease in TSC2 protein levels and a - to 6-fold induction of mTORC1 activity (pS6) in both females and males at 6 and 12 months of age (Fig. 1). In contrast, mTORC2 activity decreased (pAkt) due to the S6 kinase negative feedback 50 –52 (Fig. 1). ERK1/2 activation was normal in both sexes at 6 months of age (Supplementary Fig. S1). While male and female TPO-TSC2KO mice did not gain weight as littermate control mice (Fig. 2A), male mice had less fat mass at 12 months of age (Fig. 2B and C). Thyroid mass was higher in TPO-TSC2KO mice compared with the thyroid of control animals at 1, 2, and 6 months of age (Fig. 2D–F).
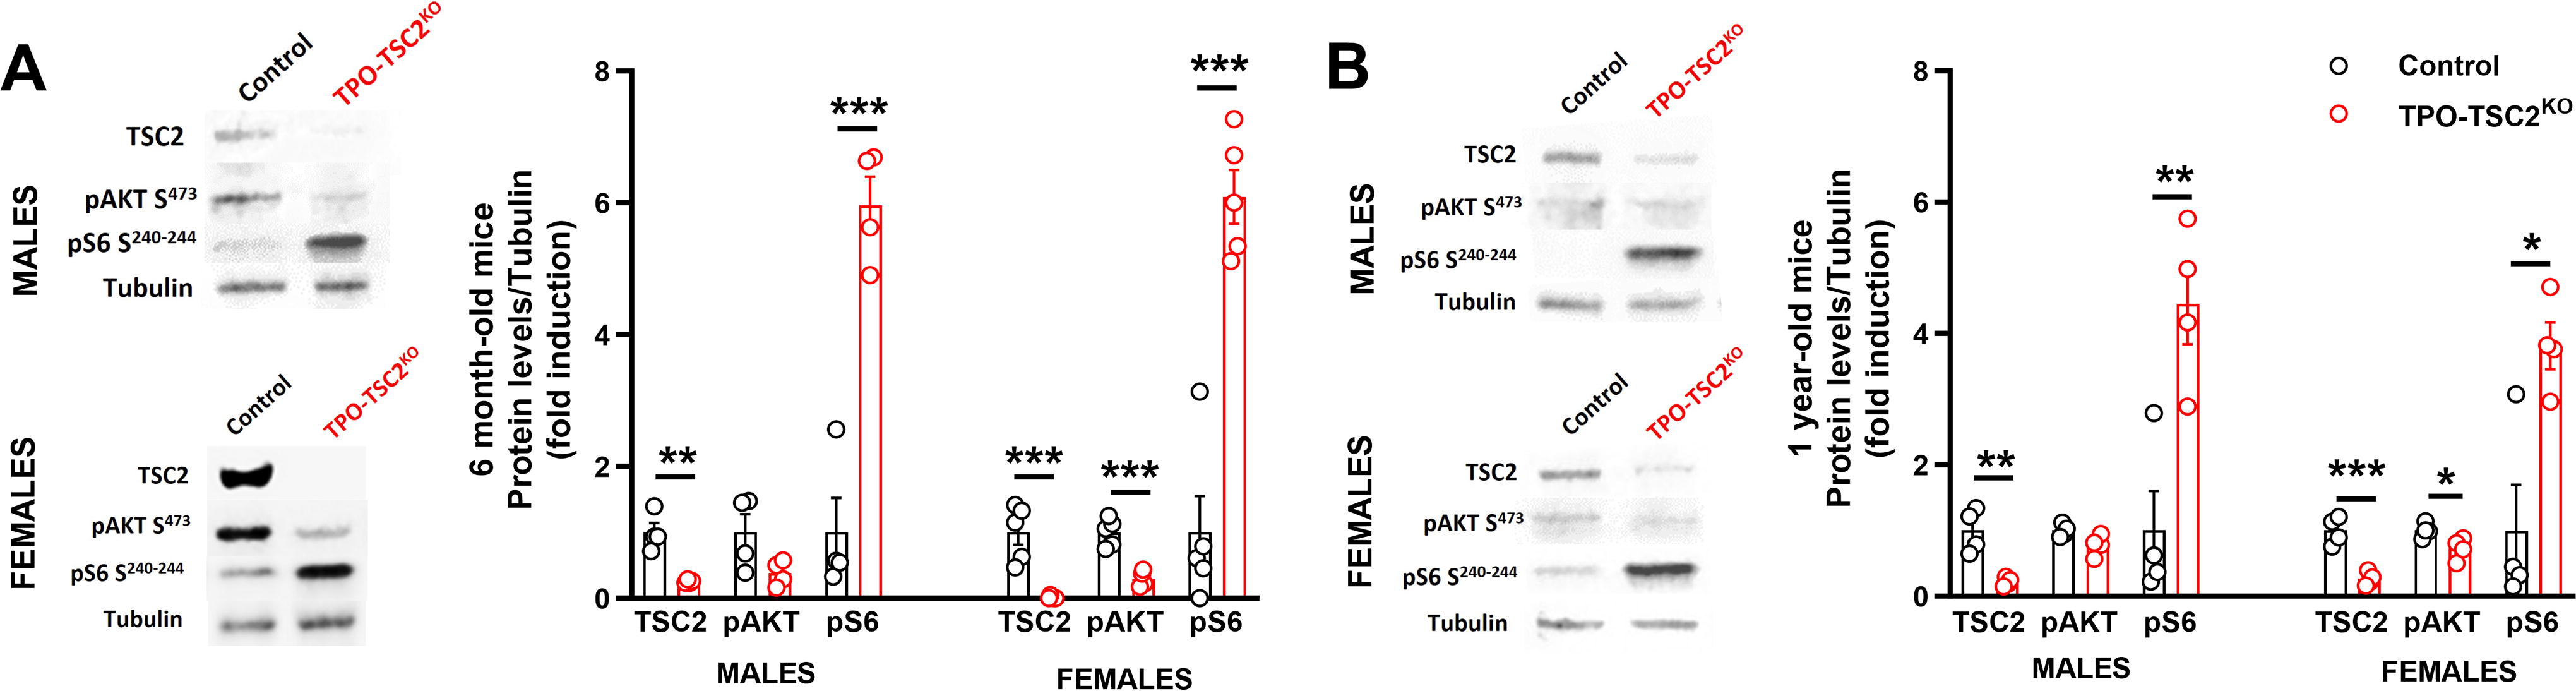
Activation of mTORC1 in the TPO-TSC2 knockout model.
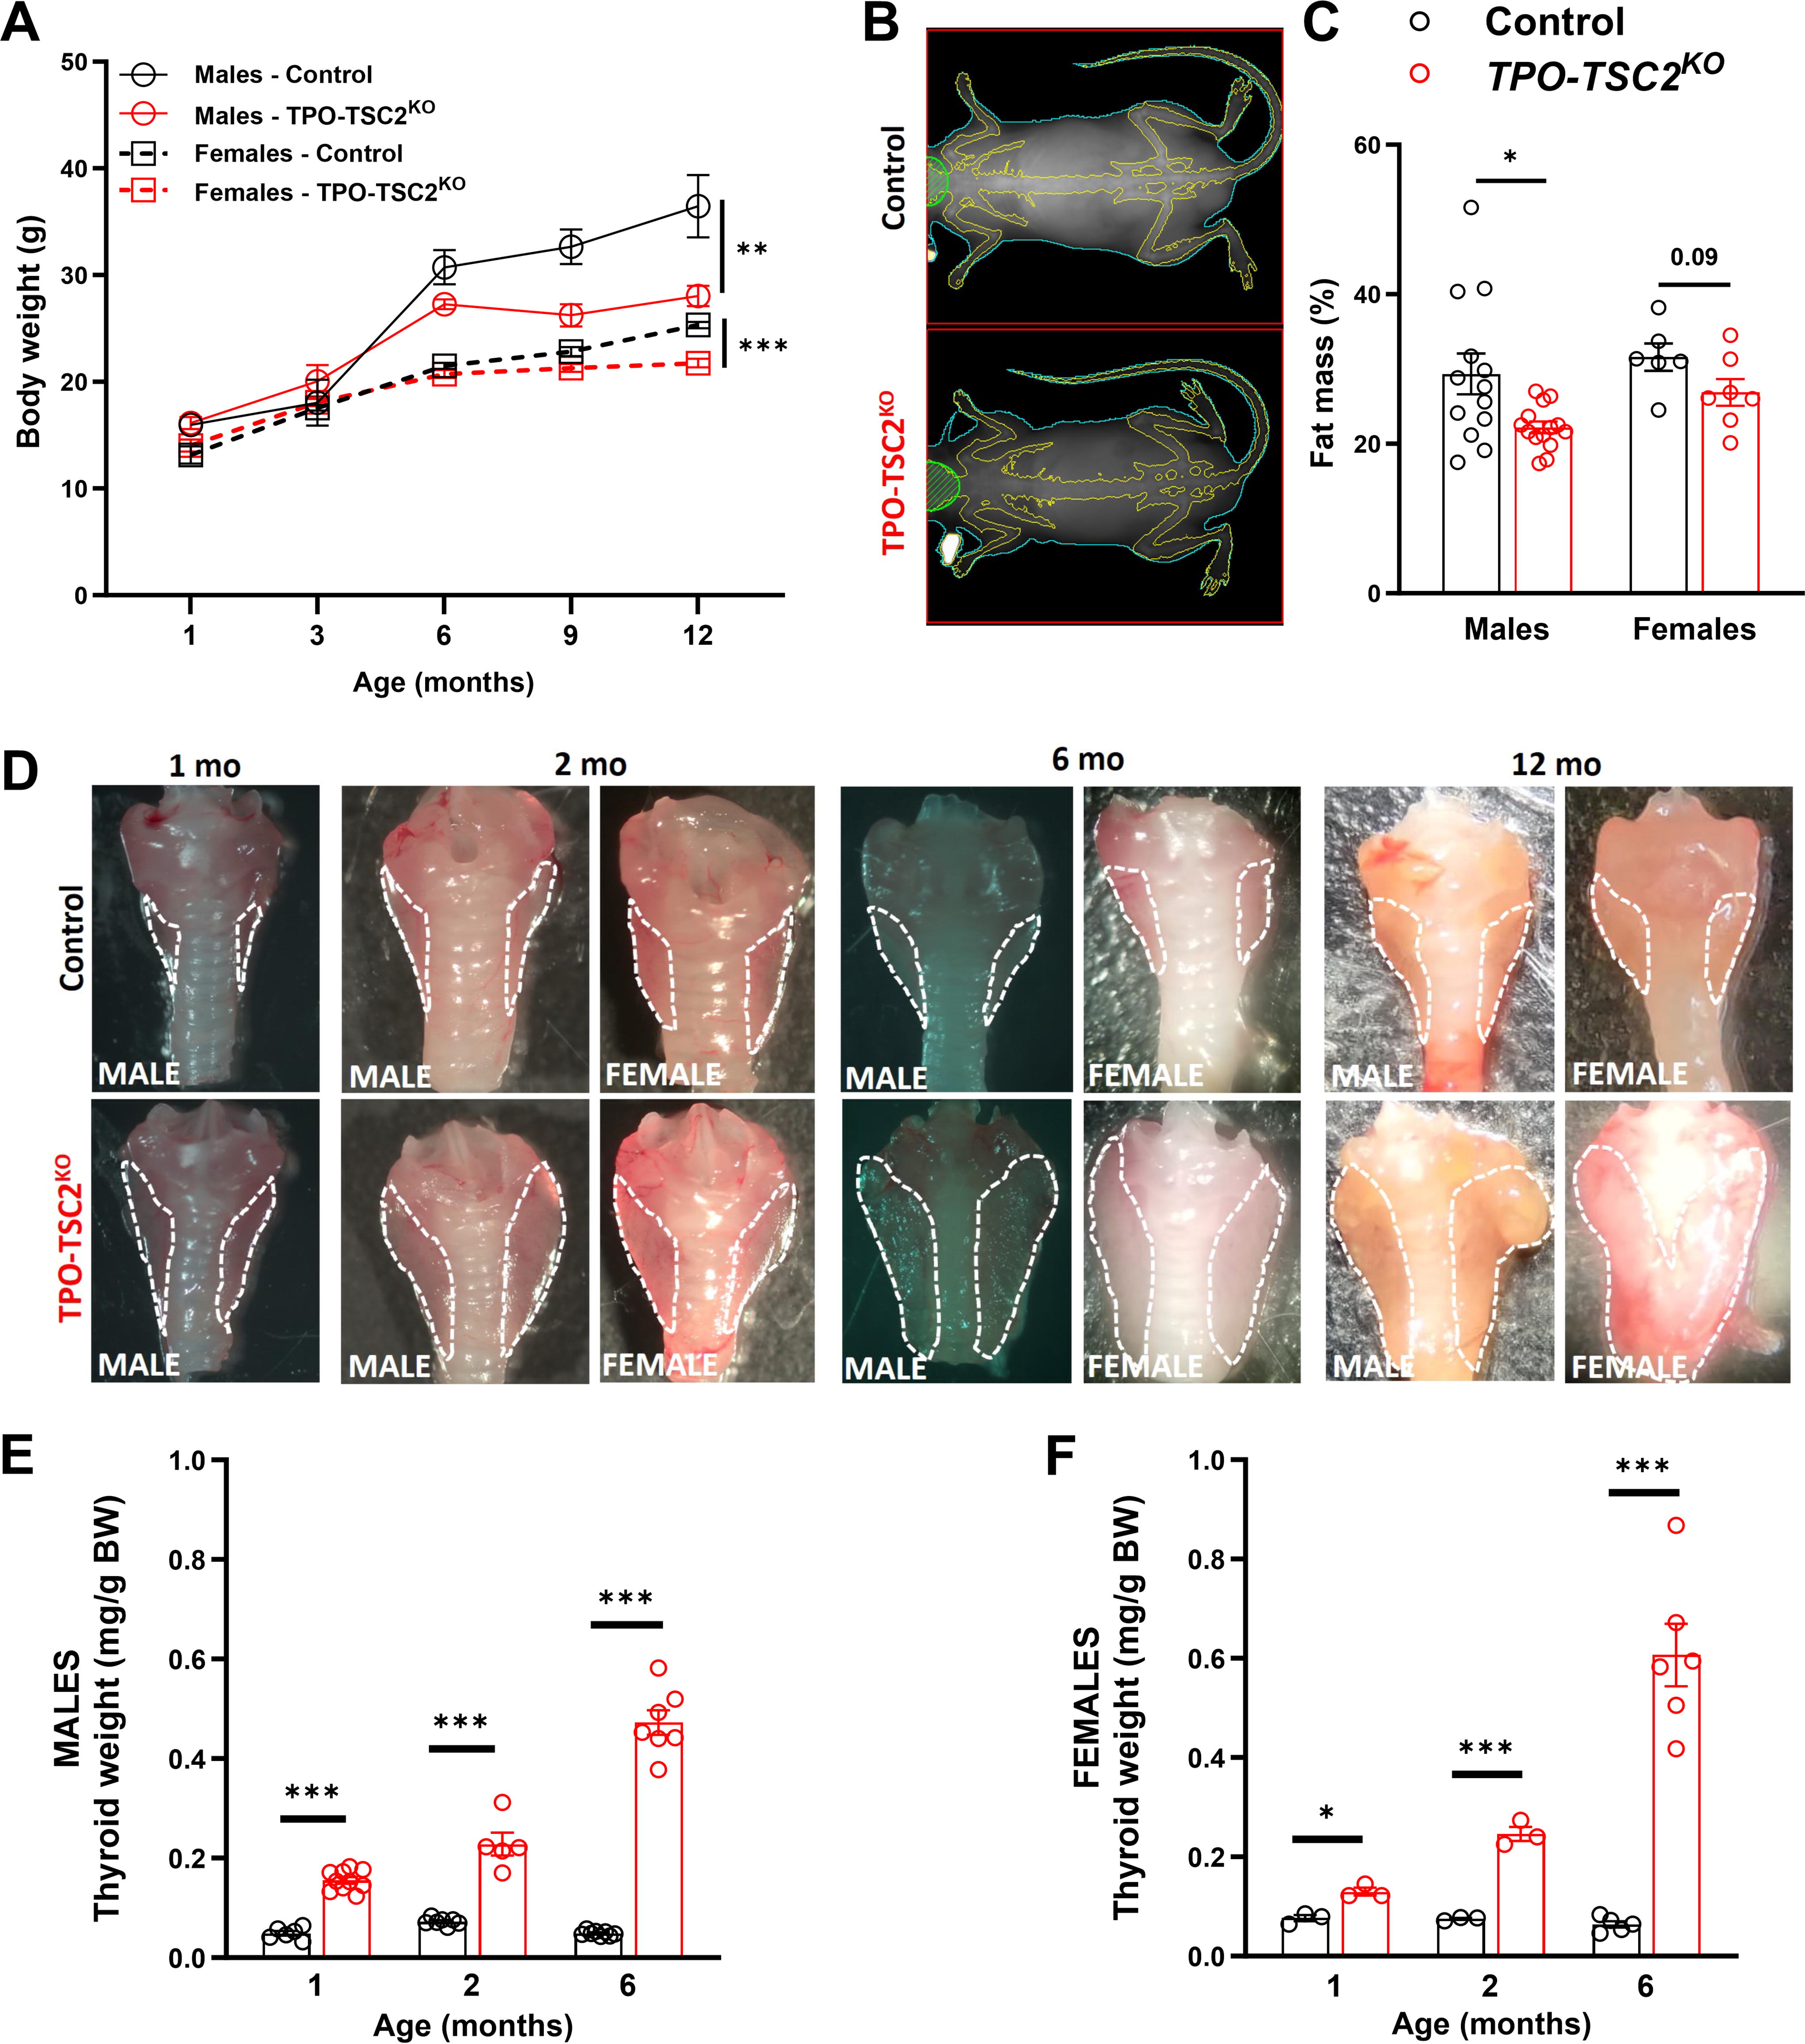
mTORC1 activation in thyrocytes induces a striking and progressive enlargement of the thyroid gland.
mTORC1 increases thyrocyte hypertrophy and proliferation
We next assessed the thyroid gland structure and thyrocyte proliferation to understand how mTORC1 promotes thyroid growth. We measured ∼100 follicles of each female mouse and observed a threefold increase in the follicular area (Fig. 3A and B). This was explained by a twofold increase in both the colloid and epithelium areas (Fig. 3C and D). These effects were also noticeable using the individual median values (Fig. 3E and G). Indeed, follicle area frequency distribution analysis revealed that TPO-TSC2KO mice have fewer small follicles (<1000 μm2) but a higher number of follicles with areas between 3000 and 6000 μm2 (Fig. 3I). However, the epithelium-to-colloid ratio did not change (Fig. 3H). Besides increasing growth, mTORC1 enhanced thyrocyte proliferation assessed by Ki67 staining (Fig. 4). The number of proliferating thyrocytes (TTF1+Ki67+ cells/TTF1+ cells) was 10-fold higher in male and female TPO-TSC2KO mice compared with controls at 6 months of age (Fig. 4A and B). Because cyclin D3 is critical for thyrocyte proliferation, 21,53 –55 we assessed its protein content and found that cyclin D3, but not D2, is increased in both male and female TPO-TSC2KO mice (Fig. 4C and D).
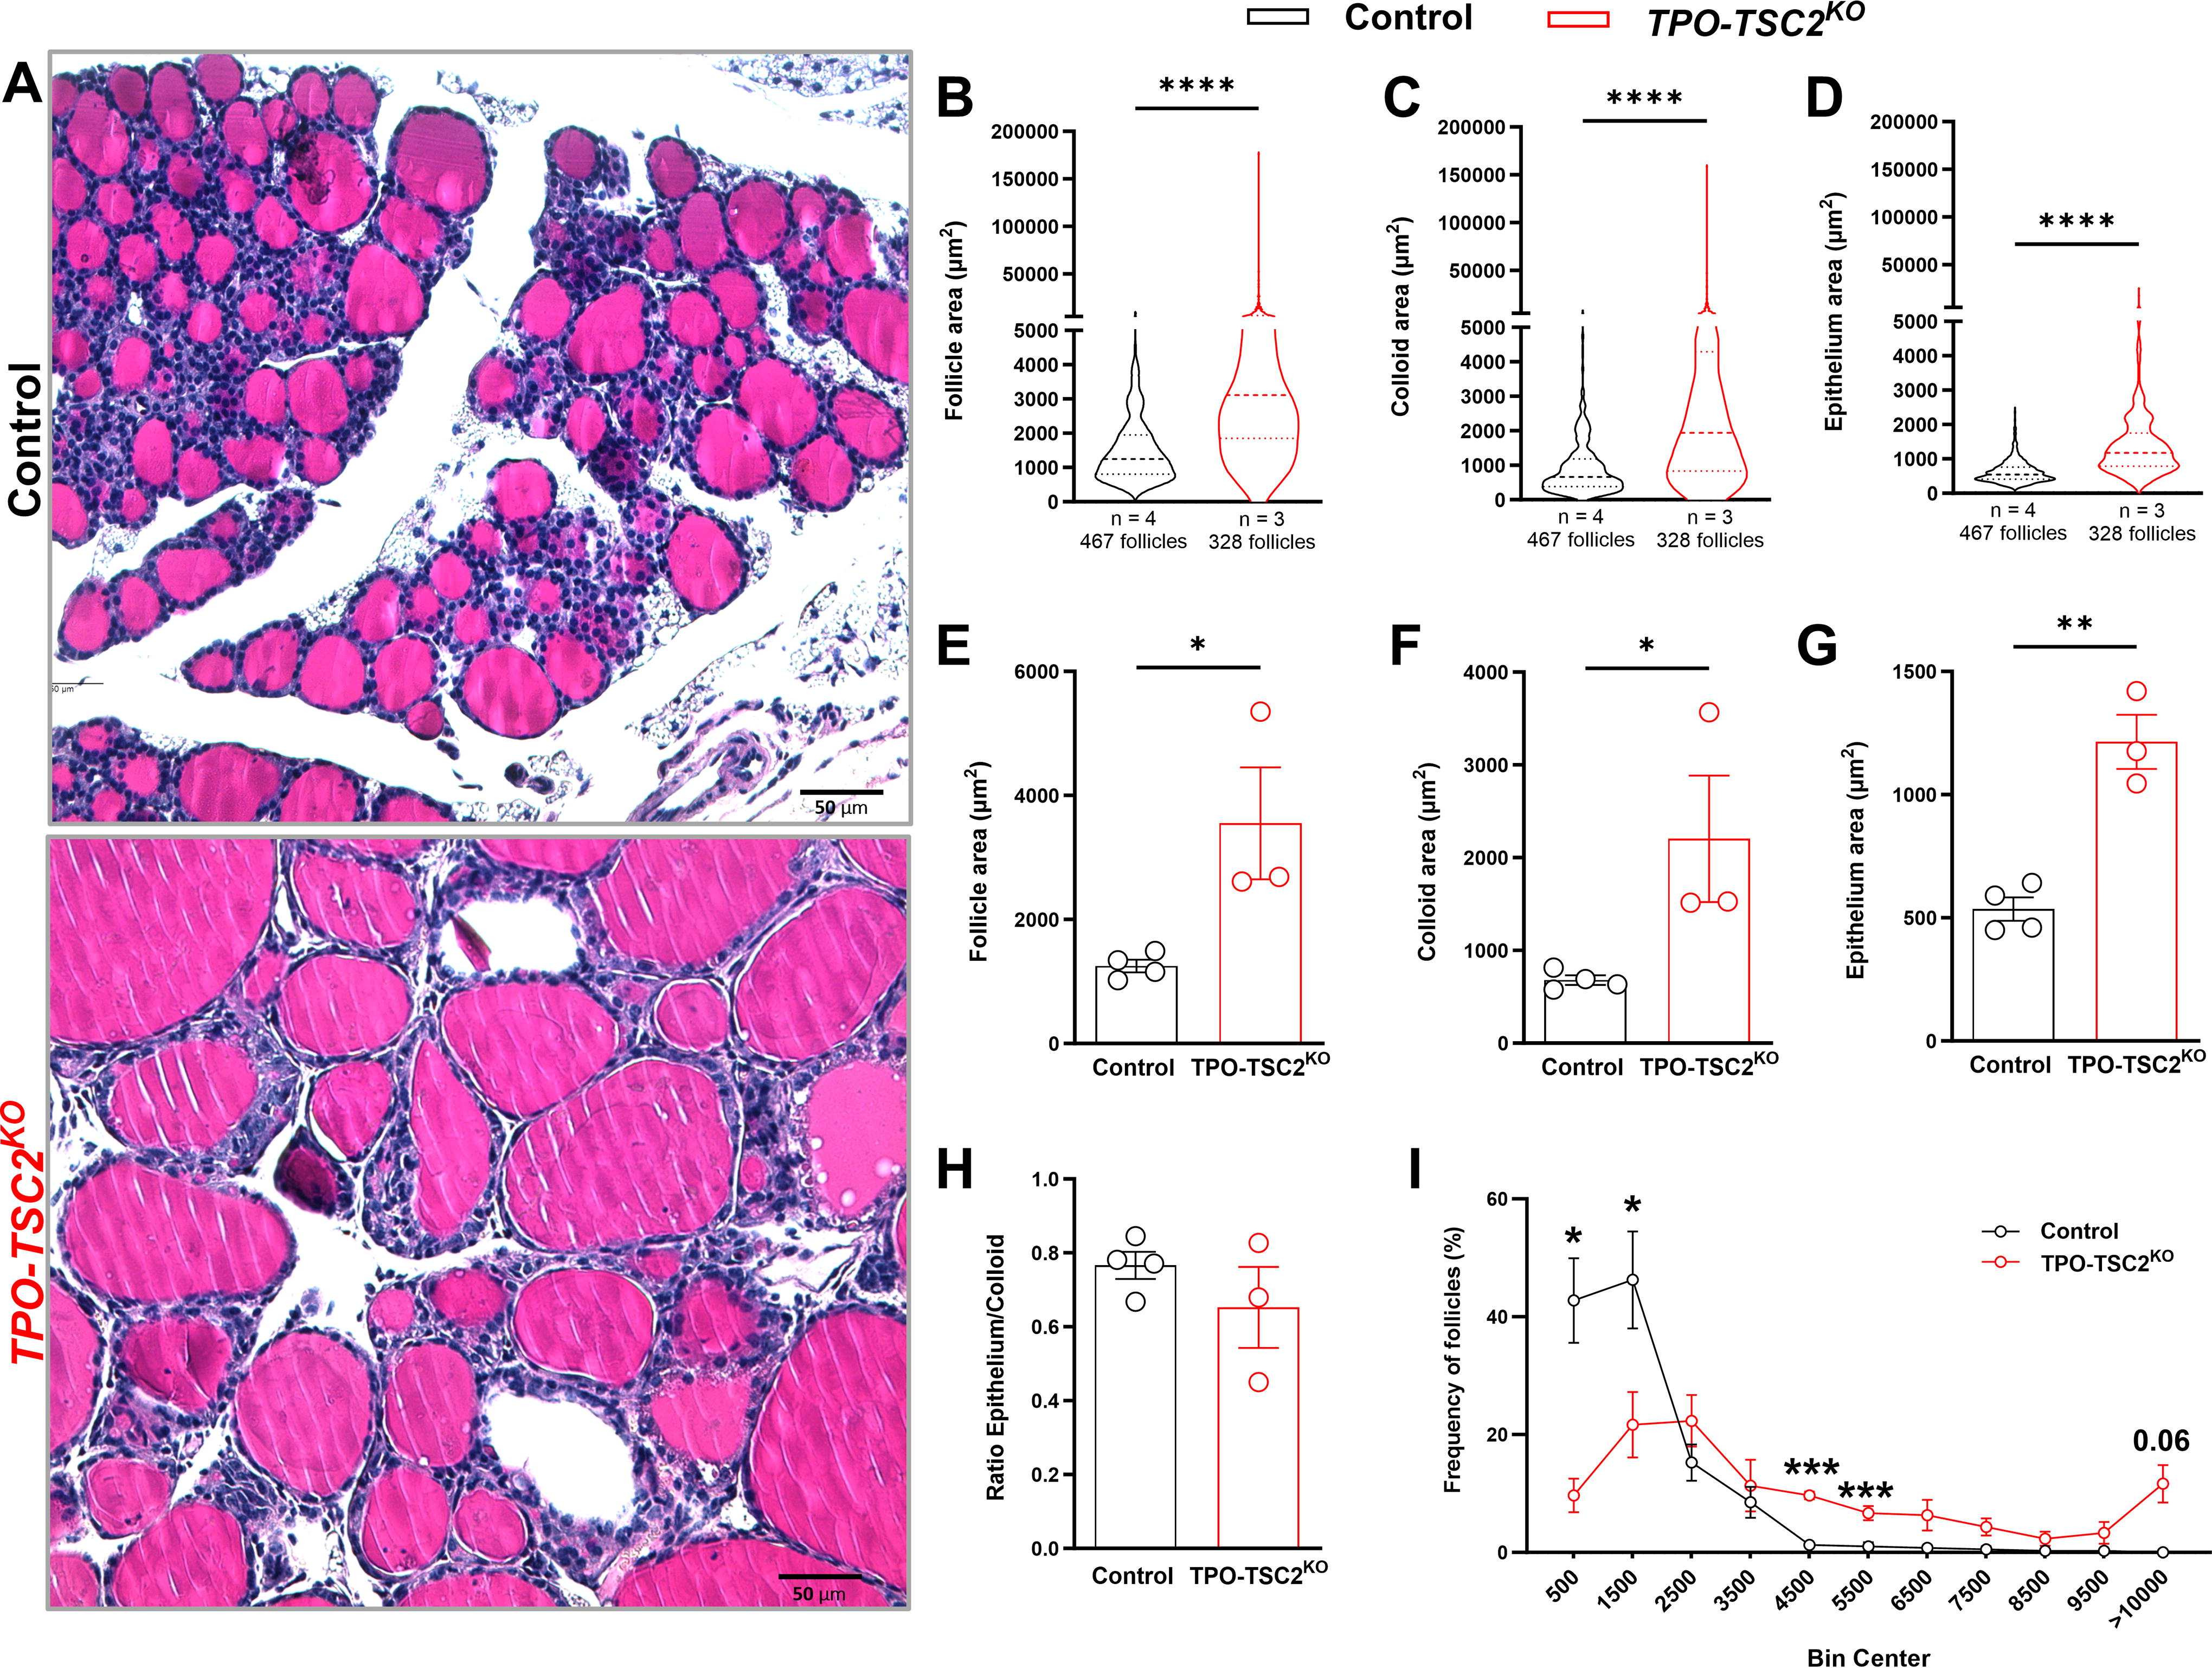
mTORC1 activation in thyrocytes leads to follicle enlargement.
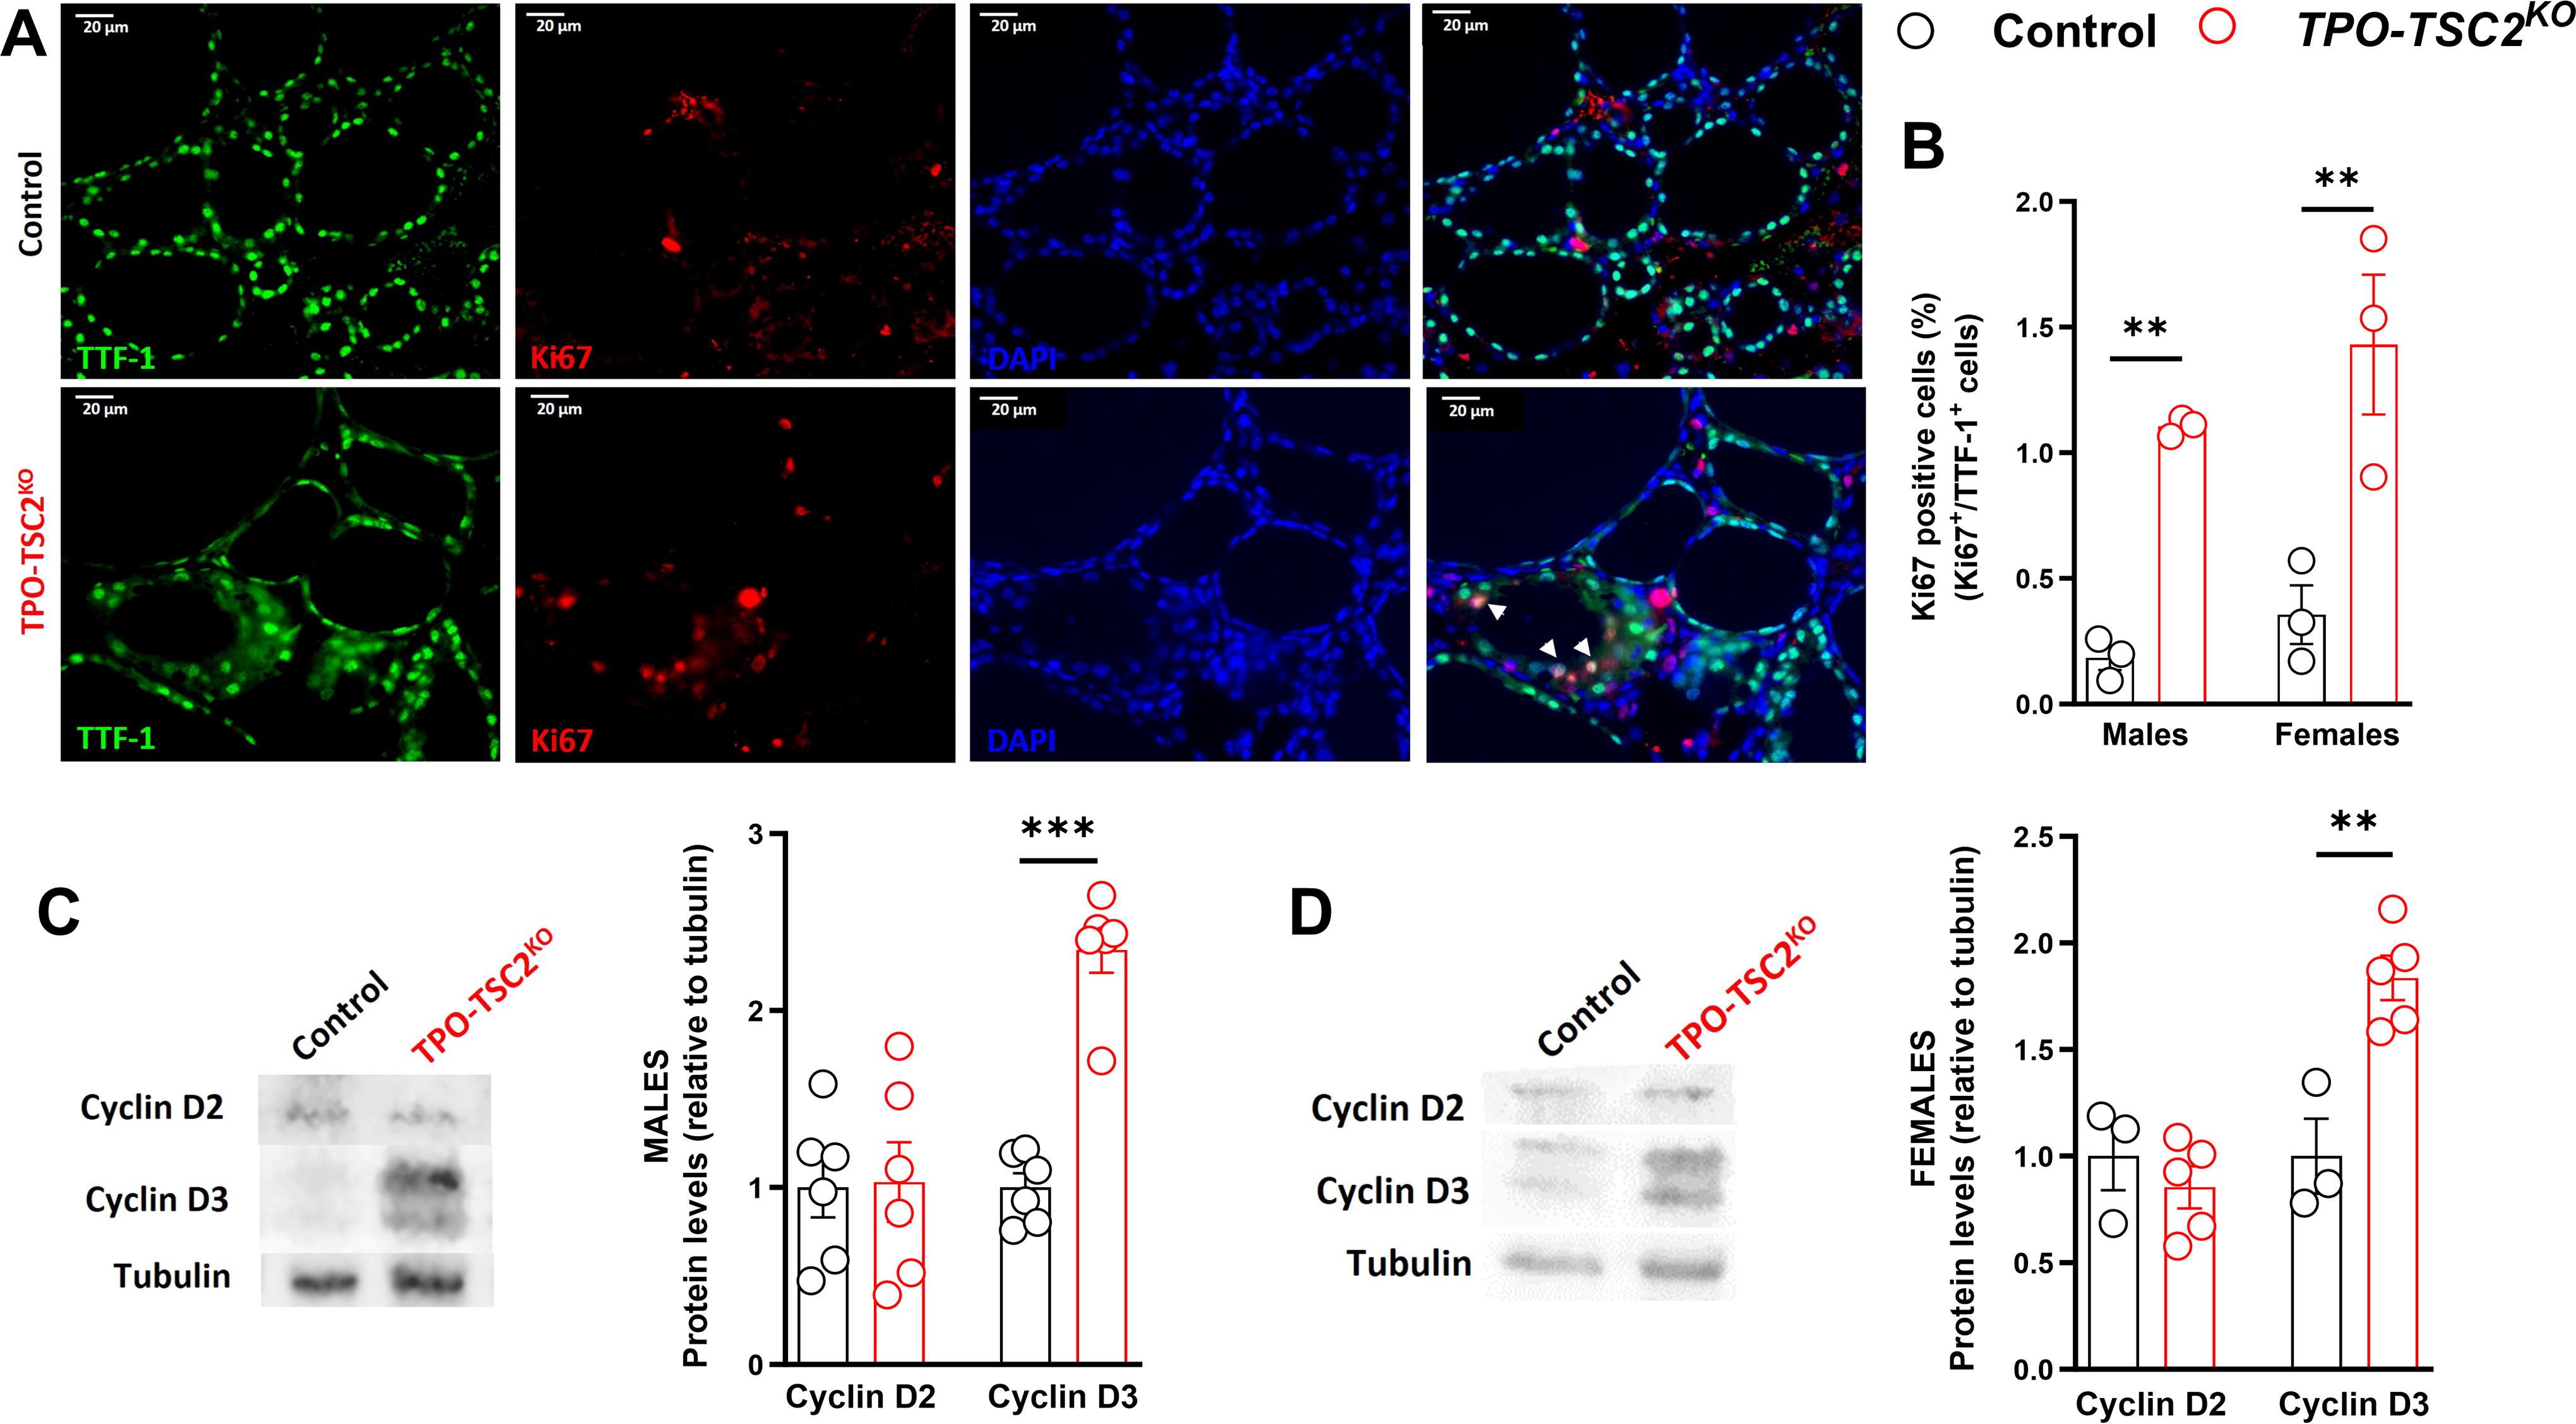
Intense thyrocyte proliferation in TPO-TSC2KO
mice.
mTORC1 regulates the expression of key regulatory genes in the thyroid gland
As expected, thyroid gland Tsc2 mRNA levels were 60–90% reduced in TPO-TSC2KO mice of all ages and sexes (Fig. 5). Notably, Nis and Tg mRNA levels are lower at 6 and 12 months of age in male and female TPO-TSC2KO mice (Fig. 5A–D). Activation of mTORC1 promoted a remarkable decrease in NIS protein levels in 6-month-old males and females (Fig. 5E and F). While in males Tpo expression tended to decrease at 6 months and was significantly decreased at 1 year, Tpo was less expressed in female TPO-TSC2KO mice at all ages (Fig. 5A–D). In contrast, Tshr expression was increased in TPO-TSC2KO males at 6 and 12 (p = 0.07) months of age (Fig. 5A and C). The T4-to-T3 activating deiodinase Dio1 expression was higher in TPO-TSC2KO female mice at 6 months of age (Fig. 5B). To evaluate if this modified gene expression profile was a function of mTORC1-mediated alteration of thyrocyte differentiation, we also measured the expression of the two main transcription factors that determine thyrocyte identity and maturation, Pax8 and Ttf1. 56 We did not observe any difference in the mRNA levels of these genes in male or female TPO-TSC2KO mice at any age (Fig. 5A–D). In addition, the expression of the thyroid hormone transporter Mct8 was similar between the groups (Fig. 5A–D).

mTORC1 suppresses the expression of essential genes involved in thyroid hormone synthesis. Thyroid mRNA levels of 6-month-old
Prolonged mTORC1 activation impairs thyroid function
Although mTORC1 activation altered the expression of key genes involved in TH synthesis early in life, total T4, T3, and TSH plasma levels were normal in 2-month-old male TPO-TSC2KO mice (Table 1). At 6 months of age, both male and female TPO-TSC2KO mice had higher TSH levels with a trend to lower levels of T4 (p < 0.07 and p < 0.06, respectively; Tables 1 and 2). TPO-TSC2KO mice aged one year exhibited higher TSH and reduced T4 levels in both sexes (Tables 1 and 2). In contrast, circulating T3 levels in TPO-TSC2KO mice were similar to controls throughout life. The expression of Dio1 in the liver and Dio2 in brown adipose tissue was similar in the TPO-TSC2KO and control mice (Supplementary Fig. S2), indicating normal T4-to-T3 conversion in peripheral tissues.
Plasma TSH, T4, and T3 in Control and TPO-TSC2KO Male Mice
Data are shown as mean ± SEM.
Sample sizes are given in parentheses.
*p < 0.05 vs. littermate controls at the same age determined by the unpaired two-tailed Student’s t-test.
Plasma TSH, T4, and T3 in Control and TPO-TSC2KO Female Mice
Data are shown as mean ± SEM.
Sample sizes are given in parentheses.
*p < 0.05 and ***p < 0.0001 vs. littermate controls at the same age determined by the unpaired two-tailed Student’s t-test.
Pharmacological inhibition of mTORC1 reverses the TPO-TSC2KO phenotype
To further demonstrate that the TPO-TSC2KO mice phenotype was due to enhanced mTORC1 activity in the thyrocytes, we pharmacologically inhibited mTORC1 with daily injections of rapamycin (Fig. 6). Both control and TPO-TSC2KO mice received rapamycin (2 mg/kg ip) or vehicle for 5 weeks from 3 to 8 weeks of age (Fig. 6A). We hypothesized that rapamycin would limit the increases in thyroid mass and prevent the altered gene expression. The treatment successfully blocked mTORC1 activity in both female and male TPO-TSC2KO mice (Fig. 6B and E). Body weight was similar between male and female control and TPO-TSC2KO mice (not shown). Rapamycin abrogated the differences in thyroid weight in male (Fig. 6C) and female (Fig. 6F) TPO-TSC2KO mice. Rapamycin administration also reversed the changes in the expression of Nis, Tg, Dio1, and Tshr in male TPO-TC2KO mice (Fig. 6D). In female TPO-TC2KO mice, rapamycin normalized the expression of Nis and Tpo (Fig. 6G). We measured total T3, T4, and TSH levels in male mice and did not observe any difference between control and TPO-TSC2KO mice after rapamycin treatment (not shown).
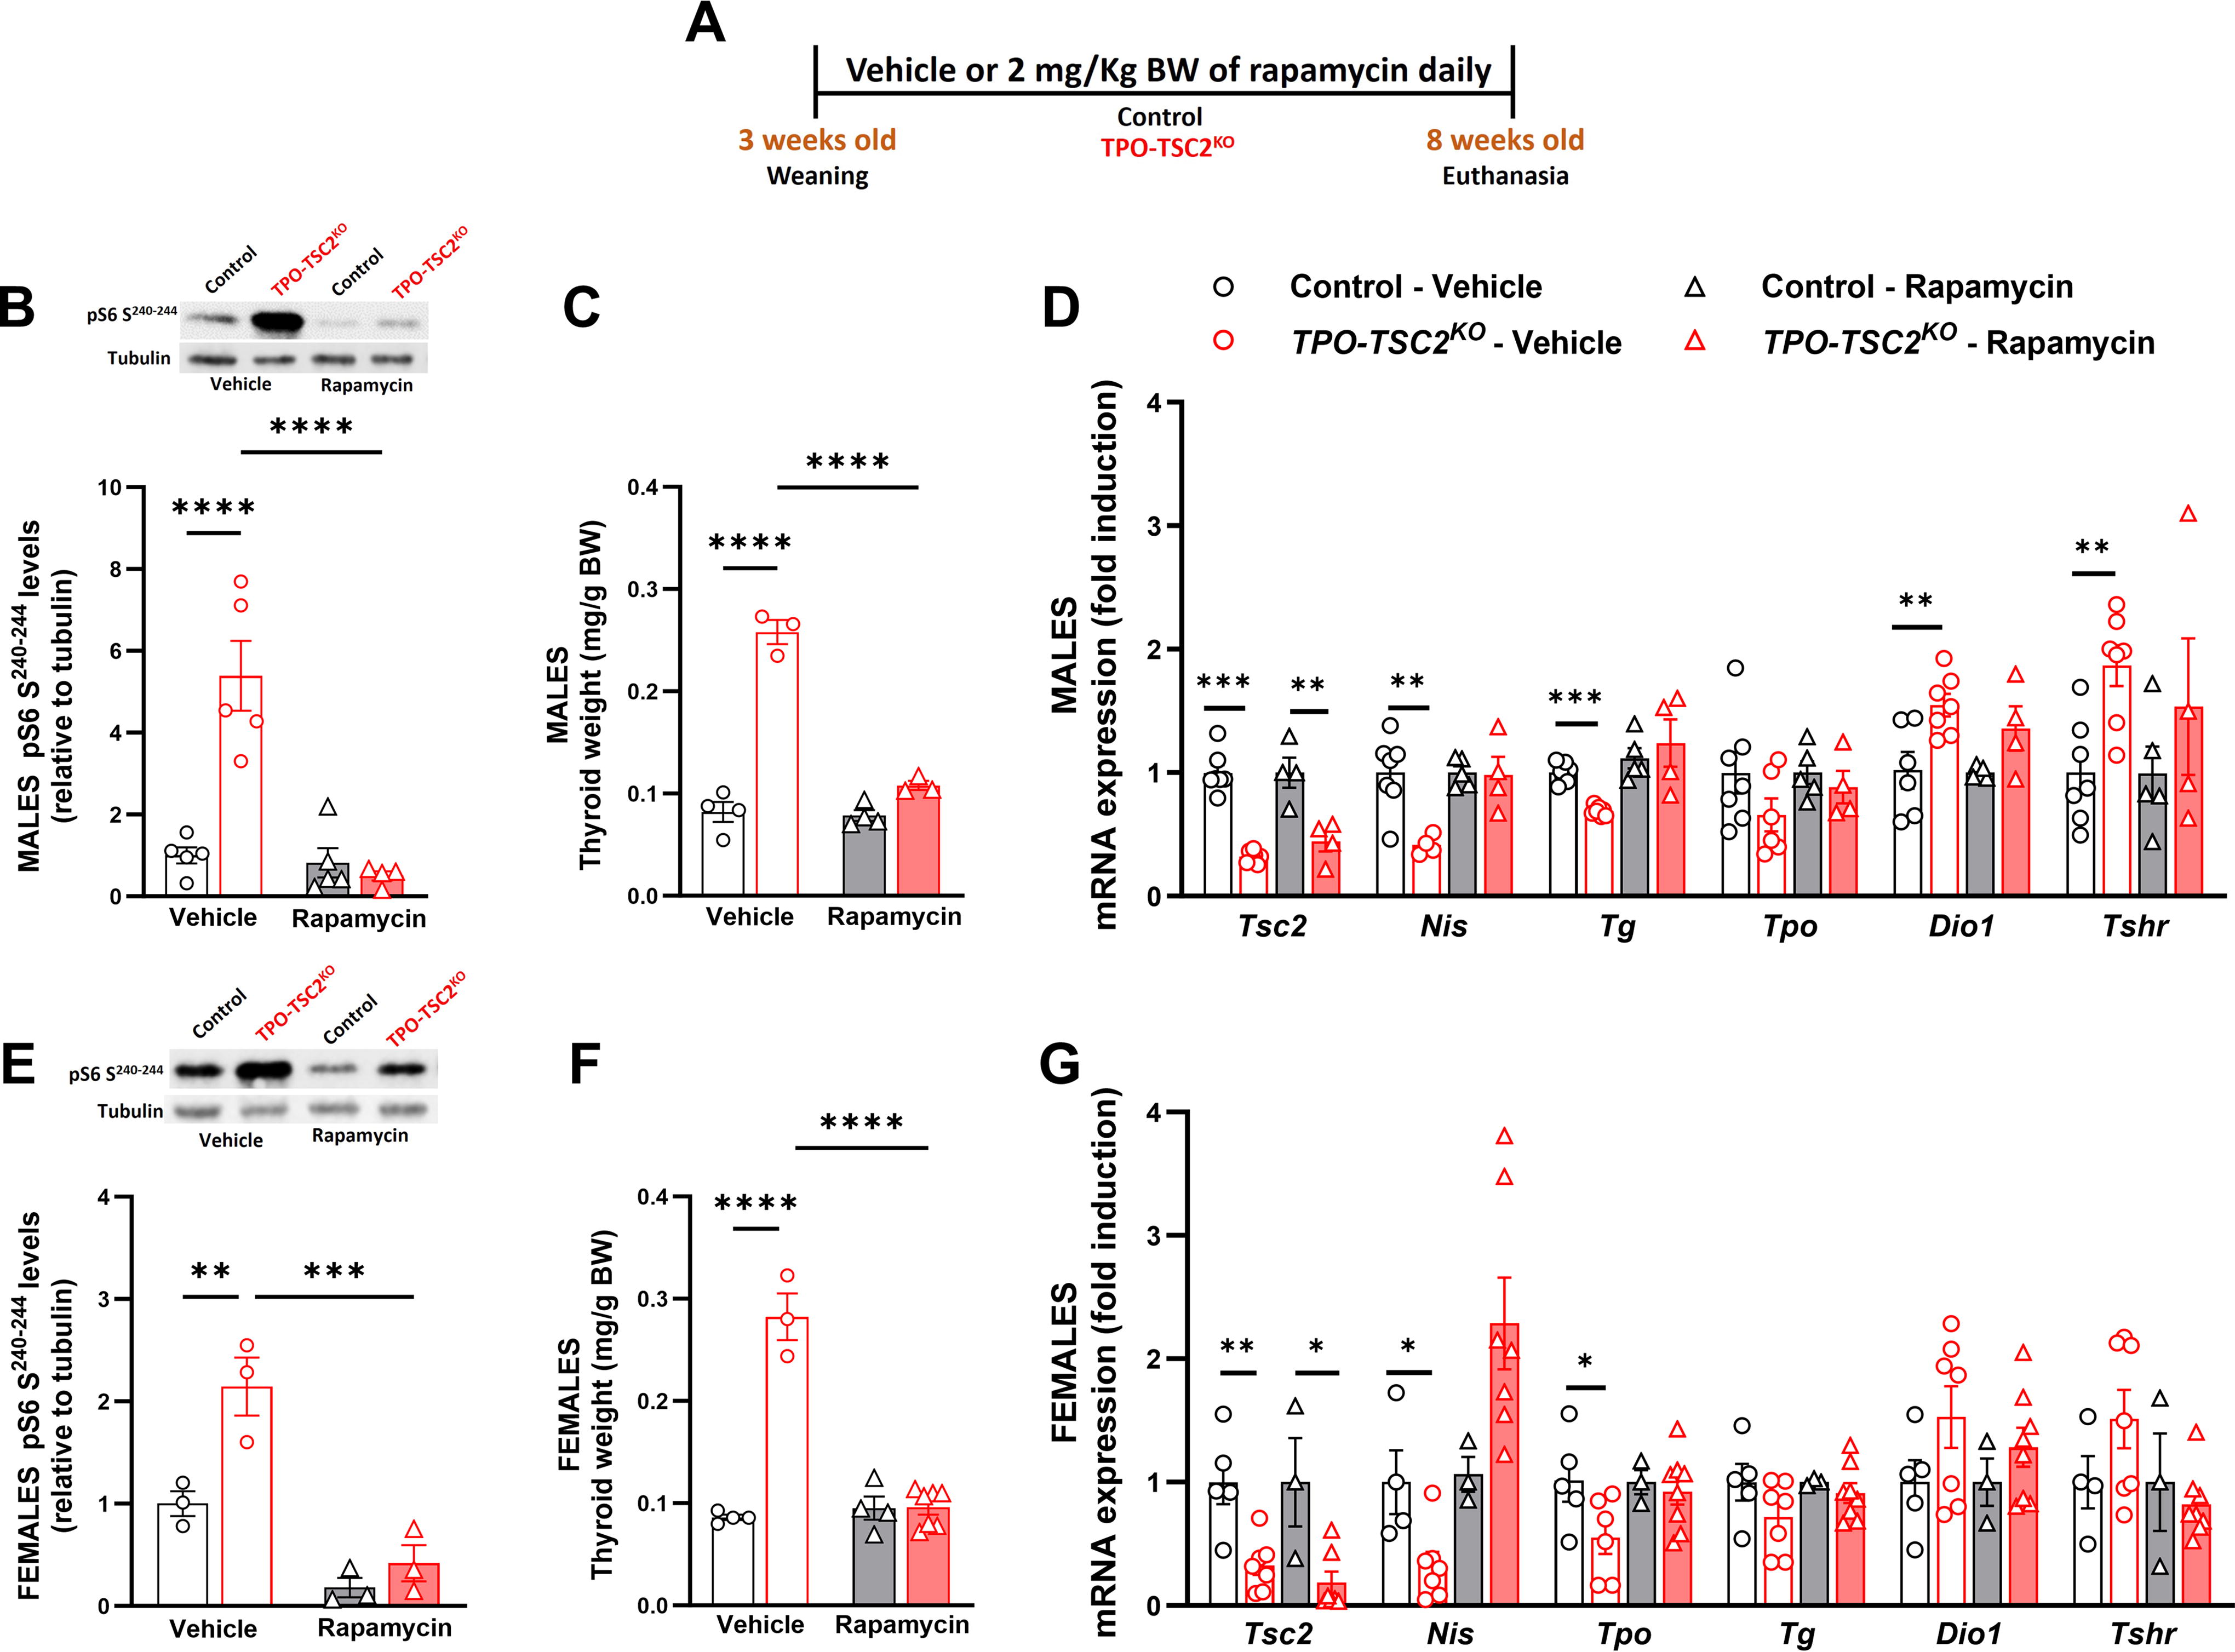
Rapamycin treatment blunts thyroid mass expansion and restores gene expression in the TPO-TSC2KO
.
Discussion
We demonstrate herein that activation of mTORC1 specifically in thyrocytes leads to a striking increase in thyroid gland weight, characterized by larger follicles filled with more colloid and greater epithelium area. In addition, mTORC1 drives intense thyrocyte proliferation. We also document that mTORC1 dramatically suppresses the expression of important genes for hormonogenesis such as Nis, Tpo, and Tg, impacting TH levels. Rapamycin treatment of TPO-TSC2KO mice blunted mTORC1-induced increase in thyroid growth and restored gene expression. This is the first in vivo study investigating the direct role of mTORC1 signaling activation specifically in thyrocytes.
The lack of in vivo models for investigating mTORC1’s role in thyrocyte physiology led to the generation of TPO-TSC2KO mice. It is well-established that mTORC1, a sensor of nutrients and growth factors, plays a crucial role in promoting cell growth and proliferation. 27,57 Therefore, it is not surprising that TPO-TSC2KO mice exhibit thyrocyte growth and proliferation. However, our data contrast with previous findings that chronic in vivo treatment of mice with the rapalog RAD001 (everolimus) during goitrogenic conditions abolished the hyperplastic thyrocyte response but not the iodine deficiency (ID)-induced thyroid growth. 20 The proposed uncoupling of mTORC1 action on proliferation and growth, as suggested by the authors, is not supported by our TPO-TSC2KO mouse model. The magnitude of mTORC1 activation in our model cannot explain the differences since ID elicits similar mTORC1 activation observed in the TPO-TSC2KO. 20 –23 Importantly, and in contrast to experimental goitrogenic conditions, the mechanism in the TPO-TSC2KO operates independently of TSH, since TSH levels remain normal in young mice (less than 6 months of age).
In vivo data demonstrating the impact of the PI3K-Akt-mTOR pathway on TH synthesis and secretion are at present limited and subject to controversy. 19,39 –42 This controversy can be attributed to the constraints of in vitro conditions, which fail to replicate the organized thyrocyte structures as follicles and consequently do not fully represent thyroid gland physiology. 44,58 Previous research primarily focused on understanding the regulation of NIS expression and activity by mTORC1 and/or mTORC2, particularly in the context of more aggressive thyroid cancers. 43,59,60 In contrast to the observed synergism and cooperation between TSH and INS/IGF1 in thyrocyte proliferation and growth, initial studies using FRTL-5 and PCCL3 cell lines suggested opposing actions of these hormones in the regulation of NIS. 19,41,42 However, recent investigations using primary human thyrocytes have demonstrated the additive effects of TSH and IGF1 on the mRNA expression of Tg, Tpo, Dio2, and Nis. 39,40 Our present data on the TPO-TSC2KO mice indicate that mTORC1 downregulates Nis gene and protein expression. This finding corroborates the observations that high doses of everolimus (four oral doses of 5 mg/kg body weight in 24 hours) increased thyroid iodide uptake by 50% in Wistar rats. 41 However, it is important to note that such high doses may also lead to the blocking of mTORC2 activity.
In the thyroids of TPO-TSC2KO mice, the downregulation of other genes positively regulated by TSH, such as Tpo and Tg, was evident. This mTORC1-mediated effect was observed at both normal and slightly elevated TSH levels in the blood. TSH is known to activate signal transduction pathways that intricately regulate the transcription and activity of thyroid transcription factors (TTFs), including TTF1, TTF2, and PAX8. These factors collectively control the gene expression of various thyroid-specific functional proteins, including NIS, TG, TPO, DIO1, and DIO2. 61 –63 TTFs typically converge on the cis-regulatory elements of these target genes and regulate their expression in a feedforward manner. 62 Notably, in primary human thyrocytes, knockdown of Ttf1, Ttf2, and Pax8 genes has been shown to inhibit TSH-stimulated Nis, Tg, Tpo, and Dio2 mRNA expression. 64 However, we did not observe a decrease in the expression of Ttf1 or Pax8, suggesting that the mTORC1 effect is not TTF-mediated. In addition, TTF1 protein staining in the thyrocyte nuclei of TPO-TSC2KO mice was normal (Fig. 4). In our model, mTORC1 activation is expected to begin when TPO is expressed during embryonic development (E14.5), after TTF1 and PAX8 expression. 47 The lack of alteration in the Pax8 and Ttf1 expression also suggests that mTORC1 is likely to directly modulate the expression of Nis, Tpo, and Tg rather than inducing dedifferentiation of thyrocytes. Intriguingly, Tshr and Dio1 were upregulated, even in the presence of normal TSH levels, possibly as a compensatory mechanism to counteract the impaired synthesis of thyroid hormones. Increases in TSHr expression also corroborate the lack of defects in TTF1 signaling since TTF1-haplodeficient mice exhibit reduced TSHr expression. 65
It is noteworthy that T4 and T3 plasma levels are normal in the TPO-TSC2KO mice at two months of age despite the downregulation of Nis, Tpo, and Tg expression. Only when animals are six months or older, T4 slightly decreases and TSH increases in male and female mice. We speculate that the striking increase in thyrocyte proliferation and mass (thyroid epithelium layer) compensates for the decrease in TH synthesis. Indeed, TH plasma concentration per gram of thyroid (T4 levels/thyroid weight ratio) is dramatically decreased in the TPO-TSC2KO mice compared with littermate controls.
Footnotes
Acknowledgments
The authors are thankful to Maykel Manso for the critical support with mouse colony handling and genotyping. The authors also recognize Dr. Roy Weiss from the University of Miami for discussing the results of the present article. The TPO-cre mouse was kindly donated by Dr. Shioko Kimura.
47
A preprint version of the article is posted in BioRxiv (doi: ![]() ).
).
Authors’ Contributions
C.L.R., E.B.-M., A.T.F., J.L., E.M.C., and J.P.W.d.C. conceived and designed the research. C.L.R., B.L.A., F.L.M.P., and J.P.W.d.C. performed the experiments. C.L.R., B.L.A., F.L.M.P., V.N., J.L., E.M.C., A.T.F., E.B.-M., and J.P.W.d.C. analyzed and discussed the data. C.L.R., B.L.A., and F.L.M.P. prepared the figures. C.L.R. and J.P.W.d.C prepared the article. All authors revised and approved the final version of the article.
Author Disclosure Statement
The authors declare that they have no known competing financial interests or personal relationships that could have appeared to influence the work reported in this article.
Funding Information
The authors acknowledge funding resources for this article:
Supplementary Material
Supplementary Table S1
Supplementary Table S2
Supplementary Figure S1
Supplementary Figure S2