
Abstract
Background:
During active surveillance (AS) of low-risk papillary thyroid carcinomas (PTCs), the majority remain stable, while some exhibit either an increase or a decrease in tumor diameter or tumor volume (TV). We aimed to evaluate the clinical outcomes and relevant parameters influencing tumor growth kinetics of low-risk PTCs.
Methods:
This retrospective cohort study evaluated clinical parameters of 402 patients with low-risk PTC sized <2 cm, with a follow-up duration over 3 years. Changes in maximum tumor diameter, TV, and initial TV doubling time (i-TVDT) calculated within 3 years were assessed. A significant change in TV was defined as a change of 75% or more.
Results:
Of the 402 patients with low-risk PTC, 93.3% (375/402) were diagnosed with papillary thyroid microcarcinoma. During a median follow-up of 5 years, 3.4% (14/402) of patients developed new cervical lymph node (LN) metastasis, and 8.2% (33/402) experienced a maximal diameter increase of ≥3 mm. The i-TVDT of <5 years emerged as an independent risk factor for both maximal diameter growth and new LN metastasis (p < 0.001 and p = 0.04, respectively). Based on TV changes and i-TVDT during AS, we identified four statistically significant tumor kinetic patterns (p < 0.001): Stable (±75% change in TV), Rapid growth (TV increase >75% and i-TVDT <5 years), Slow growth (TV increase >75% and i-TVDT ≥5 years), and Shrinkage (TV decrease >75%). Most of the PTCs remained stable (67.7%), but 17.2% were rapidly growing, with a median onset of growth of 2.0 years. Slowly growing PTCs, comprising 10.9%, grew at a median of 4.3 years. A minority, 4.2%, exhibited shrinkage. In total, 115 (28.6%) patients underwent delayed surgery >12 months after initiating AS. The reasons for delayed surgery included patient preference (51/115, 44.3%), disease progression (31/115, 27.0%), and suspected disease progression, which was referred to as tumor growth not meeting the criteria of an increase of ≥3 mm in maximal tumor diameter (17/115, 14.8%).
Conclusion:
An i-TVDT of <5 years serves as an important prognostic indicator for disease progression, including tumor growth and new LN metastasis. The four tumor kinetic patterns based on TV changes and i-TVDT assist in guiding personalized decisions early in AS.
Introduction
Active surveillance (AS) is a safe alternative to immediate surgery in patients with low-risk papillary thyroid microcarcinoma (PTMC), 1 –5 and indications for AS have been broadened to include low-risk papillary thyroid carcinoma (PTC) >1 cm. 6,7 While most low-risk PTCs maintain stability, some show disease progression. Hence, identifying patients with PTC at risk of progression early in AS is crucial. However, a definitive consensus for significant clinical PTC progression during AS remains unclear. Various studies have proposed different criteria for tumor enlargement, with some suggesting a cutoff of 50%–100% increase in tumor volume (TV), or an increase in maximal diameter of 3 mm or 2 × 2 mm. 2,6 –11 However, tumor enlargement is not always indicative of disease progression 7,12 ; some PTCs may even shrink after enlarging. 13 Therefore, the TV doubling time (TVDT) has been shown to be an effective indicator of the growth velocity in PTC. 11,14,15 Assessing tumor kinetics may provide more reliability than one-time measurements, playing a pivotal role in understanding the natural progression of PTC.
Several studies on tumor kinetics have assessed TV changes, growth rate, and doubling time to provide a more dynamic characterization of PTC growth. 7,9,13,15 –17 TVDT serves as a reliable measure of solid tumor growth over time in other cancers. 16,18 –20 Our previous study suggested that TV changes were more sensitive for detecting tumor growth compared with maximal diameter measurement. 8,12 By incorporating time-dependent dynamics in analysis, a TVDT of <5 years was found to be a crucial predictor of the development of new lymph node (LN) metastasis and tumor enlargement. 11,14 Moreover, distinct growth patterns, as determined by TVDT, have been instrumental in categorizing PTCs as either rapidly growing or stable. 14 Currently, there is limited research on kinetic analyses of PTC during AS.
The primary outcome of this study was disease progression during AS, with delayed surgery serving as the secondary outcome. This study analyzed the extended data for low-risk PTC, focusing on the kinetics of tumor growth during AS. 11,12 Our study aimed to determine relevant parameters of rapidly growing PTCs and to understand the natural course of low-risk PTC. Furthermore, we devised a tailored framework for categorizing PTCs based on these kinetics to aid in the dynamic risk assessment of low-risk PTC.
Materials and Methods
Study design and patients
This retrospective study evaluated longitudinal data from previous AS cohort studies using data collected solely from the Asan Medical Center, Korea. 11,12 Furthermore, the inclusion of new patients broadened the retrospective cohort. This expansion resulted in a total of 452 individuals with cytopathologically diagnosed PTC at Asan Medical Center from 2002 to 2020. We focused on patients with low-risk PTC sized <2 cm, all of whom were followed for over 3 years. These patients did not undergo immediate surgery; some were ineligible for surgery due to other incurable malignancies or were at high risk for general anesthesia due to cardiopulmonary disease. We excluded 10 patients with suspected extrathyroidal extension (ETE) on their first ultrasonography (US), and 10 with initial cervical LN metastasis. The excluded patients, although not meeting the criteria for low-risk PTC, underwent AS due to severe comorbidities. From the remaining 432 patients, 15 with a short follow-up duration (<3 years), 4 who died from other causes, and 11 lost to follow-up were excluded. Ultimately, 402 low-risk PTC patients were analyzed in this study (Fig. 1). All patients made informed decisions about undergoing AS or immediate surgery regardless of the presence of cancer or comorbidities. The follow-up protocol for AS was carried out as previously described, 8,12 with patients undergoing neck US every 6–12 months. The study protocol was approved by the Institutional Review Board of Asan Medical Center, Republic of Korea (2018-0354). The need for informed consent was waived due to the retrospective nature of the study.

Flow diagram showing the selection protocol of patients with low-risk PTC during AS. PTC, papillary thyroid carcinoma; AS, active surveillance.
Neck US examination and evaluation of TV, TVDT
Neck US examinations were performed by experienced radiologists or endocrinologists. To minimize potential bias in measurement, operators deliberated on standardizing the measurement method to obtain objective measurements. 21,22 All neck US images were retrospectively reviewed by a radiologist (S.R.C) and two endocrinologists (C.A.K and W.G.K). The findings were then collaboratively reviewed by the three authors to achieve consensus on the interpretations of various assessments. We assessed US features, including maximal tumor diameter, TV, tumor location, composition, echogenicity of the solid portion, margin, shape, and echogenic foci (calcifications) according to previous reports. 1,11,14,21,23,24 We measured the TV in both transverse and longitudinal planes. The TV was calculated using the following equation: TV (mm3) = length (mm) × width (mm) × thickness (mm) × π/6. 25 Changes in TV were calculated as follows: (final TV [mm3] — initial TV [mm3])/initial TV (mm3) × 100%. The TVDT was determined from all available TVs using the method developed at Kuma Hospital and described previously. 26 When a suspicious LN with a short diameter >3–5 mm was detected, fine needle aspiration (FNA) was performed with washout thyroglobulin. Suspected ETE observed on neck US refers to the direct extension of primary thyroid tumors into perithyroidal structures, including the strap muscles, trachea, and nerve.
Definitions and outcomes
The study assessed the natural course of low-risk PTC, defined as intrathyroidal tumors without evidence of local invasion or distant metastasis. 1 We particularly focused on tumors with a maximum size of 2 cm. To enhance reliability and minimize interobserver variations, an increase in TV was defined from two consecutive US examinations, with at least a 6-month interval between them. The time of the increase in TV was recorded at the first US examination, and two consecutive TV changes were utilized in the calculation of TVDT. A volume alteration in PTMC of up to 72% might result from interobserver variation in US examination. 21 Therefore, considering its clinical utility, we defined a significant change in TV as an increase or decrease of 75%. In addition, for early AS decision-making, we analyzed the initial TVDT (i-TVDT) using all available TV values within the first three years after initiating AS. Furthermore, for the PTCs exhibiting a meaningful TV increase (>75%), we applied the concept of doubling time to further differentiate “increasing” PTCs. Specifically, we identified Rapid growth (TV increase >75% and i-TVDT <5 years) and Slow growth (TV increase >75% and i-TVDT ≥5 years).
The primary outcome of this study was disease progression during AS. Disease progression was defined as a ≥3 mm increase in the maximal tumor diameter and/or the appearance of new cervical LN metastasis on US. Suspected disease progression was referred to as tumor growth that did not meet the disease progression criteria, specifically an increase of ≥3 mm in maximal tumor diameter. In addition, we conducted a comparative analysis between the 2 × 2-mm and 3-mm cutoffs. The secondary outcome was delayed surgery. We also evaluated parameters influencing tumor growth kinetics of low-risk PTCs. For patients with suspected disease progression, time-dependent changes in TV were explained, and physicians offered surgery as an option. If patients showed signs of disease progression or when their comorbidities improved enough to be able to tolerate surgery, the physician recommended delayed surgery.
Statistical analyses
All statistical analyses were conducted using SAS version 9.4 (SAS Institute, Cary, NC). Continuous variables were presented as median values and interquartile ranges (IQRs), compared using the Wilcoxon rank-sum test, unpaired t-test, or analysis of variance (ANOVA) as appropriate. For ANOVA, post hoc analysis was conducted using Bonferroni correction. Categorical variables were presented as numbers (percentages) and compared using Pearson’s χ 2 test or Fisher exact test as appropriate. We plotted the cumulative incidence of tumor growth using the Kaplan–Meier method with GraphPad Prism version 10.2 (GraphPad Software, San Diego, CA; http://www.graphpad.com). We used the log-rank test to determine the difference of the survival curves between groups. To assess the trends or slopes in TV change over time for each patient, we used linear mixed-effects models with a random intercept. This method involved estimating fixed effects to evaluate the differences in these slopes between groups, using interaction terms of slopes and groups within the model. Multivariable models were utilized to investigate variables associated with disease progression; all examined values, including age, sex, US features, tumor diameter at diagnosis with a 6-mm cutoff, and i-TVDT <5 years, were forced into the model without selection. Cox proportional hazard model was used to evaluate relevant risk factors and calculated hazard ratios (HRs) at confidence intervals (CIs). Statistical significance was set at p < 0.05.
Results
Baseline characteristics of patients under AS
The median age was 53.1 years (IQR, 42.9–62.6), and 18.4% (74/402) were ≤40 years. Overall, 75.1% (308/402) were female. The median follow-up period was 5.0 years (IQR, 3.1–7.7), including both ongoing AS [median of 6.0 years] and the period before delayed surgery [median of 2.6 years before surgery]. At diagnosis, the median maximal tumor diameter and TV were 5.9 mm (IQR, 4.6–7.5; range, 2.2–17.2) and 55.5 mm3 (IQR, 29.2–114.5), respectively. In total, 27 patients (6.7%) had tumors measuring >10 mm, whereas the remaining 375 patients (93.3%) were diagnosed with PTMC. The median frequency of neck US examinations was 7 times (IQR, 5–9). In total, 48 (11.7%) patients were on levothyroxine, with 22 (5.3%) taking it specifically for thyrotropin (TSH) suppression therapy, primarily in cases where surgery was not feasible despite tumors measuring >10 mm. Baseline TSH values were accessible for 84.3% (339/402) of patients, with a median value of 2.1uU/mL (IQR, 1.3–3.4). AS was chosen based on patient preference in 67.9% of cases (Table 1).
Baseline Characteristics of Patients with Papillary Thyroid Carcinoma Under Active Surveillance
Continuous variables are presented as median (interquartile range) and categorical variables are presented as numbers (percentages).
AS, active surveillance; TSH, thyrotropin, baseline TSH values were available for 339 patients.
Disease progression based on TV changes, initial TVDT
During AS, 44 (10.9%) patients exhibited disease progression. After a median AS period of 2.8 years, 33 (8.2%) patients showed a ≥3 mm increase in tumor diameter. In addition, after 3.2 years, 14 (3.4%) had new cervical LN metastases, which were confirmed with US-guided FNA during AS. Of these 14 patients, metastases were in the lateral neck for three patients, and in the central neck for the remaining individuals. Notably, three patients demonstrated both tumor growth and emergence of new LN metastases, concurrently. Suspected ETE observed on neck US was newly observed in 12.1% (4/33) of patients due to tumor growth more than 3 mm during AS. The cumulative incidence of cervical LN metastasis was 3.6% (CI, 2.1–6.4) at 5 years and 5.1% (CI, 2.5–9.1) at 10 years

Time-dependent cumulative incidence of disease progression during AS.
We assessed the appearance of new cervical LN metastasis by analyzing maximal diameter increase, TV growth, and i
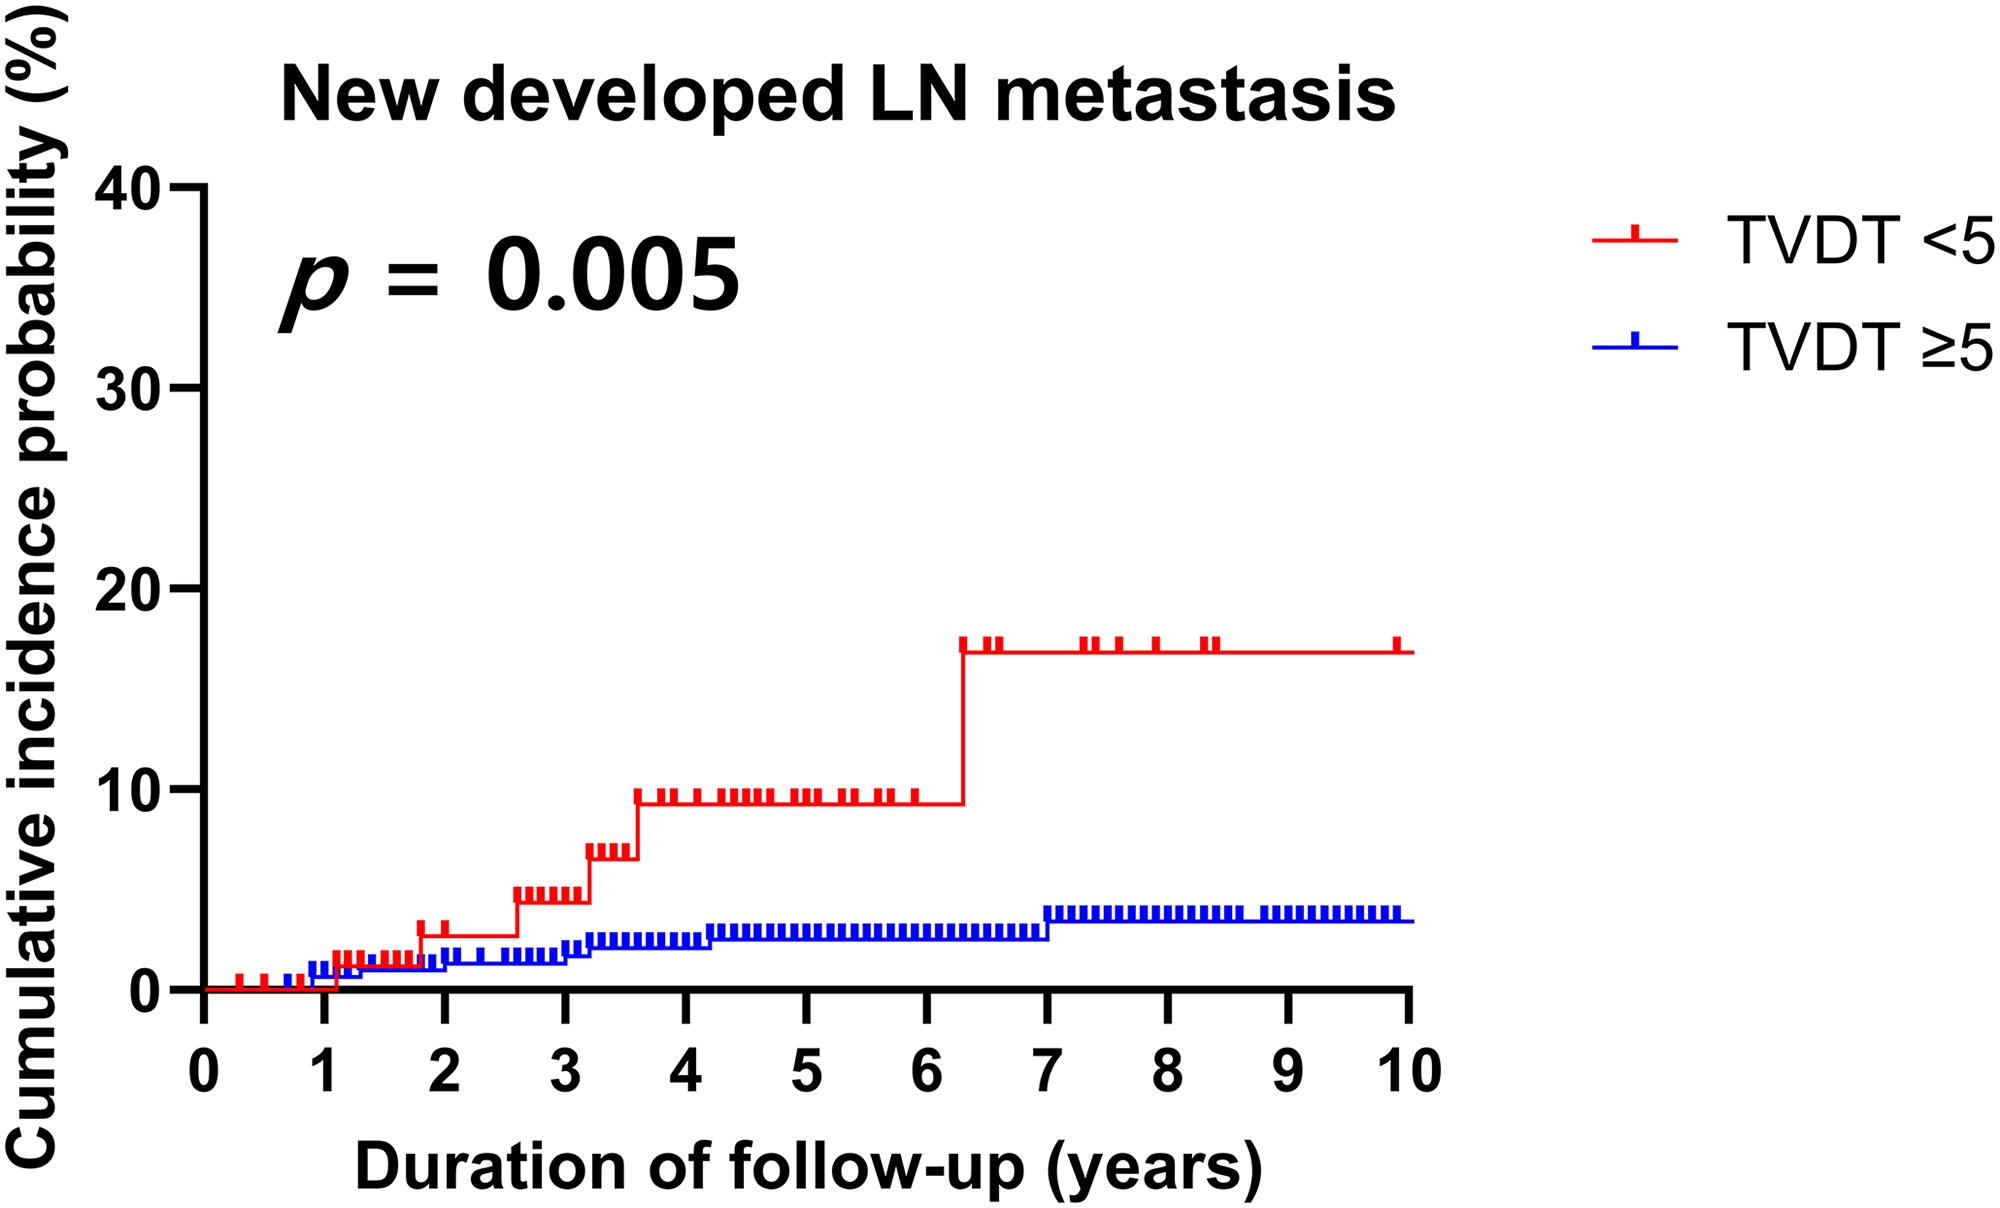
Time-dependent cumulative incidence of new LN metastasis in patients with low-risk PTC according to initial TVDT. LN, lymph node; PTC, papillary thyroid carcinoma; TVDT, tumor volume doubling time.
Clinical and sonographic characteristics with disease progression
The clinical and sonographic characteristics associated with disease progression were evaluated (Table 2). The following possible associated factors for disease progression during AS were evaluated as adjusting variables: age, sex, US features, tumor diameter at diagnosis with a 6-mm cutoff, and i-TVDT <5 years. Given that the median tumor diameter at diagnosis was 5.9 mm in our study, a cutoff of ≥6 mm was utilized. In the multivariable analysis, an i-TVDT of <5 years was an independent risk factor for the emergence of new cervical LN metastasis (HR = 3.17, CI 1.02–8.20; p = 0.044). In the univariate analysis, female sex and i-TVDT of <5 years were associated with tumor enlargement (maximal diameter increase ≥3 mm). However, in the multivariable analysis, only an i-TVDT of <5 years was significantly associated with tumor enlargement (HR = 37.28, CI 12.64–109.91; p < 0.001). In addition, in the multivariable analysis using the 2 × 2-mm cutoff, no additional relevant risk factors were identified aside from an i-TVDT <5 years (Supplementary Table S5). Hence, the sole independent prognostic factor associated with disease progression was i
Clinical and Sonographic Characteristics Associated with Disease Progression
Continuous variables are presented as median (interquartile range) and categorical variables as numbers (percentages).
CI, confidence interval; HR, hazard ratio; LN, lymph node; TVDT, tumor volume doubling time; US, ultrasonography.
Tumor growth kinetics of PTCs during AS
In this study, we compared the 3-mm and 2 × 2-mm-diameter increase cutoffs. Although the time to progression did not differ significantly from that of the 3-mm cutoff, the incidence of progression was more frequent with the 2 × 2-mm cutoff, as shown in Figure 2B (Supplementary Table S6). Furthermore, the 3-mm cutoff exhibited a significant association with newly developed LN metastasis (p = 0.04; Supplementary Fig. S3A), reinforcing its role as a more reliable and clinically relevant indicator of disease progression. Considering baseline tumor size, we found an increased incidence of tumor enlargement in PTCs for sizes >1 cm when using a 3-mm cutoff (p = 0.026; Supplementary Fig. S2A). In addition, we observed a significant association with new LN metastasis for tumor sizes >1.5 cm (p < 0.001; Supplementary Fig. S2C). However, with only 27 PTCs >1 cm, our study faces limitations in analyzing the correlation between baseline tumor size and disease progression.
PTCs were initially categorized into three groups based on a 3-mm diameter and a 75% TV change: increasing, stable, and decreasing. Stable was defined by a change of ±3 mm from baseline in maximal tumor diameter or a ±75% change in TV (Table 3
Tumor Kinetic Values of Papillary Thyroid Carcinoma During AS
Continuous variables are presented as median (interquartile range) and categorical variables as numbers (percentages).
AS, active surveillance; TVDT, tumor volume doubling time.
A refined classification using a 75% change in TV and an i-TVDT of 5 years identified four distinct tumor kinetic patterns, significantly differentiated by a linear mixing model (p < 0.001; Fig. 4): Stable (67.7%, ±75% change in TV); Rapid growth (17.2%, characterized by an early TV increase [time to increase, median 2.0 years]); Slow growth (10.9%, indicating a gradual enlargement [time to increase, median 4.3 years]); and Shrinkage (4.2%, TV decrease >75%). Both Rapid growth and Slow growth groups were significantly younger, with a mean age of 48.1 years than other groups with a mean age of 55.1 years (ANOVA, p < 0.01). Moreover, the Rapid growth group notably included a higher proportion of patients younger than 40 years (36.2%) and females (85.5%) (p < 0.01). Most Slow growth (86.4% [38/44]) and Shrinkage (94.1% [16/17]) groups continued with AS, exhibiting longer durations of 7.5 years and 6.6 years as median values, respectively. In contrast, 68.0% of the Rapid growth group proceeded to delayed surgery, while a relatively high 25% among the Stable group. New LN metastasis did not show a significant association with the four tumor kinetic patterns (p = 0.55; Table 4, and p = 0.45; Supplementary Fig. S4A). However, a significant difference was observed in tumor enlargement among the four patterns, particularly in the Rapid growth group, where the size increased rapidly (p < 0.001; Supplementary Fig. S4B).
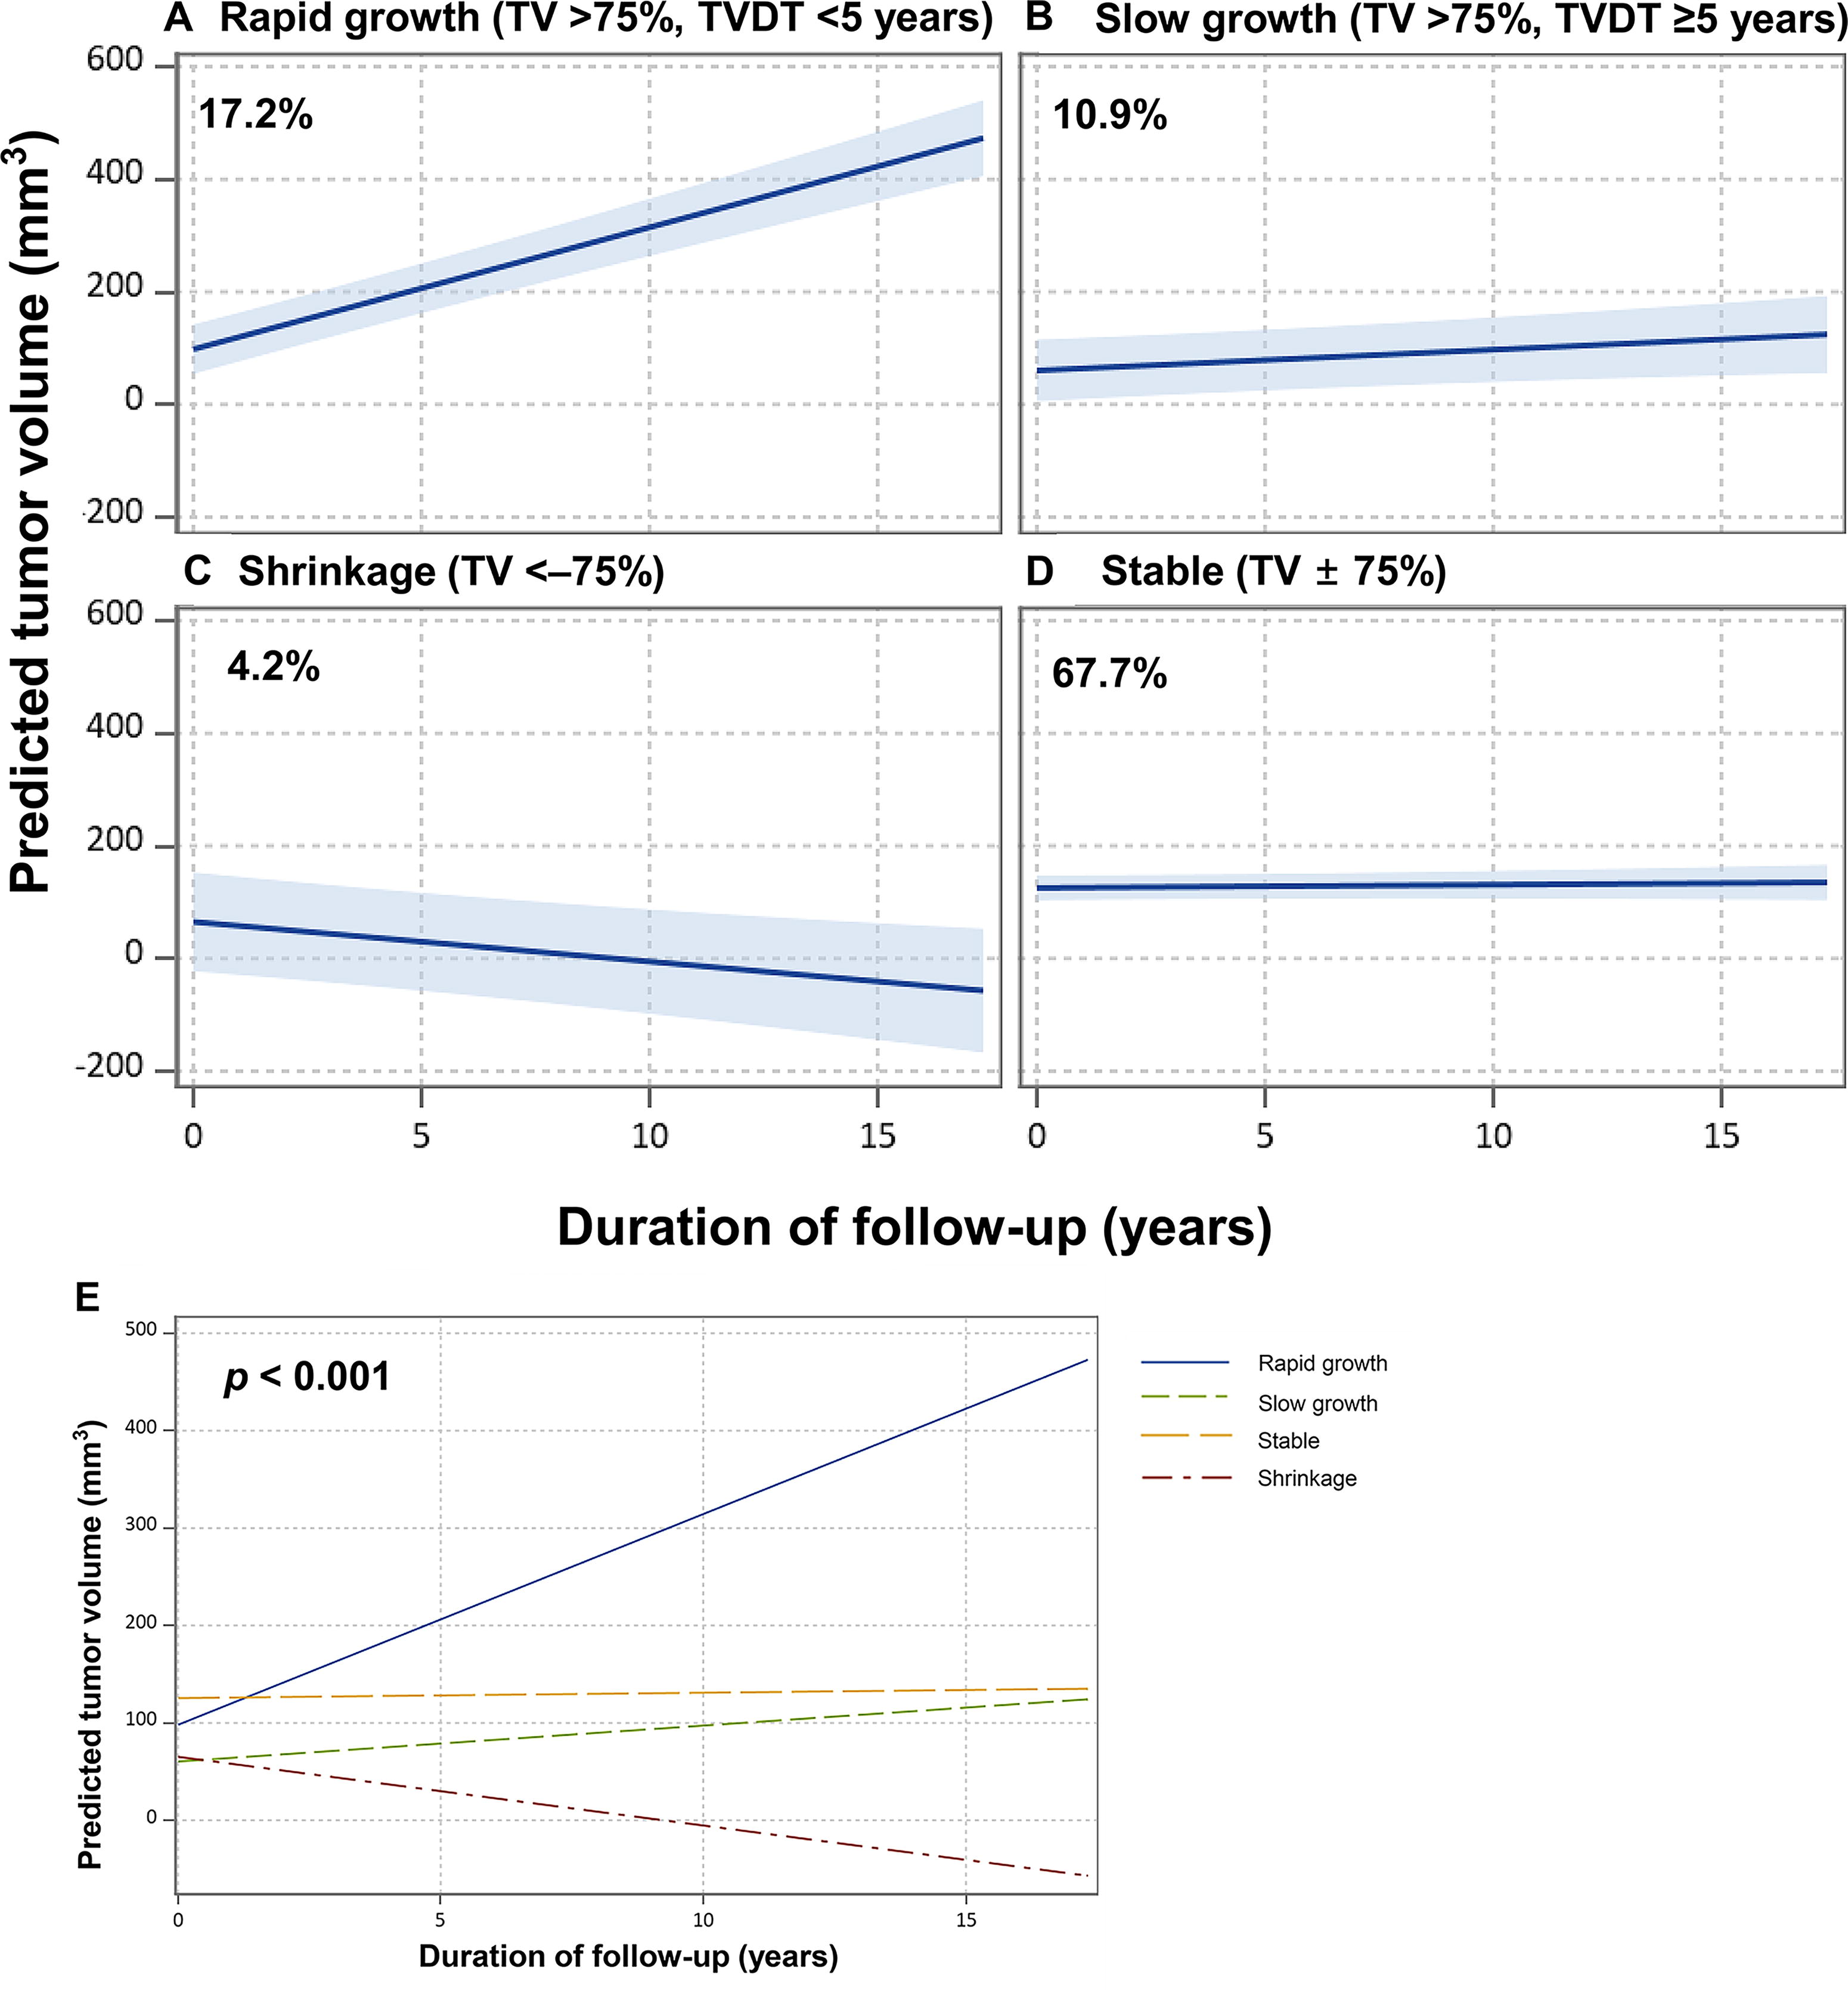
Four tumor kinetic patterns of PTC.
Four Tumor Kinetic Patterns Based on TV Changes and Initial TVDT
Continuous variables are presented as median (interquartile range) and categorical variables as numbers (percentages).
ANOVA, p < 0.01.
Chi-squared test, p < 0.01.
t-test, p < 0.01.
Chi-squared test, p = 0.55.
ANOVA, analysis of variance; AS, active surveillance; i-TVDT, initial TVDT; LN, lymph node; NA, not applicable; TV, tumor volume; TVDT, tumor volume doubling time.
Clinicopathological features of patients who underwent delayed surgery
During AS, 115 (28.6%) patients underwent delayed surgery >12 months after initiating AS due to patient preference (51/115, 44.3%) and disease progression (31/115, 27.0%), after a median follow-up period of 2.6 years (IQR, 1.8–4.3) before surgery. In addition, 17 (14.8%) patients underwent delayed surgery due to suspected disease progression. Of these 17 patients, the decision to delayed surgery for 11 patients (11/17, 64.7%) was influenced by the physician’s suggestion. Among the 30 patients who experienced tumor enlargement, 50% (15/30) of patients showed microscopic ETE after surgery. The clinicopathological features of patients who underwent delayed surgery were assessed (Table 5). One-third of patients (11/33) with confirmed tumor growth during AS did not undergo surgery: 3 refused surgery, 4 were ineligible due to systemic diseases, and the remaining 4 continued AS because the tumor had not rapidly grown since its initial expansion.
Clinicopathological Features of Patients Who Underwent Delayed Surgery
Continuous variables are presented as median (interquartile range) and categorical variables as numbers (percentages).
Data for surgical pathology were available for 111 patients.
CND, central node dissection; ETE, extrathyroidal extension; LN, lymph node; MRND, modified radical neck dissection; PTC, papillary thyroid carcinoma.
Of the 72 (64.9%) patients who underwent lobectomy, therapeutic central node dissection (CND) was performed in 6 patients due to LN metastasis confirmed preoperatively. In addition, 57 patients received prophylactic CND, with pathological LN metastasis incidentally identified in 15 patients. In contrast, 39 (35.1%) patients had total thyroidectomy, with 4 (3.6%) cases of therapeutic modified radical neck dissection. Of the remaining 35 patients who underwent CND, 2 underwent therapeutic CND, and 14 were incidentally found to have LN metastasis after surgery. Most of the patients (84.7%) had the classical type of PTC, and 11 patients (9.9%) had the tall cell variant type. BRAF mutations were identified in 26 of 31 patients (83.9%), while no TERT promoter alterations were detected in any of the 27 assessed (0/27). Pathological LN metastasis was found in 41 (36.9%) patients. Most of patients (87.8%) had small-volume LN metastasis (≤5 involved LNs), and 24 (58.5%) exhibited microscopic LN metastasis (metastatic deposits ≤2 mm). Extranodal extension (ENE) was observed in four (3.6%) patients. In addition, when analysis was conducted according to the reason for delayed surgery—patient preference, disease progression, and suspected disease progression—ENE was observed in two out of four in the patient preference group, in whom it had not been detected during AS. None of the clinicopathological factors showed significant difference between the three groups (Supplementary Table S7).
The median follow-up period after initial thyroid surgery was 3.9 years (IQR, 1.8–5.0). Two patients experienced recurrence after delayed surgery: one in the lateral neck LN after 4.4 years, successfully managed with additional surgery, and another in the contralateral lobe after 4.8 years, managed with ongoing AS. No patients showed distant metastasis or cancer-specific death.
Discussion
This retrospective cohort study, building on previous AS studies, 11,12 expanded to include a larger patient cohort and a broader range of tumor sizes (<2 cm), along with an extended research duration. In comparison with prior data, 27 patients (6.7%) had tumors measuring >10 mm, with the largest being 17.2 mm; these patients were safely monitored under AS. Over a median 5-year follow-up, new cervical LN metastasis was detected in 3.4% (14/402) of patients. Regarding tumor kinetic parameters, only an i-TVDT of <5 years was identified as a significant risk factor for disease progression. In addition, the 3-mm cutoff is a more clinically relevant indicator of disease progression than the 2 × 2-mm cutoff. Furthermore, using a 75% cutoff for TV changes and i-TVDT, we statistically validated and established four tumor kinetic patterns.
Contrary to previous studies, 10,15,27 age did not emerge as a risk factor for disease progression in our analysis. However, patients in the Rapid growth group were significantly younger compared with those in other groups. In addition, the median i-TVDT for this group was 2.5 years, indicating early detection of tumor growth during AS. Interestingly, 5.8% of patients in the Rapid growth group had new LN metastasis, marking the highest rate among all groups. LN metastasis in PTC is prevalent and often manifests early in disease progression. 28 Moreover, the baseline tumor diameter was observed to be significantly smaller (<5 mm) in the Rapid growth group. Therefore, it is crucial for younger patients (<40 years) to strictly adhere to early-stage monitoring, given their propensity for rapid volume enlargement. Furthermore, in cases of PTCs, even when small in size but exhibiting a rapid TV increase before a noticeable increase in diameter, vigilant and high-quality monitoring for LN metastasis is important.
Several AS studies have reported a reduction in tumor size in patients with PTC. 15,17,29 Although representing a minor fraction (4.2%), the Shrinkage group exhibited size reduction as early as a median of 2.7 years. Consistent with prior research findings, we observed that the reduction in tumor size commenced relatively early and proceeded in a gradual decline. 17 Notably, no LN metastasis was observed in the Shrinkage group during a median follow-up period of 6.6 years. In cases where tumors consistently exhibit a steady pattern of size reduction from the early stages, extending the intervals of AS beyond annual assessments could be considered, as suggested by our findings.
Based on our four kinetic patterns, we believe that an increase in TV of ≥75% should not be used as a sole indication for delayed surgery. In our study, 9.6% of patients underwent delayed surgery, as recommended by their physicians due to an increase in TV. However, the majority (86.4%) in the Slow growth group continued with prolonged AS, safely monitored for over 7 years. Therefore, even if the meaningful TV increases, for PTCs with an i-TVDT of ≥5 years (i.e., not exhibiting rapid growth), careful observation should be considered rather than immediate surgical intervention.
Tuttle et al. identified six kinetic volume patterns with implications for management during AS. 17 The cutoff for TV changes was determined to be 72%, based on our comprehensive analysis of interobserver variation. 21 However, our study diverged from the recent report from Tuttle et al., failing to confirm patterns of initial stability followed by an increase in TV—an outcome seen in Tuttle’s work with only one case reported. 17 In addition, while we found no evidence of an early TV increase followed by stability, Ito et al. 13 reported tumor shrinkage following significant tumor enlargement. This findings suggest a carrying capacity effect consistent with an evolutionary cancer model, 30 which aligns with Tuttle’s findings. However, the lack of clarity in definition of this pattern, along with the fact that most of our study’s rapidly growing group (68.0%) underwent delayed surgery, may complicate the verification of these patterns.
The secondary outcome (i.e., delayed surgery) was performed in 115 (28.6%) patients, a significant proportion. Notably, 10% of those who underwent delayed surgery had a tall cell variant, suggesting that AS may underestimate preoperative identification of aggressive variants. In this cohort, 41 patients (36.9%) exhibited pathological LN metastasis, of which 29 were incidentally identified as having predominantly small-volume microscopic LN metastasis. This finding supports the incidence of occult nodal metastasis in up to 50% of clinically N0 patients, often without altering staging or survival outcomes. 31
It is worth noting that 25% (68/272) of the Stable group underwent delayed surgery, primarily (40/68, 58.8%) due to anxiety—a prevalent factor despite being stable. Prior research underscores better physical outcomes in AS versus immediate surgery but reveals mixed results regarding psychological distress, such as cancer-related anxiety. 32 –34 Interestingly, 8.9% (6/68) underwent surgery without definitely meeting the criteria for disease progression, and the decision was possibly influenced by the physician’s preference or concerns about TV changes. The study by Sasaki et al. pointed out that favorable AS outcomes have led to a marked decrease in delayed surgery over time. 35 However, all 40 patients opting for surgery due to patient preference were diagnosed after 2011, indicating that there is still a noticeable gap in confidence and trust in AS among physicians and patients in Korea. Given that anxiety and fear may influence their treatment process, further studies and management addressing these psychological aspects are essential.
This study has several limitations. As a retrospective, single-center cohort study, it has a possibility of selection bias. In addition, there could be interobserver variations in maximal tumor diameter and volume measurements, but the multiple examinations for each patient likely minimized errors in TVDT calculations. The median follow-up period was approximately 5 years. Considering the indolent nature of PTC, a more extended observation period would be necessary. Also, the sample size in this study is relatively small, and the majority of patients had PTMC, thereby constraining the generalizability of our findings to larger tumors; therefore, large-scale, prospective, and multi-institutional validation studies are needed to verify the reproducibility of our results.
In conclusion, we demonstrated favorable outcomes of low-risk PTC on expanded data. An i-TVDT of <5 years significantly predicts disease progression, evidenced by both tumor enlargement and appearance of new LN metastasis. Based on tumor kinetic parameters such as TV changes and i-TVDT, we classified tumor growth into four distinct patterns. Incorporating clinical and sonographic characteristics, these four patterns provide insights into the natural evolution of low-risk PTC and offer a foundation for a dynamic risk assessment early in AS.
Footnotes
Acknowledgment
A part of this study was presented as an abstract at a meeting of the Korean Thyroid Association in 2023.
Author Contributions
C.A.K. contributed to data collection, data analysis, visualization, interpretation of the results, and wrote the article. S.H.B. contributed to interpretation of the data and performed statistical analysis. J.Y., K.-W.C., and W.B.K. provided critical input on the data analysis, reviewed the article, and contributed to the discussion. S.R.C. and J.H.B. contributed to data collection, data curation, and reviewed the article. M.J.J. and W.G.K. contributed to the conception and design of the study, data curation, interpretation of the data, and editing the article. All the authors had full access to the data, take responsibility for the accuracy of the data analysis, and approved the final version of the article.
Author Disclosure Statement
No competing financial interests exist.
Funding Information
This research was supported by a grant from Patient-Centered Clinical Research Coordinating Center (PACEN) funded by the Ministry of Health and Welfare, Republic of Korea (Grant Number: HC19C0215).
Supplementary Material
Supplementary Figure S1
Supplementary Figure S2
Supplementary Figure S3
Supplementary Figure S4
Supplementary Table S1
Supplementary Table S2
Supplementary Table S3
Supplementary Table S4
Supplementary Table S5
Supplementary Table S6
Supplementary Table S7