
Abstract
Background:
Medullary thyroid cancer (MTC) is a frequently metastatic tumor of the thyroid that develops from the malignant transformation of C-cells. These tumors most commonly have activating mutations within the RET or RAS proto-oncogenes. Germline mutations within RET result in C-cell hyperplasia, and cause the MTC pre-disposition disorder, multiple endocrine neoplasia, type 2A (MEN2A). Single-agent therapies for MTC, including vandetanib (VAN) and cabozantinib for all MTCs and selpercatinib (SEL) for RET-mutated MTC, lead to partial responses but are not curative.
Methods:
To identify new therapeutic targets for MTC, we conducted proteomic profiling of normal C-cells, MTC cells, pre-malignant MEN2A patient samples, and MTC tumors.
Results:
From this analysis, we identified CAPN1, a member of the CALPAIN (CAPN) family endopeptidases, as widely upregulated in MTC samples. We found that short hairpin RNA-mediated depletion of CAPN1 or inhibitors of CAPN1 significantly reduced MTC cell growth, colony formation, and xenograft tumor growth in vivo. In addition, we show that CAPN1 inhibitors synergize with VAN and SEL in vitro, maximizing apoptosis. Mechanistic experiments implicate CAPN1 in inhibiting neurofibromin, encoded by NF1, and CAPN1 inhibitors stabilize NF1 protein levels and diminish downstream RAS/RET activation of AKT and ERK.
Conclusions:
Our data suggest that increased CAPN1 levels support RET and RAS-fueled growth by reducing NF1 levels. We find that combinatorial therapies between CAPN1 inhibitors and VAN or SEL show maximal efficacy in MTC cells.
Background
Medullary thyroid cancer (MTC) represents only a small subset (5%) of all thyroid cancers; however, its late detection and metastatic nature make it difficult to treat and result in relatively poor patient survival. 1 MTC arises from the malignant transformation of parafollicular cells or C-cells within the thyroid. 2 C-cells are neuroendocrine cells that comprise 2–4% of all thyroid cells. Expression of calcitonin, which reduces serum calcium by inhibiting osteoclast-mediated bone resorption, is a hallmark of both C-cells and MTC. The majority (∼75%) of MTC cases occur sporadically and are driven by oncogenic activating events in the proto-oncogene, RET, or RAS. Around 25% of MTC tumors are found in patients with an inherited germline mutation in RET on chromosome 10q11.2 as part of the multiple endocrine neoplasia 2 (MEN2) syndromes. 3 Somatic activating mutations within RET are present in over 50% of somatic MTC tumors, the majority of these mutations are M918T. This mutation, when inherited in the germline, results in MEN2B syndrome.
RET is a member of the membrane receptor tyrosine kinase superfamily that, once bound to its ligand, can promote cell proliferation. In MTC, the expressed RET mutant protein constitutively activates MEK, ERK, and AKT, fueling tumor growth. 4,5 While all pathogenic germline mutations in RET that cause MEN2 can result in MTC, the frequency of RET somatic mutations in MTC is more limited.
For MTC patients who develop progressive regional or distant metastases, several treatment options have been developed and approved by the FDA over the past decade. Vandetanib (VAN) and cabozantinib, multikinase inhibitors (MKIs) of VEGFR, RET, and EGFR, were the first generation of agents to be FDA-approved for symptomatic or progressive MTC independent of driver mutation. Both compounds induce transient responses in the majority of patients, but resistance is universal and its use is hampered by toxicity and poor tolerability. 6 –8 More recently, the RET inhibitor selpercatinib (SEL) was FDA-approved for patients with symptomatic and/or progressive RET-mutated MTC. These compounds demonstrate high levels of response with fewer side effects. Although they appear superior to the MKIs, resistance still develops, 9,10 and their use is limited to RET-mutated MTCs. Thus, there is a need to improve upon treatments available for patients with progressive MTC.
Additional mutations within tumor suppressor genes have important roles in MTC biology. Loss of CDK2NC, 11 an upstream regulator of pRB, and RB1 itself, 12 predict MTC patient outcomes. Inactivating mutations within neurofibromin (NF1), encoding NF1, a negative regulator of RAS signaling, 13,14 have also been found in patients with MEN2A and MTC. 15 –17 NF1, a RAS-GTPase activating protein (RASGAP), functions to convert active, GTP-bound RAS, to the inactive GDP-bound state. 18 Active RAS binds to numerous effector proteins leading to the activation of a plethora of downstream signaling pathways. While the proteolysis of NF1 has been shown to be involved in the dynamic regulation of the RAS pathway, 19 little is known about the mechanisms involved in its proteolytic turnover. The CALPAIN (CAPN) family of calcium-dependent neutral cysteine proteases 20 have been implicated as directly affecting NF1 levels in melanoma. 21 Genomic alterations in the CAPN proteins and overexpression of CAPN have been found in a number of malignancies. 22 –25
To expand our understanding of the mechanisms driving MTC growth and identify new potential therapeutic targets, we have conducted the first proteomic profiling of MTC. For this analysis, we quantitated the proteome in cultured murine C-cells, cultured MTC cell lines (TT and MZ-CRC-1), and MTC patient samples from patients with MEN2A and sporadic MTC. From this analysis, we identified widespread changes in the composition of the proteome of all MTC samples compared with C-cells. We then tested whether any of the upregulated proteins in MTC were important for sustaining MTC tumor growth in vitro and in vivo.
Materials and Methods
RNA sequencing and differential expression analysis
Total RNA was extracted from cells using Trizol (Thermo Fisher). Total RNA sequencing libraries were prepared using the TruSeq Stranded Total RNA kit including rRNA depletion with Ribo Zero Gold kit (Illumina). An amount of 250 ng of RNA was used for library preparation following the supplier’s instructions, including 10 cycles of polymerase chain reaction (PCR) amplification. The DESeq2 (version 1.22.2) package was used to perform a differential expression analysis using R version 3.5.341. The data are available at GEO accession number: GSE140383.
Proteomics
MZ-CRC or TT cells from 10 cm dishes at 85–90% confluency were collected in duplicate for proteomics. Multiplexed quantitative mass spectrometry (MS)-based proteome mappings were performed in duplicate using TMT-10 plex reagents and the SPS-MS3 method on an Orbitrap Fusion mass spectrometer (Thermo Scientific). 26,27 Twelve fractions were analyzed by multiplexed quantitative proteomics performed using the simultaneous precursor selection-based MS3 method on an Orbitrap Fusion mass spectrometer (Thermo Fisher Scientific) coupled to an Easy-nLC 1000 (Thermo Fisher Scientific) with autosampler. 28 Peptides were separated on a microcapillary column (inner diameter, 100 µm; outer diameter, 360 µm; length, 30 cm, GP-C18, 1.8 µm, 120 Å, Sepax Technologies). MS2 spectra were assigned using a SEQUEST-based proteomics analysis platform. 29 The protein sequence database for matching the MS2 spectra was based on the human Uniprot protein sequence database.
Cell lines
MTC-M (#CRL1806) and TT (#CRL1803) cell lines were obtained from ATCC and confirmed by STR profiling. MZ-CRC-1 was generously provided by Gilbert Cote and also confirmed by STR profiling. 30 Cell lines were cultured in RPMI-1640 supplemented with 20% fetal bovine serum, L-glutamine, 1× MEM Non-essential Amino Acids, and 1× penicillin-streptomycin solution as specified by the ATCC regulation. The cells were maintained in a humidified 37°C incubator with 5% CO2. The cells were routinely tested for mycoplasma contamination.
Human sample information
Human samples (MEN2A and MTC tumors) were obtained with the consent of patients using the actively approved Ohio State University (OSU) IRB# 2006C0047.
Lentiviral vector packaging and delivery
Lentiviral plasmid DNA (sh-CAPN1: TRCN0000003558, TRCN0000003559, sh-NF1: TRCN0000238778, TRCN0000234918; Sigma) was prepared using the Qiagen midiprep kit. The virus was packaged in HEK 293T cells using the Takara Lenti-X Single Shot kit according to the manufacturer’s instructions.
Western blots
Protein samples were prepared by lysing cells in T-PER buffer (Thermo Scientific). An equal amount of protein was loaded to SDS-PAGE gel and separated under denaturing conditions at 120 V for 90 minutes at RT in Tris-Glycine-SDS running buffer. The blots were incubated in fat-free milk (5%) for blocking at room temperature for 1 hour, and then the blots were incubated with primary antibody overnight at 4°C. After being washed with tris-buffered saline and 0.5% Tween-20, the blots were incubated with corresponding secondary antibody for 2 hours at room temperature and imaged. For NF1 blots, RIPA buffer is used for cell lysis and protein lysate was resolved on NuPAGE 3–8% tris-acetate protein gels for NF1. After transfer to nitrocellulose membranes, blots were processed according to the Odyssey CLx protocol (LI-COR). Antibodies used for immunoblotting: anti-human NF1 (rabbit, Bethyl A300-140A, 1:1000) and anti-β-tubulin (mouse, Developmental Studies Hybridoma Bank E7, 1:10,000). Secondary antibodies used were anti-rabbit IgG (H + L) Dylight 800 4× PEG conjugate (goat, Thermo Fisher #35571, 1:10,000) and anti-mouse IgG (H + L) Dylight 680 (goat, Thermo Fisher #35518, 1:10,000).
Antibodies (primary antibody dilutions indicated)
CAPN1 (sc-271313; 1:200), pAKT (CST#9271; 1:500), pERK (CST#3192; 1:500), AKT (CST#9272; 1:500), ERK (CST#9102; 1:500), NF1 (Bethyl A300-140A; 1:1000), and β-tubulin (Developmental Studies Hybridoma Bank E7; 1:10,000). Calcitonin (ab16697; 1:200 primary and 1:500 secondary). Secondary antibody dilution 1:5000 was used for each Western blot.
Reverse transcription-PCR analysis
Total RNA was isolated from each well using Qiagen RNeasy kit according to the manufacturer’s instructions and complementary DNA (cDNA) was obtained from total RNA using random primer and the high-capacity cDNA reverse transcription kit (Applied Biosystems) according to the manufacturer’s instructions. Custom-designed primers were used (below) and qPCR was performed with FastStart Universal SYBR Green Master Mix (Roche) in a 96-well plate on a real-time PCR machine (Applied Biosystem) to determine the mRNA expression levels of the target genes. The expression level was normalized to the β-actin level by using the 2-ΔΔCt method.
Reverse transcription-PCR primers
CAPN1 GGAGGACATGGAGATCAGCG CGCATCTCGTAGGCACTCAT
β-actin TCACCCACACTGTGCCCATCTACG CAGCGGAACCGCTCATTGCCAATG
Calpain inhibitor treatment and growth assay
Cells were seeded in 48-well plates at 2 × 10⁴ per well and allowed to attach in the same RPMI media supplemented with 20% fetal bovine serum, L-glutamine, 1× MEM Non-Essential Amino Acids, and 1× penicillin-streptomycin solution as specified by the ATCC regulation. Cells were treated with the indicated concentration of CP1ia (A6185, Sigma) and CP1ib (PD-151746, Sigma), and viable cells were counted using Trypan blue (Sigma) at the designated time points.
Colony formation assay
The infected MZ and TT cells were selected using puromycin and seeded into 6-well plates at a density of 100 cells/well. The culture medium was refreshed every three days. When the colonies became visible in 15 days, the medium was removed, and the colonies were washed with PBS. Colonies were fixed and stained using crystal violet solution (0.1% crystal violet [Sigma], 1% methanol [Sigma], and 1% formaldehyde [Sigma]). Colonies were counted manually, and the values were plotted in GraphPad Prism.
IC50 determinations and proliferation assays
MZ-CRC and TT Cell lines were seeded in 96-well plates at 5000 cells per well in RPMI-1640 supplemented with 20% fetal bovine serum, L-glutamine, 1× MEM Non-Essential Amino Acids, and 1× penicillin-streptomycin solution and after 24 hours, calpain inhibitor I, either CP1ia or CP1ib, was added at concentrations from 0.02 to 5 μM in three replicates, with DMSO (<0.1%) as a negative control. Cell proliferation was measured using Cell Counting Kit-8 (CCK-8) assay (Abcam, ab228554) following the manufacturer’s instructions. Briefly, 10 μL CCK-8 was added to 100 μL medium. Absorbance at 450 nm was measured 1 hour later. IC50 values were determined by converting the concentration of drugs to logarithms values and their effects are normalized with a nonlinear regression algorithm in GraphPad Prism.
Combination treatment with calpain inhibitor and VAN and synergy calculations
MZ-CRC and TT Cells (5 × 10³) were treated with different concentrations of either CP1ia/CP1ib alone or a combination of CP1ia/CP1ib and VAN (Sigma). The cell viability was determined using CCK-8 (WST-8
Xenograft studies and treatment with CAPN1-inhibitor
Athymic nude (NCR-nu/nu) mice were used for xenograft studies. Five female mice (7–8 weeks of age) per group were injected subcutaneously into their right flanks with 5 × 10⁶ TT cells resuspended in 100 μL of PBS and 50 μL of Matrigel (Corning) per injection site. Tumors were measured weekly with digital calipers; tumor volumes were calculated based on the formula [(w 2 × l)/2], where “l” corresponds to the largest tumor measurement and “w” represents the corresponding measurement perpendicular to “l.” Drug treatment was initiated when tumors reached an average size of ∼125 mm3 (2 weeks); animals were randomly distributed among cohorts such that average tumor size was consistent among groups. CAPN1-inhibitor compound (CP1ia) (Sigma# A6185) stock was prepared in 100% DMSO; it was diluted in fresh PBS daily to the appropriate concentration for treatment; the final DMSO concentration was less than 1%. Animals were treated intraperitoneally for four consecutive days (Tuesday—Friday), approximately 24 hours apart with either PBS (control) or CAPN1-inhibitor (CP1ia). These experiments were conducted by the OSU Target Validation Shared Resource in accordance with the approval of institutional animal care protocols.
Histology and immunohistochemistry
For each sample, the tissue was fixed in 4% formalin for 24 hours and embedded in paraffin. From these tissues, 4 µm sections were cut for whole-mount hematoxylin and 3,3′-diaminobenzidine immunohistochemistry (IHC) staining for the biomarkers Ki-67. For the Ki-67, calcitonin, pERK, and NF1 staining, the primary antibody was incubated for 60 minutes. The following antibodies were used Ki67 (abcam15580), calcitonin (Dako, A0576), pERK (Santa Cruz SC7383), and NF1 (Infixionbio, 07E). The proliferative index of TT tumor xenografts was determined by immunohistochemical detection of Ki67 expression.
Immunofluorescence staining
MTC-M were seeded on poly-L lysin pre-coated coverslips and then approximately 60–70% confluent MTC-M, MZ-CRC, and TT cells were fixed with 4% PFA for 15 minutes at room temperature and after PBS wash, incubated in 0.1% Triton for 10 minutes at room temperature. BSA was used for blocking. Calcitonin (ab16697) was used for staining and ProLong™ Diamond Antifade Mountant with DAPI (Invitrogen Cat# P36962) was used as mounting media. Images were captured at a 60× lens with a Nikon A1R confocal microscope at CMIF OSU.
Statistics and Reproducibility
Each value in each graph is representative of three independent experiments in which each error bar represents the standard deviation. The two groups in each experiment are compared using one-sample t and Gehan-Breslow-Wilcoxon test between each measurement on GraphPad Prism 10.0 software. Precise p value, n values, and statistical tests used are provided in each figure legend.
Detailed methods can be found in Supplementary Data.
Results
MTC tumors have altered proteomes relative to normal thyroid tissue
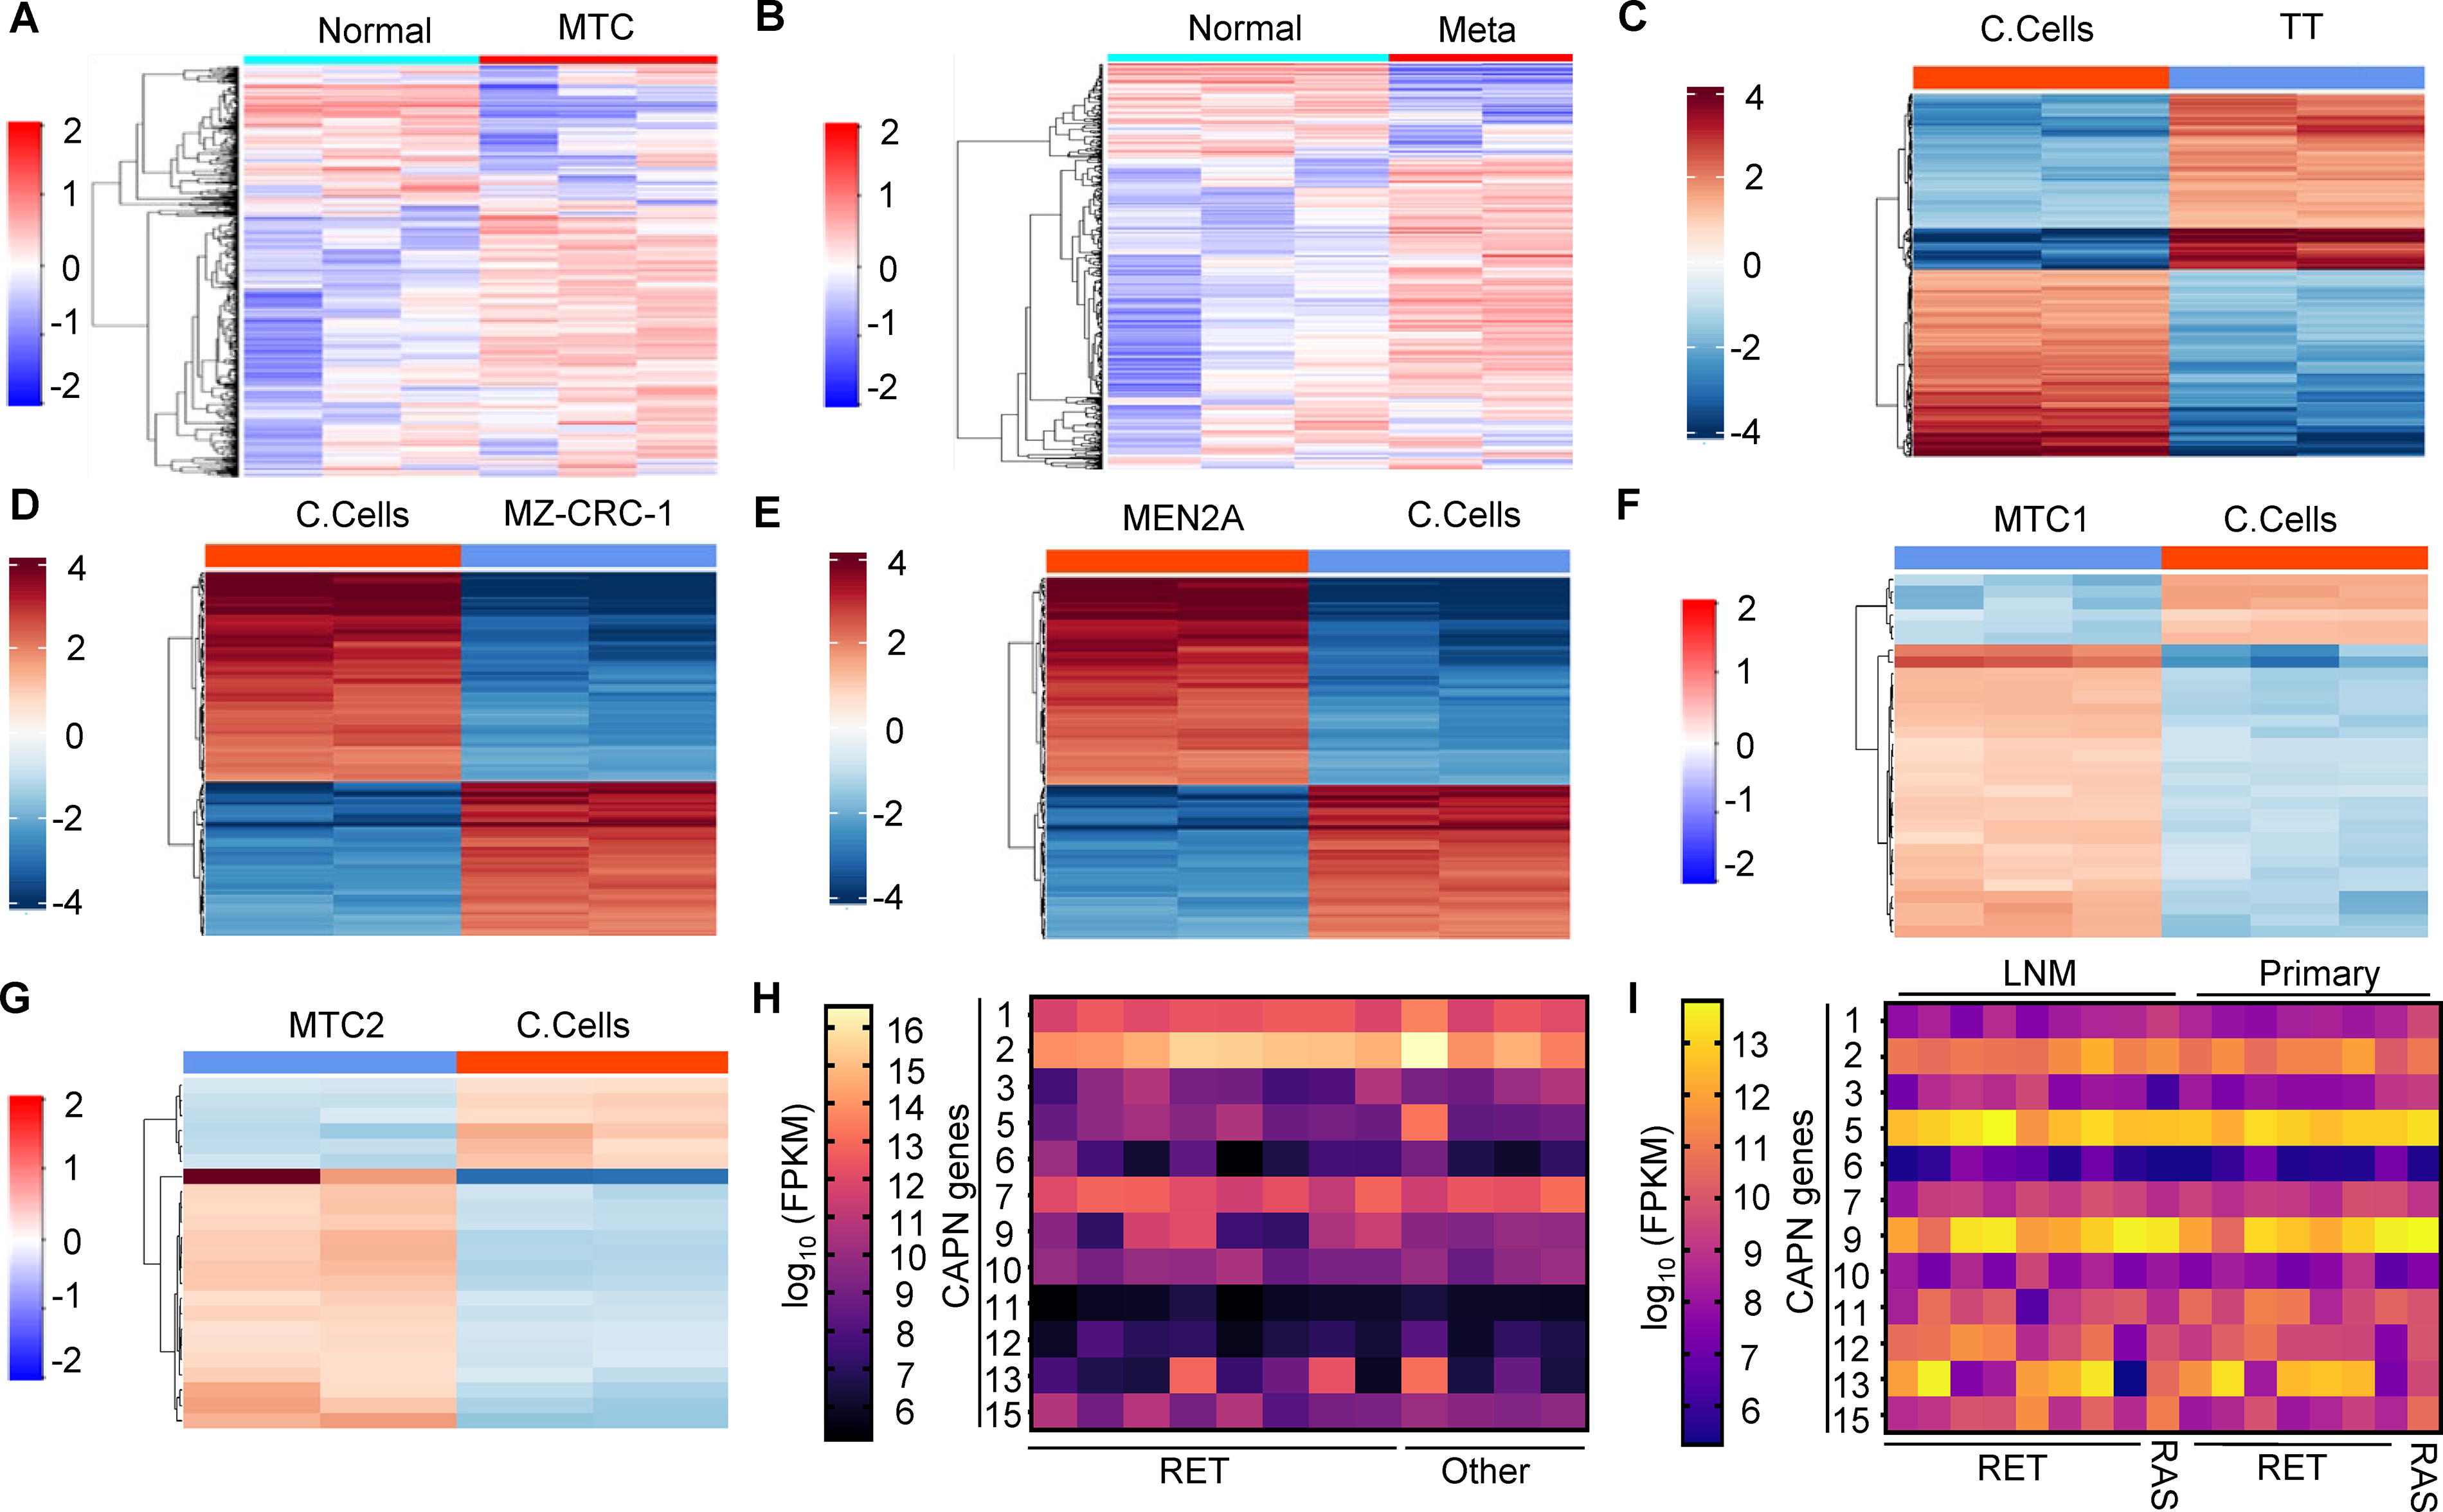
To define proteomic changes in MTC tumors relative to normal thyroid, we conducted proteomic profiling of six MTC tumors. For this, we selected three non-metastatic MTC tumors and three primary MTC tumors that were metastatic and compared their proteomes with normal thyroid tissue. We found 1818 upregulated and 654 downregulated proteins in non-metastatic MTC tumors relative to normal thyroid tissue (log2 fold 1, adjusted p value 0.05) (Supplementary Fig. S1A, Supplementary Table S1). Similarly, in metastatic MTC tumors, we observed that 1840 and 652 proteins were up- and downregulated, respectively (log2 fold 1, adjusted p value 0.05) (Supplementary Fig. S1B, Supplementary Table S2). Pearson correlations, principal component analysis (PCA), and heatmaps of these results show conserved proteomic changes in both metastatic and non-metastatic MTC (Fig. 1A, B, Supplementary Fig. S1C-F). Gene Ontology (GO) analysis identified nucleocytoplasmic transport and metabolic pathways as being altered in MTC tumors (Supplementary Fig. S2A). In metastatic MTC, GO analysis found significant changes in pathways regulating nucleocytoplasmic transport and spliceosome (Supplementary Fig. S2B). These proteomic profiles highlight the widespread changes in MTC tumors relative to normal thyroid tissue and implicate the transport and metabolic pathways in MTC biology.
MTC tumors and cancer cells have widespread RNA and protein changes.
MTC cells have widespread transcriptional and proteomic changes compared with C-cells
MTC tumors develop from rare C-cells within the thyroid. To identify changes in MTC cancer cells, relative to C-cells, we conducted RNA-Seq of cultured murine control (MTC-M, C-cells), TT (RET C643W mutation), and MZ-CRC-1 (RET M918T) MTC cells. In TT cells, we found 4432 genes upregulated and 208 genes downregulated (log2 fold change >2, adjusted p value > 0.05) compared with control C-cells (Supplementary Fig. S3A, Supplementary Table S3). Similarly, in MZ-CRC-1 cells, 4637 genes were upregulated and 256 genes were downregulated compared with control (Supplementary Fig. S3B, Supplementary Table S4). To explore the proteomic differences between C-cells and MTC cancer cells, we utilized liquid chromatography—MS (LC-MS). From this analysis, we identified 169 upregulated and 180 downregulated proteins in TT cells (Fig. 1C, Supplementary Fig. S4A, Supplementary Table S5) (log2 fold 1, adjusted p value 0.05). In MZ-CRC-1 cells, 62 upregulated and 84 downregulated proteins were found (log2 fold 1, adjusted p value 0.05) (Fig. 1D, Supplementary Fig. S4B, Supplementary Table S6). Pearson correlations (Supplementary Fig. S4C/D) and PCA analysis (Supplementary Fig. S4E/F) revealed clustered proteomic alterations in both MTC cell lines relative to control C-cells. GO analysis of changes in TT cells identified cytoskeleton organization and nucleotide metabolism as significantly altered (Supplementary Fig. S4G). In MZ-CRC-1 cells, proteins that function in DNA/nucleotide binding and endopeptidase activity showed enriched changes (Supplementary Fig. S4H). Collectively, the experiments show widespread changes in the transcriptome and proteome of cultured MTC cells.
MEN2A and MTC patient samples have altered proteomes
MEN2A patients have germline mutations within the RET gene that result in C-cell hyperplasia followed by MTC development. Samples from MEN2A patients obtained prior to MTC development enable the identification of RET-driven changes in a pre-malignant setting. To determine how RET mutations change the proteome of cells, we used LC-MS to profile C-cells purified from an MEN2A patient with hypertrophied thyroid (patient information, Supplementary Fig. S5A) and cultured murine C-cells. From this analysis, we found MEN2A samples clustered independently from murine C-cells using Pearson correlations (Supplementary Fig. S5B) and PCA (Supplementary Fig. S5C). We found 31 proteins upregulated and 10 downregulated in MEN2A samples compared with control C-cells (Fig. 1E, Supplementary Fig. S5D, Supplementary Table S7) using stringent cut-off values (log2 fold 1, adjusted p value 0.05). GO analysis showed that the upregulated proteins function in peptidase pathways (Supplementary Fig. S5E/F). These data show that MEN2A RET mutations promote significant changes in the proteome of C-cells.
To expand this analysis from C-cells to primary MTC tumors, we profiled MTC tumors from two independent patients with RET mutations (MTC1 and MTC2). We identified 25 proteins that are upregulated and 6 proteins that are downregulated in MTC tumor 1 (Fig. 1F, Supplementary Fig. S6A, Supplementary Table S8)and 17 proteins that are upregulated and 6 proteins that are downregulated in MTC tumor 2 when compared with cultured C-cells (Fig. 1G, Supplementary Fig. S6B, Supplementary Table S8). We found significant separation of both MTC tumors relative to cultured C-cells using Pearson’s correlations (Supplementary Fig. S6C/D) and PCA analysis (Supplementary Fig. S6E/F). GO analysis identified changes in cell adhesion and nucleotide binding changes (Supplementary Fig. S6G/H). Analysis of recurrent changes in the proteome of MTC samples showed CAPN1 levels are elevated in MTC compared with C-cells (Supplementary Fig. S6A/B).
These complete proteomic profiles from nine MTC tumors represent a good-sized cohort; for an uncommon cancer, however, to independently test these findings we analyzed the expression levels of CAPN family members in two independent MTC cohorts that have been profiled using RNA-Seq (OSU and Minna et al. 31 ). These tumor collections predominantly contained RET mutations. We found that CAPN1, CAPN2, and CAPN7 were all highly expressed in MTC tumors, independent of the genetic lesion (Fig. 1H, I). These independent MTC cohorts confirmed that the CAPN family is highly upregulated in MTC and that CAPN1 is abundant in MTC tumors.
CAPN1 levels are elevated and important for MTC cell proliferation
To independently confirm our proteomics data, we analyzed the levels of CAPN1 in C-cells, TT, and MZ-CRC-1 cells using reverse transcription (RT)-qPCR and Western blots. We found that the RNA and protein levels of CAPN1 are elevated in both TT and MZ-CRC-1 cells (Fig. 2A, Supplementary Fig. S7A). To determine whether CAPN1 was required for MTC cancer cell proliferation, we depleted CAPN1 using short hairpin RNA (shRNA) (Fig. 2B, Supplementary Fig. S7B) and measured cell growth compared with a shRNA control consisting of a scrambled (SCR) sequence. We found that CAPN1 depletion slowed the growth rates of both TT and MZ-CRC-1 cells (Fig. 2C, D). In agreement, the silencing of CAPN1 also significantly diminished colony formation of TT and MZ-CRC-1 cells (Fig. 2E, F). We next tested how the CAPN1 inhibitor, CP1ia, affected C-cell, TT, and MZ-CRC-1 cell viability. We found that both TT and MZ-CRC-1 are significantly more sensitive to CP1ia treatment than normal C-cells (Fig. 2G). These results suggest that elevated CAPN1 levels are important for sustained MTC cell growth.

CAPN1 is elevated in MTC and important for MTC cell phenotypes.
CAPN1i treatment inhibits MTC tumor growth in vivo
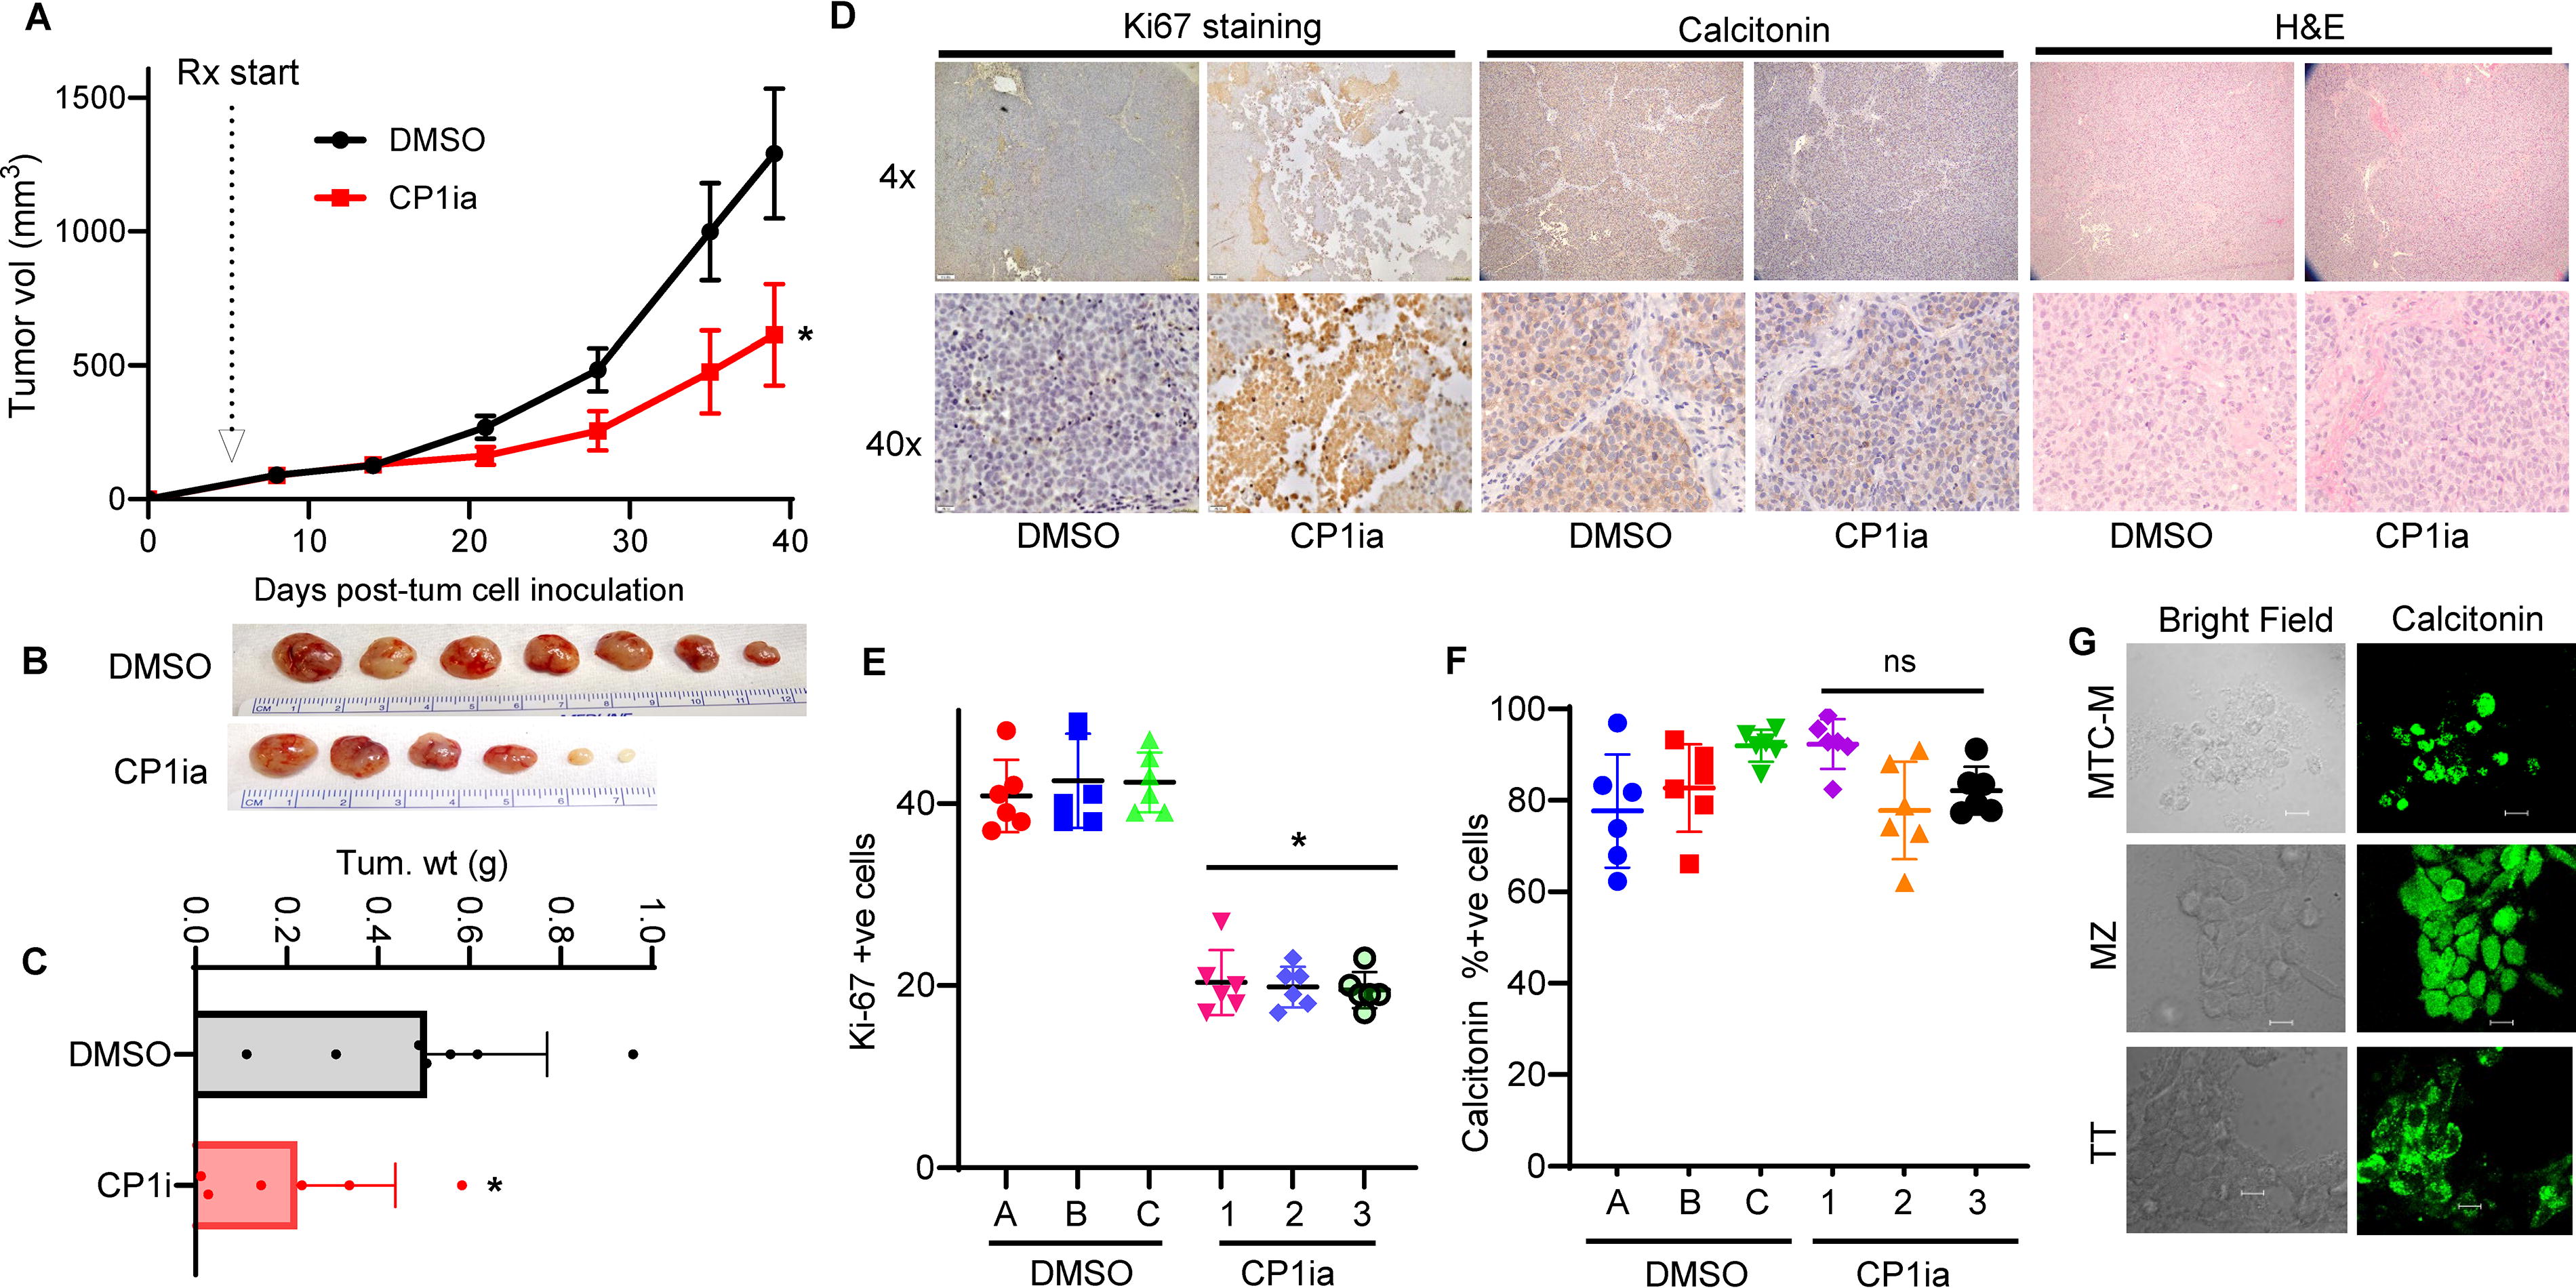
To investigate whether CP1ia can slow tumor growth in vivo, we utilized Athymic nude (NCR-nu/nu) mice to generate subcutaneous MTC tumors using TT cells. CP1ia or vehicle control treatment (DMSO) was initiated when tumors reached ∼125 mm3 in size; animals were then randomly separated into equal-sized cohorts (7 DMSO treated and 6 CP1i treated). Mice in each group were treated daily (intraperitoneally) for four consecutive days with either DMSO (control) or CP1ia (8 mg/kg), followed by a three-day treatment holiday. Mice were treated using this approach for three weeks, and tumor growth was tracked for a total of six weeks. From these experiments, we found that CP1ia treatment significantly slowed TT tumor growth and size (Fig. 3A, B). Each line is a representative of the three independent experiments and error bars represent the standard deviation of these replicates Tumor weight quantification showed that CP1ia-treated tumors were on average >50% smaller than DMSO-treated (Fig. 3C). CP1ia treatment was well tolerated, and we found no adverse effects or changes in mouse body weight over the course of the experiment (Supplementary Fig. S7C). Calcitonin and Ki67 staining showed that CP1ia therapy diminished the proliferation of MTC tumors relative to controls (Fig. 3D, Supplementary Fig. S7D). Quantification of Ki67 levels in each tumor identified elevated proliferative cells in DMSO control (Ki67 positive), relative to CP1ia-treated animals (Fig. 3E). Treatment with DMSO or CP1ia did not alter calcitonin staining in these tumors (Fig. 3F). Immunofluorescent staining of the three cell lines used including MTC-M, MZ-CRC-1 (MZ), and TT confirmed calcitonin positivity (Fig. 3G). These results show that therapeutic agents that target CAPN1 can slow MTC tumor growth.
CAPN1 inhibitor CP1ia slows MTC tumor growth and proliferation in vivo.
CAPN1 inhibitors are synergistic with VAN or SEL in MTC cells
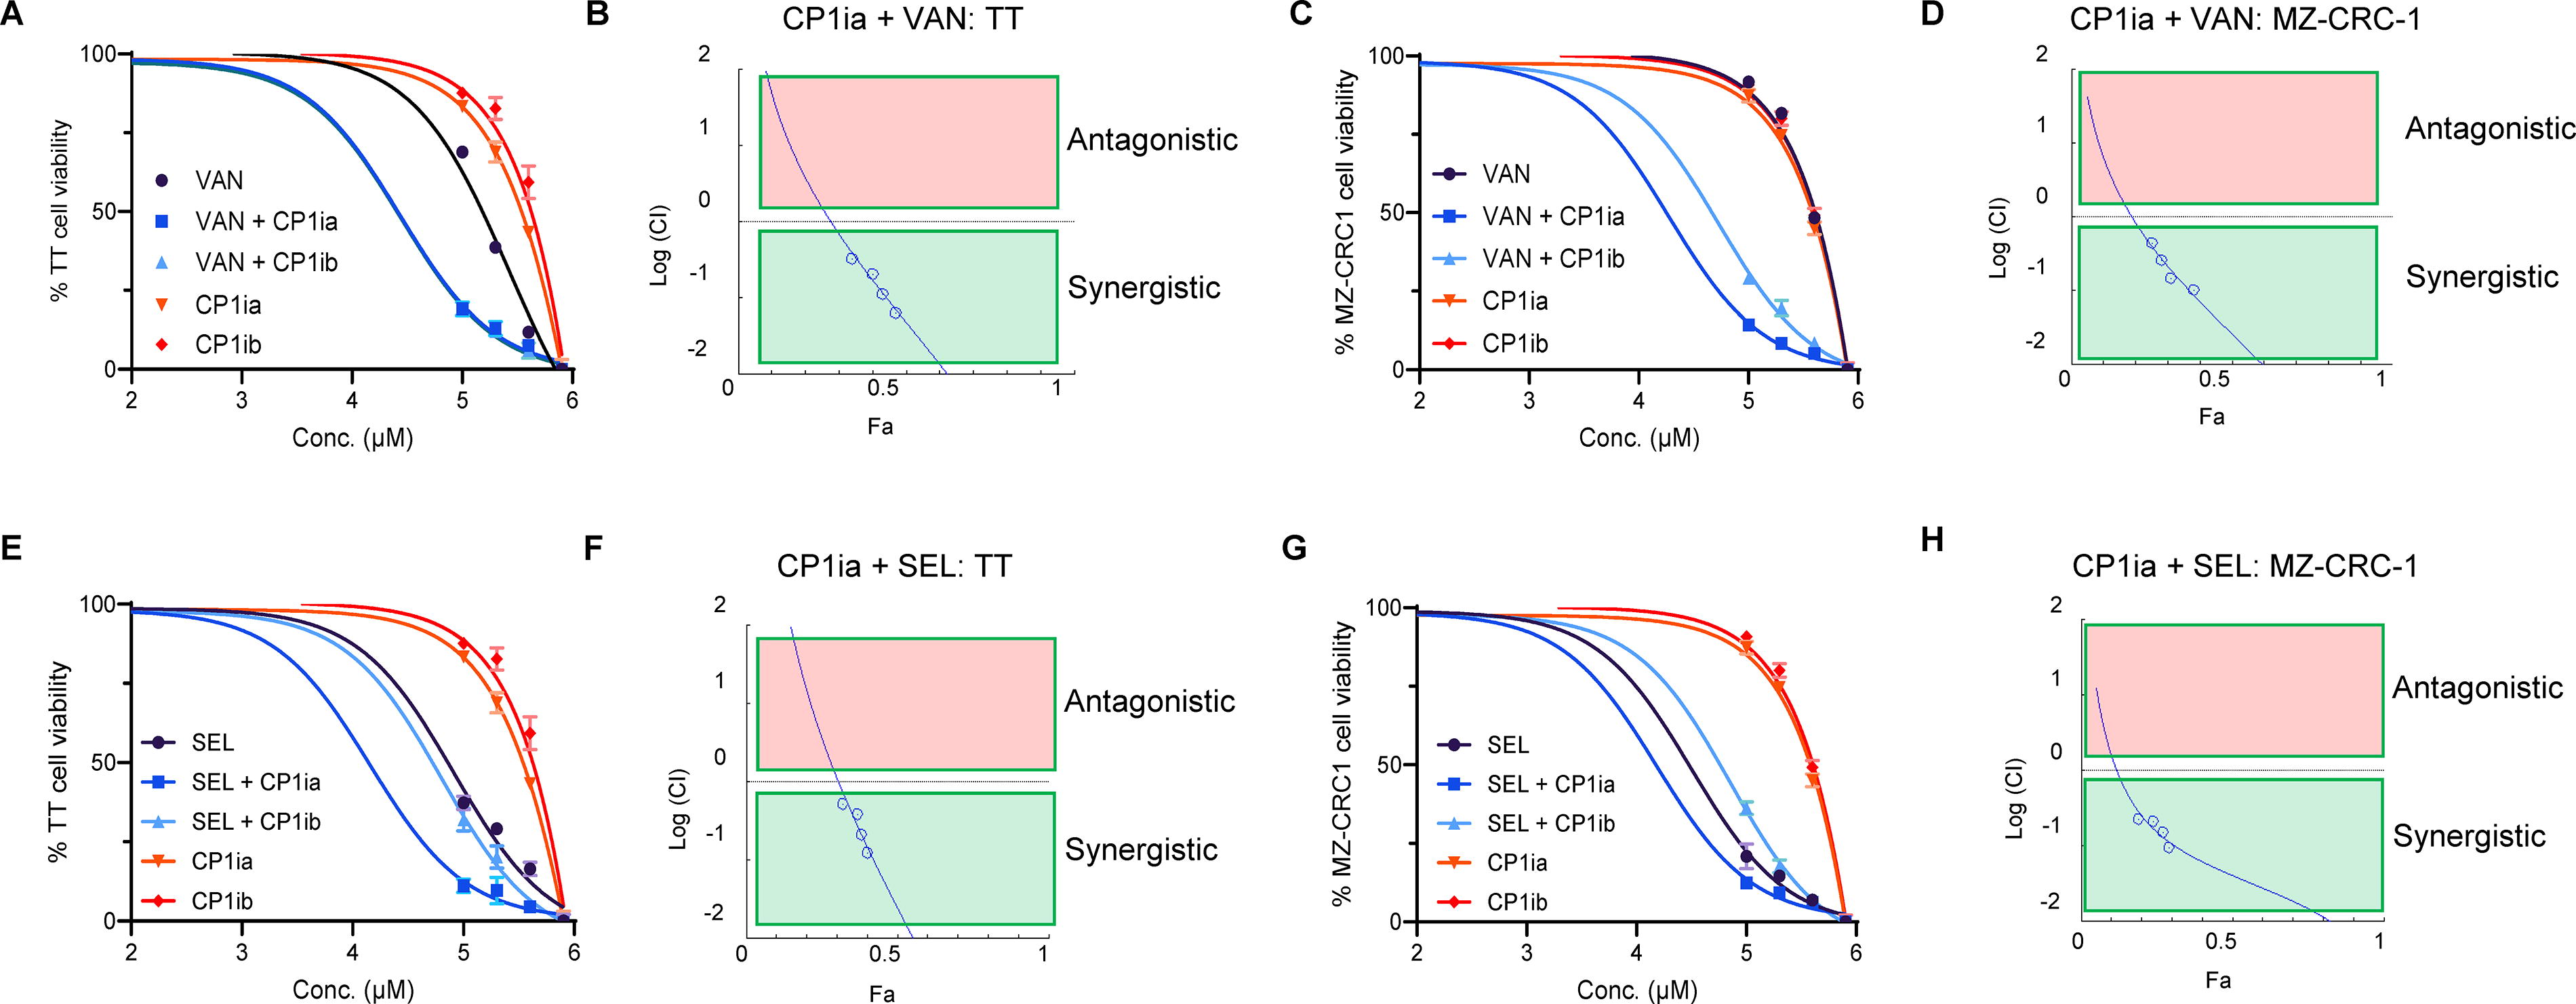
We next investigated whether CAPN1 inhibitors could function synergistically with existing treatments for MTC. Treatment of TT with CP1ia (A6185, Sigma), CP1ib (PD-151746, Sigma), or VAN as single agents resulted in apoptosis at high concentrations (Fig. 4A). Combination treatments using VAN IC50/4 and either CP1ia or CP1ib resulted in elevated sensitivity of TT cells (Fig. 4a, blue lines). To evaluate whether this effect was synergistic, we performed cytotoxicity and values were used for computing the synergistic effects using CompuSyn software that uses the Chou-Talalay combination index method. 32 These data showed that VAN and CP1ia (Fig. 4B) or CP1ib (Supplementary Fig. S8A/B) are synergistic. This approach was then repeated using MZ-CRC-1 cells. In agreement with previous reports, 33 we find that MZ-CRC-1 cells are less sensitive to VAN as a single agent than TT cells (Fig. 4C). Treating MZ-CRC-1 cells using CP1ia/b and VAN as a combinatorial therapy resulted in synergistically enhanced cell death (Fig. 4C, blue lines, D, and Supplementary Fig. S8D). We then extended this analysis to test whether this combinatorial effect was also seen with the FDA-approved, second-generation RET inhibitor SEL (LOXO-292). In agreement with published work, we found that TT cells show increased sensitivity to SEL as a single agent relative to VAN (Fig. 4E). Combination therapy using SEL IC50/4 + CP1ia or CP1ib increased the sensitivity of TT cells to these agents (Fig. 4E, blue lines, Supplementary Fig. S8C). This interaction is synergistic (Fig. 4F, Supplementary Fig. S8C). In MZ-CRC-1 cells, we also found that SEL and CP1i treatment reduces cell viability and is synergistic (Fig. 4G, H, Supplementary Fig. S8E). These data suggest that CAPN1 inhibitors function in synergy with both VAN and SEL in MTC cancer cells.
CAPN1 inhibitors act synergistically with VAN and SEL to kill MTC cancer cells.
CAPN1 inhibits NF1 activity to promote MTC cell growth
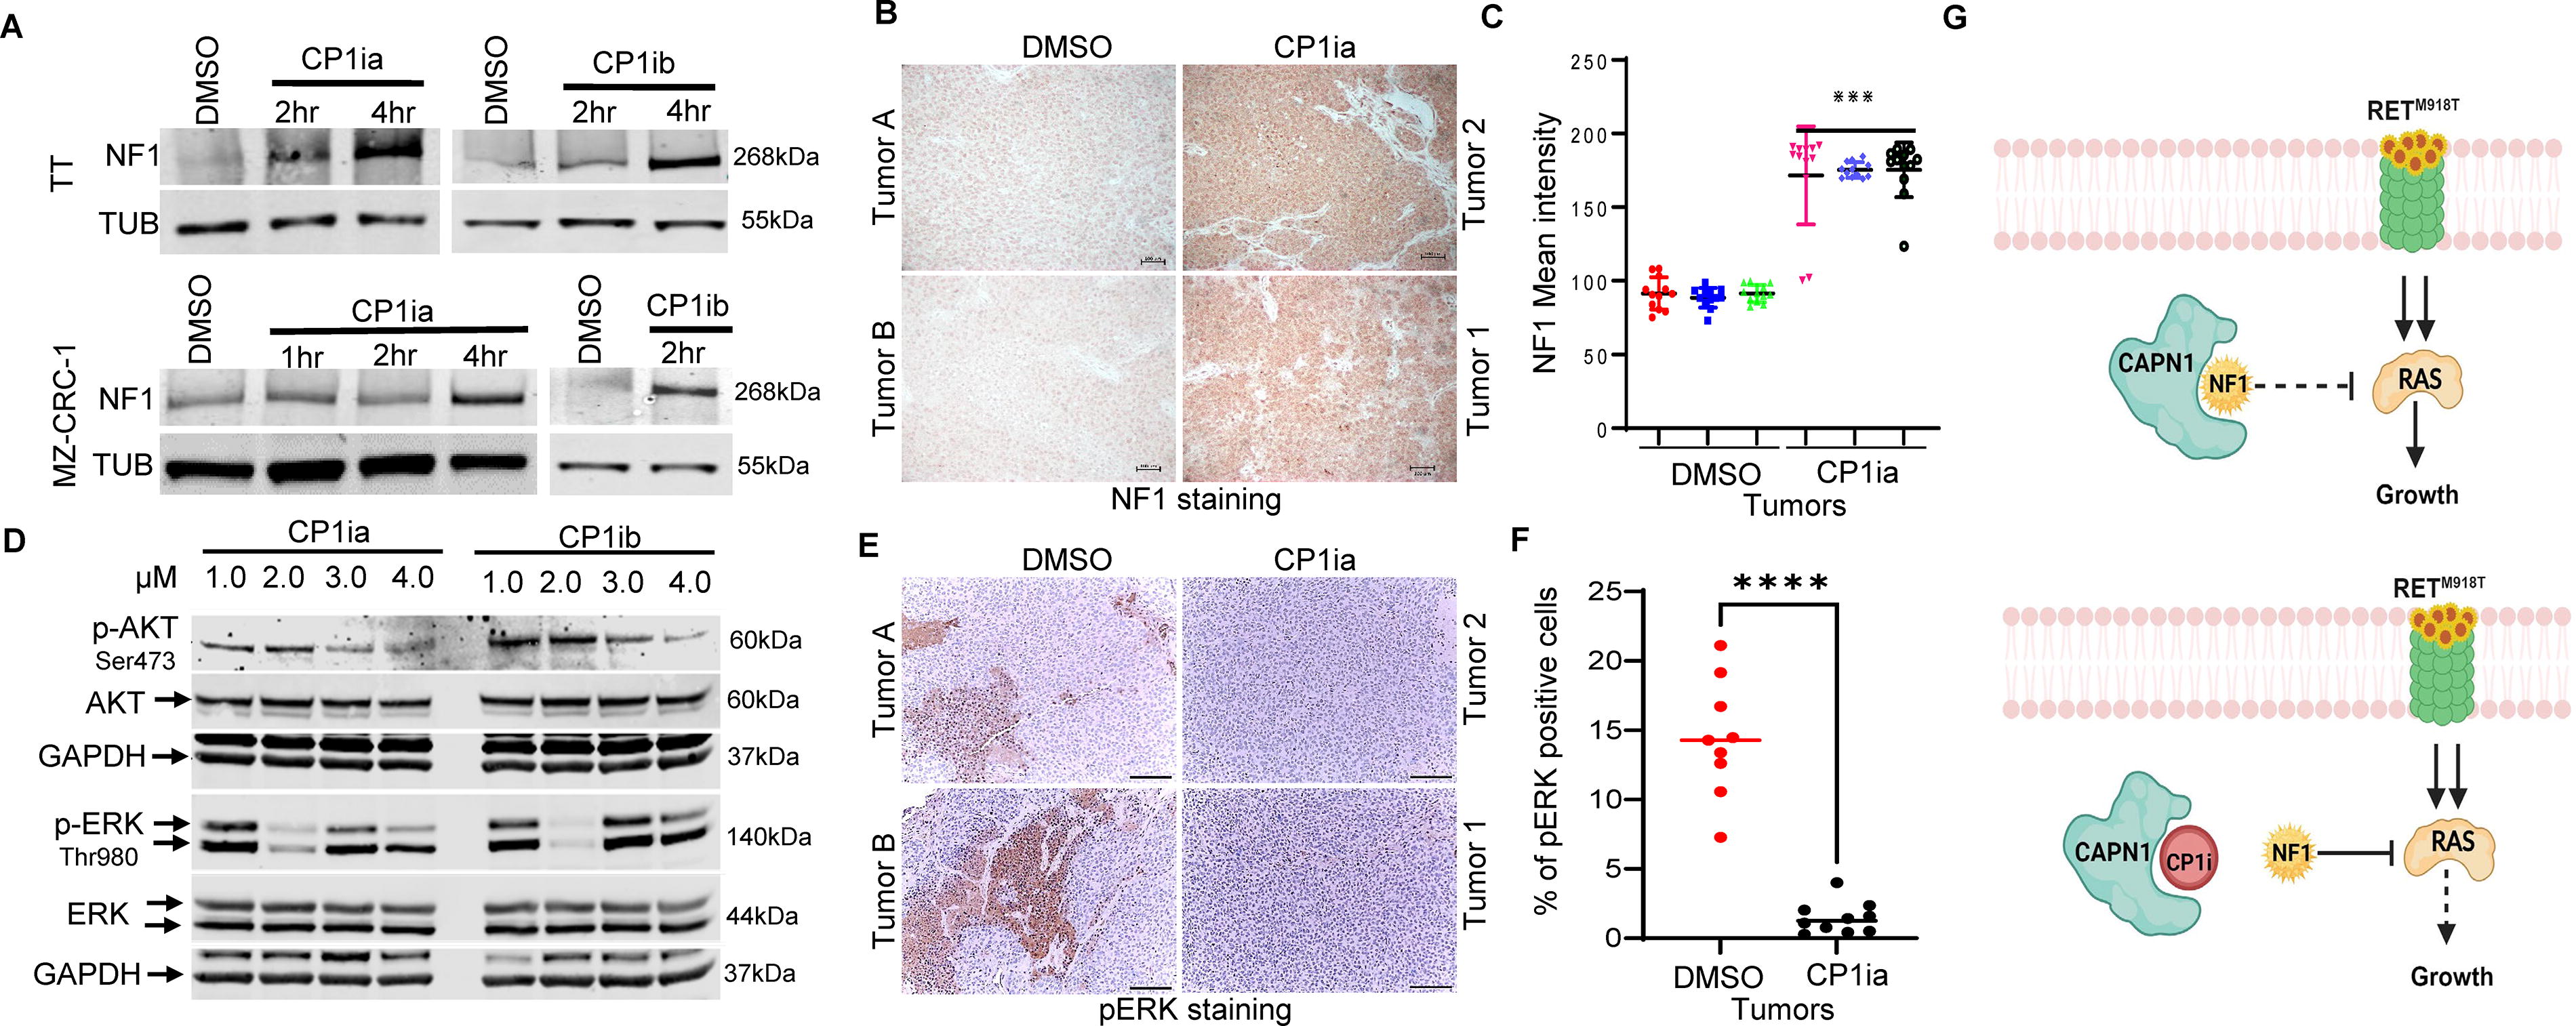
Previous studies in melanoma cell lines have suggested that CAPN1 can directly interact with NF1 and is involved in its proteolysis. 21 CAPN1 inhibition leads to the stabilization of NF1 and could thereby repress RAS-mediated cell signaling. To evaluate how CAPN1 activity affected NF1 levels, we treated TT and MZ-CRC-1 with CP1ia or CP1ib and performed Western blotting. We found that both CP1ia (5 µM) and CP1ib (5 µM) increased NF1 levels relative to DMSO (vehicle control)-treated cells (Fig. 5A). To measure these effects were also seen in vivo, we measured NF1 levels in DMSO or CP1ia-treated mice with xenograft TT tumors. IHC staining of these tumors showed that CAPN1 inhibition increased NF1 levels (Fig. 5B, C). We next assayed how CP1ia and CP1ib treatment affected signaling pathways downstream of RAS, including AKT, and ERK signaling via phosphorylation. We found reduced p-AKT, and p-ERK, levels in CP1ia/b-treated cells (Fig. 5D). In agreement with these results, we found that CP1ia-treated tumors showed lower pERK staining (Fig. 5E, F). The two groups were compared using a one-sample t and the Gehan-Breslow-Wilcoxon test between each measurement on GraphPad Prism 10.0 software and gave statistically significant differences with p values < 0.0001. Collectively, these data suggest that CAPN1 may promote MTC cell growth by reducing NF1 levels and inhibiting RAS and that this inhibition in RAS activity may be a mechanism supporting the synergy between RET and CAPN1 inhibitors (Fig. 5G).
CAPN1 functions to block NF1-mediated repression of RAS signaling.
Discussion
In this study, we found that CAPN1 protein levels are elevated in MEN2A patient samples and MTC cell lines and tumor samples relative to normal C-cells. We show that CAPN1 is important for MTC cell proliferation, colony formation, and tumor growth and that pharmacological inhibitors of CAPN1 synergize with the MKI VAN and the RET inhibitor SEL that are used in clinical practice. 34,35 We find that MZ-CRC-1 are more resistant to VAN than TT cells, however, both cell lines show strong synergy when cotreated with VAN and CP1 inhibitors. In contrast, MZ-CRC-1 cells are more sensitive to SEL, relative to TTs and show synergy only with CP1ia, while SEL synergizes with both CP1 inhibitors. These sensitivities are likely fueled by different RET mutations (TT: C643W and MZ-CRC-1: M918T) and other genetic lesions. Importantly, we show that CAPN1 inhibitor, CP1ia, can slow MTC growth and alter downstream signaling in vivo. Collectively, these findings show that CAPN1 is upregulated and important for MTC tumorigenesis. To determine the molecular role of CAPN1 in MTC, we measured the levels of CAPN1 substrate, NF1 following CAPN1-depletion or pharmacological inhibition. This showed that NF1 protein levels are elevated following CAPN1-repression, resulting in diminished activation of ERK and MAPK signaling. This, coupled with the suppression of RET signaling by VAN or SEL, suggests a possible mechanism for drug synergy.
These findings are in agreement with data from melanoma cell lines. 21 Treatment of melanoma cells with CAPN1 inhibitors has been shown to result in elevated NF1 levels and slowed cell growth in vitro. In this setting, CAPN1 inhibitors showed drug synergy with the MEK inhibitor trametinib. In melanoma patients, elevated CAPN1 levels in tumors correlated with poor patient prognosis. Unfortunately, MTC is not included within The Cancer Genome Atlas (TCGA), preventing this comparison for these tumors. However, these findings implicate elevated levels of CAPN1 as at least one mechanism contributing to the tumorigenic properties of tumor types with activating mutations within RAS and RET signaling pathways.
It is important to recognize that in addition to its role in modulating NF1, CAPN1 has a number of functions in regulating protein turnover, autophagy, and lysosomal processes that likely contribute to its role in tumorigenesis and tumor progression. 36 –38 In neurons, CAPN1-depletion results in the accumulation of ubiquitinated proteins, leading to cellular toxicity and diminished cell function. In these cells, CAPN1 interacts with and regulates the protein levels of a number of key cell polarity genes including the RAS homolog gene family member A (RHOA), paxillin, and tyrosine-protein phosphatase non-receptor member type I (PTPN1). 39 In MTC, we found that NF1 levels are very sensitive to CAPN1 inhibitors, suggesting CAPN1 may function to destabilize NF1. Although CAPN1 has an important role in regulating cell homeostasis, we found that systemic CP1ia inhibitor treatment was well-tolerated by mice. These findings suggest that combination therapy using CP1ia and SEL may be an effective and tolerated combination for treatment refractory MTC.
By developing proteomic profiles from cultured cells, pre-disposition dysplasias, and primary MTC tumor samples, this research has identified proteomic changes during MTC evolution. We found widespread proteomic alterations in MEN2A and MTC samples that show that constitutive RET activation fuels changes in cell adhesion, genome regulation, and cell signaling. A clearer understanding of how these changes contribute to the MTC tumorigenic process will provide the foundation for additional studies that test the dependency of MTC growth and survival of MTC cancer cells on these proteomic alterations.
Conclusions
Upregulation of CAPN1 protein levels is important for MTC growth and the suppression of NF1 activity. CAPN1 inhibitors synergize with VAN and SEL for maximal therapeutic efficacy against MTC. These findings suggest that this combinatorial approach may also have therapeutic utility in other RAS- and RET-driven tumor types.
Footnotes
Acknowledgments
The authors thank the Proteomics Resource and the Target Validation Shared Resource at The Ohio State University Comprehensive Cancer Center, Columbus, OH, for proteomic analysis and mouse xenograft studies.
Authors’ Contributions
E.K.: Conducted shRNA, CAPN1 inhibitor, and growth experiments. J.K.S., S.R., G.R.K., and S.L.: Analyzed the proteomic and RNA-seq, respectively. H.H., H.S., and J.W.: Conducted IHC. N.R.: Measured AKT, ERK, and MEK levels. S.J.B. and J.A.W.: Measured NF1 protein levels. A.V.: Conducted calcitonin staining on the MTC tumors. M.K.: Conducted calcitonin immunofluorescence. F.F.: Conducted Western blots. X.Z.: Dissociated MEN2A and MTC samples surgically extracted by J.P. and P.H.D. W.O.M.: Conceived the project and wrote the article with M.D.R. All of the authors approve the publication of this article and are responsible for its accuracy.
Author Disclosure Statement
The authors declare no conflicts of interest.
Funding Information
This work was supported by an NCI R01 CA251753 (WOM), American Cancer Society Research Scholar Award RSG-20–060-01 (WOM), American Thyroid Association Grant (WOM), and The Ohio State University Comprehensive Cancer Center and the National Institutes of Health under grant number P30 CA016058. P.H.D. was supported by the Department of Defense Grant (CA220838) and S.J.B. was supported in part by the National Human Genome Research Institute under award T32HG010464.
Supplementary Material
Supplementary Data
Supplementary Figure S1
Supplementary Figure S2
Supplementary Figure S3
Supplementary Figure S4
Supplementary Figure S5
Supplementary Figure S6
Supplementary Figure S7
Supplementary Figure S8
Supplementary Table S1
Supplementary Table S2
Supplementary Table S3
Supplementary Table S4
Supplementary Table S5
Supplementary Table S6
Supplementary Table S7
Supplementary Table S8