
Abstract
Background:
Resistance to thyroid hormone beta (RTHβ) is a rare disease resulting from mutations in the THRB gene, characterized by reduced T3 action in tissues with high thyroid hormone receptor β expression. Thyroid hormones regulate body composition and metabolism in general, and increased or decreased hormone levels are associated with insulin resistance. This study evaluated the presence of cardiometabolic risk factors and insulin sensitivity in patients with RTHβ.
Methods:
In all, 16 patients, 8 adults (52.3 ± 16.3 years of age) and 8 children (10.9 ± 3.9 years of age), were compared to 28 control individuals matched for age, sex, and body mass index (BMI). Anthropometry evaluation and blood samples were collected for glycemia, lipids, insulin, interleukin-6 (IL-6), tumor necrosis factor-alpha (TNF-α), leptin, adiponectin, ultrasensitive C-reactive protein (CRPus), free thyroxine, total triiodothyronine, thyrotropin, and anti-thyroid peroxidase measurements. Body composition was assessed using dual-emission X-ray absorptiometry and bioimpedance. Insulin sensitivity was evaluated in adult patients and controls using the hyperinsulinemic–euglycemic clamp (HEC), whereas homeostasis model assessment of insulin resistance (HOMA-IR) was calculated in all individuals studied.
Results:
Patients and controls presented similar weight, BMI, abdominal perimeter, and total fat body mass. Patients with RTHβ demonstrated higher total cholesterol (TC), p = 0.04, and low-density lipoprotein cholesterol (LDL-C), p = 0.03, but no alteration was observed in other parameters associated with metabolic risk, such as leptin, TNF-α, and CRPus. Two adult patients met the criteria for metabolic syndrome. There was no evidence of insulin resistance assessed by HEC or HOMA-IR. Elevated IL-6 levels were observed in patients with RTHβ.
Conclusion:
Using HEC as the gold standard method, no evidence of reduced insulin sensitivity in skeletal muscle was documented in RTHβ adult patients; however, higher levels of TC and LDL-C were observed in these patients, which suggest the need for active monitoring of this abnormality to minimize cardiometabolic risk. In addition, we demonstrated, for the first time, that the increase in IL-6 levels in patients with RTHβ is probably secondary to metabolic causes as they have normal levels of TNF-α and CRPus, which may contribute to an increase in cardiovascular risk. A larger number of patients must be studied to confirm these results.
Introduction
Thyroid hormones (THs) regulate body composition, lipid metabolism, and insulin resistance. 1 –6 Primary hypothyroidism is associated with high levels of low-density lipoprotein cholesterol (LDL-C) and triglycerides (TG), secondary to decreased LDL receptor activity and reduced clearance of triglyceride-rich lipoproteins. 7 –9 Recent studies suggest that hyperthyroxinemia may be associated with type 2 diabetes mellitus (T2DM) and metabolic syndrome (MetS). 10 These characteristics, observed in hyperthyroxinemia, are contradictory when considering the recognized physiological action of THs in metabolism, improving obesity-related morbidities. 11 Furthermore, they also contrast with reports of increased incidence of diabetes among patients with hypothyroidism 12 and increased prevalence of MetS described in individuals with thyrotropin (TSH) in the upper normal range. 13
A recent study demonstrated that patients with thyroid hormone resistance β (RTHβ) exhibit elevated concentrations of total cholesterol (TC), LDL-C, and TG, reduced high-density lipoprotein cholesterol (HDL-C) levels, and insulin resistance (IR), associated with increased hepatic and intramyocellular lipids. 14 In contrast, another study evaluating IR in patients with RTHβ reported that fasting insulin levels and the homeostasis model assessment of insulin resistance (HOMA-IR) index did not differ significantly in patients with RTHβ compared to controls. 15 However, these studies assessed IR only by calculating the HOMA-IR index. Furthermore, both demonstrated that impairment of intrahepatic TH and thyroid hormone receptor β signaling can lead to hepatic steatosis.
Adipose tissue is an active endocrine organ, which produces factors that regulate energy metabolism and insulin sensitivity (IS). The increase in visceral adipose tissue (VAT) is associated with increased release of adipokines and proinflammatory molecules. At the same time, there is a decrease in adiponectin levels, leading to IR, hyperglycemia, dyslipidemia, hypertension, and other components of MetS. The increased VAT represents one of the main risk factors for the development of T2DM. 16–17
We evaluated the association between thyroid function and the presence of cardiometabolic risk factors and IR in patients with RTHβ. To our knowledge, this study is the first to evaluate IS using the hyperinsulinemic–euglycemic clamp (HEC), considered the gold standard in this evaluation, and the first to evaluate inflammatory cytokines in this population.
Materials and Methods
Study population
A total of 28 patients with RTHβ followed at the University Hospital at Ribeirão Preto Medical School, USP, a tertiary center in Brazil, were contacted to participate in the study (Fig. 1). Sixteen patients belonging to eight families harboring seven different THRB gene mutations agreed to participate. The 12 other patients were lost to follow-up (n = 3), refused to participate (n = 5), had died (n = 1), or presented exclusion criteria such as type 1 diabetes mellitus (T1DM) (n = 1), previous radioiodine therapy due to erroneous diagnosis (n = 1), or early age (2 years old) (n = 1). Twenty-eight healthy individuals with normal thyroid function, matched for age, sex, and body mass index (BMI), were enrolled as controls. In the control group, the following exclusion criteria were applied: presence of T1DM or T2DM, dyslipidemia, or hypertension or use of medication that could interfere with thyroid function, blood pressure levels, or glucose and lipid metabolism.

Flowchart of participants selected for the study.
The diagnosis of RTHβ was confirmed by TSH, free thyroxine (fT4), free triiodothyronine (fT3), or total triiodothyronine (TT3) levels, and by direct sequencing of mutations in the THRB gene. 18 All participants, RTHβ carriers and controls, were divided into two groups according to age: adults (18 years of age or older) and children/adolescents (younger than 18 years).
Clinical data and blood samples from all individuals were collected after patients or guardians signed an informed consent form approved by the Ethics Committee of Ribeirão Preto Medical School (Protocol no. 3.681.327), and the research was completed in accordance with the Declaration of Helsinki, as revised in 2013. Clinical and biochemical parameters were collected and recorded in a database for this study.
Anthropometry and body composition
The following anthropometric data were collected: weight, height (BMI calculation), abdominal, cervical, and hip measurements, heart rate (3 measurements), and blood pressure (3 measurements on upper limbs, using an automatic sphygmomanometer).
Body composition was estimated by electrical bioimpedance (Biodynamics BIA310® tetrapolar device, Seattle, WA, USA). Using electric current, measurements of lean mass (kg) and fat mass (kg) were obtained. Body composition was also assessed using a Hologic QDR® 4500A scanner (Hologic Inc., Waltham, MA, USA). The values obtained were analyzed according to reference for age and sex. From the data obtained, the fat mass index (FMI), VAT, the android/gynoid fat ratio (A/G), and the Baumgartner index were calculated. The FMI takes into account the total weight of fat mass (in kg) divided by squared height (in meters). 19
Blood analysis
Fasting blood glucose was analyzed by an enzymatic method (Atellica ®CH Analyzer Glucose Hexokinase 3, Siemens Healthineers, Erlangen, Germany). TC, HDL-C, and TG concentrations were measured using an enzymatic colorimetric method (Atellica CH® Analyzer device, Siemens Healthineers). Low-density lipoprotein cholesterol (LDL-C) was calculated using the Friedewald formula [LDL-C = TC — (TG/5 + HDL-C)]. Glycated hemoglobin (HbA1c) levels were determined by high-performance liquid chromatography (Bio-Rad Laboratories, Inc., Hercules, CA, USA). THs (fT4 and TT3), TSH, and anti-thyroid peroxidase antibody were measured using an Atellica IM Analyzer assay (Siemens Healthineers). Ultrasensitive C-reactive protein (CRPus) was determined by chemiluminescence (IMMULITE® 2000, Siemens Healthcare Diagnostics, Los Angeles, CA, USA). Insulin was evaluated by radioimmunoassay (IMMULITE®2000, Siemens Healthcare Diagnostics) and expressed in μIU/mL. Serum cytokines [interleukin 6 (IL-6) and tumor necrosis factor-alpha (TNF-α)], leptin, and adiponectin were evaluated using the Milliplex® multiparametric magnetic immunoenzymatic test (Merck Millipore, TX, USA).
Insulin sensitivity
IS was assessed using HEC 20 in all adult participants, following our institution’s protocol. 21 Briefly, the procedure involved establishing two venous accesses: The first in a right antecubital vein for blood sampling and the arm being warmed with a thermal pad until a temperature exceeding 40°C was achieved to arterialize the blood. The second venous access was established in the contralateral arm for solution infusion. Insulin (Humulin R, Eli Lilly Co, Brazil) was administered as a primed continuous infusion aimed at achieving plasma insulin levels of approximately 600 pmol/L. Subsequently, the insulin infusion rate was fixed at 120 mU/m2/min, a level considered sufficient to completely suppress hepatic glucose production. Blood glucose levels were maintained constant (average 100 mg/dL, with a coefficient of variation of 5%–10%) throughout the 120-minute study period by infusing 10% glucose at varying rates based on blood glucose measurements taken at 5-minute intervals. Glucose metabolized (M), calculated with a specific computer program based on original formulas, 20,22 was utilized to evaluate IS, which was calculated as the glucose infusion rate, corrected for the glucose distribution space over the last 40 minutes (steady state). M was also corrected for fat-free mass (FFM) − (M/FFM). The mean M/FFM level obtained during HEC for white, nondiabetic, normotensive patients with BMI >25 kg/m2 was 53 μmol/min/kg−1, ranging from 19 to 87 for women and 20 to 84 for men. 22
IR was evaluated in all participants, including children, according to the following formula: HOMA-IR = fasting glycemia (mmol/L) × basal insulin (μU/mL)/22.5, with normal values <2.71. 23 –26
The MetS criteria were considered according to the International Diabetes Federation, 2009. 27
Statistical analyses
Parametric or nonparametric tests were conducted based on the distribution of quantitative variables, utilizing the Mann–Whitney U test. Categorical data were compared using the chi-square test. Correlations were estimated using Spearman correlation coefficients. Statistical analyses were performed using GraphPad Prism 5 (GraphPad Software, San Diego, CA, USA), with statistical significance defined by p < 0.05.
Results
Table 1 summarizes the age, clinical manifestations, thyroid function at diagnosis, and molecular diagnosis of each studied patient.
Clinical Manifestations, Genotype, and Thyroid Function at Diagnosis of Patients with Resistance to Thyroid Hormone Beta Studied
F: female; M: male. Reference values for adults: TSH = 0.4 to 4.0 μIU/mL; Free T4 = 0.9 to 1.8 ng/dL; Total T3 = 84 to 172 ng/dL; Free T3 = 1.8 to 4.2 pg/mL.
In all, 16 patients with RTHβ (9 female and 7 male) and 28 healthy individuals (17 female and 11 male) participated in the study. Eight of the patients were younger than 18 years (RTHβ children/adolescent group) with a mean age ± standard deviation (SD) (minimum-maximum age) of 10.9 ± 3.9 years (6–16), median of 12.5 years, and eight were adults (RTHβ adult group) with a mean age of 52.3 ± 16.3 years (36–78), median of 46.5 years (Table 2).
Clinical Characteristics and Body Composition of Participants
Results are expressed as mean±SD (range). Level of significance, p < 0.05. M: male, F: female.
A/G, android/gynoid ratio; ALMI, appendicular lean mass index; AP, abdominal perimeter; BMI, body mass index; DBP, diastolic blood pressure; FMI, fat mass index; HR, heart rate; RTHβ, resistance to thyroid hormone beta; SBP, systolic blood pressure; VAT, visceral adipose tissue; WHeR, waist-to-height ratio; WHR, waist-to-hip ratio; (—), not applicable.
The control group consisted of 28 individuals: 13 children younger than 18 years with a mean ± SD age (minimum-maximum age) of 10 ± 3.0 (5–15) years, median 10 years, and 15 adults with a mean ± SD age of 48.5 ± 16.6 (30–82) years, median of 43 years (Table 2).
As expected with this syndrome, patients presented high levels of fT4 and TT3 and high nonsuppressed TSH values, showing a statistically significant difference between the mean values of these variables compared to control groups (Table 3).
Laboratory Parameters of Study Participants
Results are expressed as mean±SD. Level of significance, p < 0.05.
Hyperinsulinemic–Euglycemic Clamp was not performed in this group.
CRPus, ultrasensitive C-reactive protein; FBG, fasting blood glucose; fT4, free thyroxine; GIR, Glucose Infusion Rate; HbA1c, Glycated hemoglobin; HDL-C, high-density lipoprotein cholesterol; HOMA-IR, homeostasis model assessment insulin resistance; IL-6, interleukin-6; LDL-c, low-density lipoprotein cholesterol; M/FFM, M value corrected for fat-free mass; RTHβ, resistance to thyroid hormone beta; TC, total cholesterol; TNF-α, tumor necrosis factor-α; TSH, thyroid-stimulating hormone; TT3, total triiodothyronine; (—) not applicable.
Anthropometry, glycemia, lipids, and serum cytokines
At the time of the study, patients and controls did not differ in terms of mean values of weight, height, BMI, waist-to-hip and waist-to-height ratios, heart rate, diastolic and systolic blood pressure, or body composition by dual-emission X-ray absorptiometry (Table 2).
Five adult patients with RTHβ presented with high FMI, and two of them were obese grade 1. Two adult patients with RTHβ presented with MetS, despite normal BMI. They showed elevated fat mass by bioimpedance, decreased lean mass by Baumgartner index, and increased A/G ratio, signaling increased visceral fat, in addition to high blood pressure, elevated TG, and reduced HDL-C.
The adult group presented lower fasting glycemic concentrations (mg/dL) than the control group (79 ± 6 vs. 87 ± 7, p = 0.01); conversely, there was no significant difference between the groups in HbA1c concentrations.
The adult RTHβ group had higher TC levels compared to the control group (207 mg/dL ± 21 vs. 180 mg/dL ± 36, p = 0.04); the same was observed for LDL-C (136 mg/dL ± 24 vs. 112 mg/dL ± 36, p = 0.03). There was no significant difference in mean HDL-C (43.2 mg/dL ± 13.2 vs. 42.1 mg/dL ± 6.5, p = 0.08 in men and 50.7 mg/dL ± 8.6 vs. 55.0 mg/dL ± 13.3, p = 0.05 in women) or TG levels (120.2 mg/dL ± 54.3 vs. 89.0 mg/dL ± 39.7, p = 0.2). In the children/adolescent group, patients and controls presented similar lipid results (Table 3).
We determined that TC, LDL-C, and non-HDL-C correlated with age in patients with RTHβ (TC r = 0.6, p = 0.01; LDL-C r = 0.68, p = 0.003; and non-HDL-C r = 0.66, p = 0.004, respectively), but not in controls with similar BMI, weight, and age (TC r = 0.3, p = 0.1; LDL-C r = 0.18, p = 0.35; and non-HDL-C r = 0.27, p = 0.15, respectively) (Fig. 2).
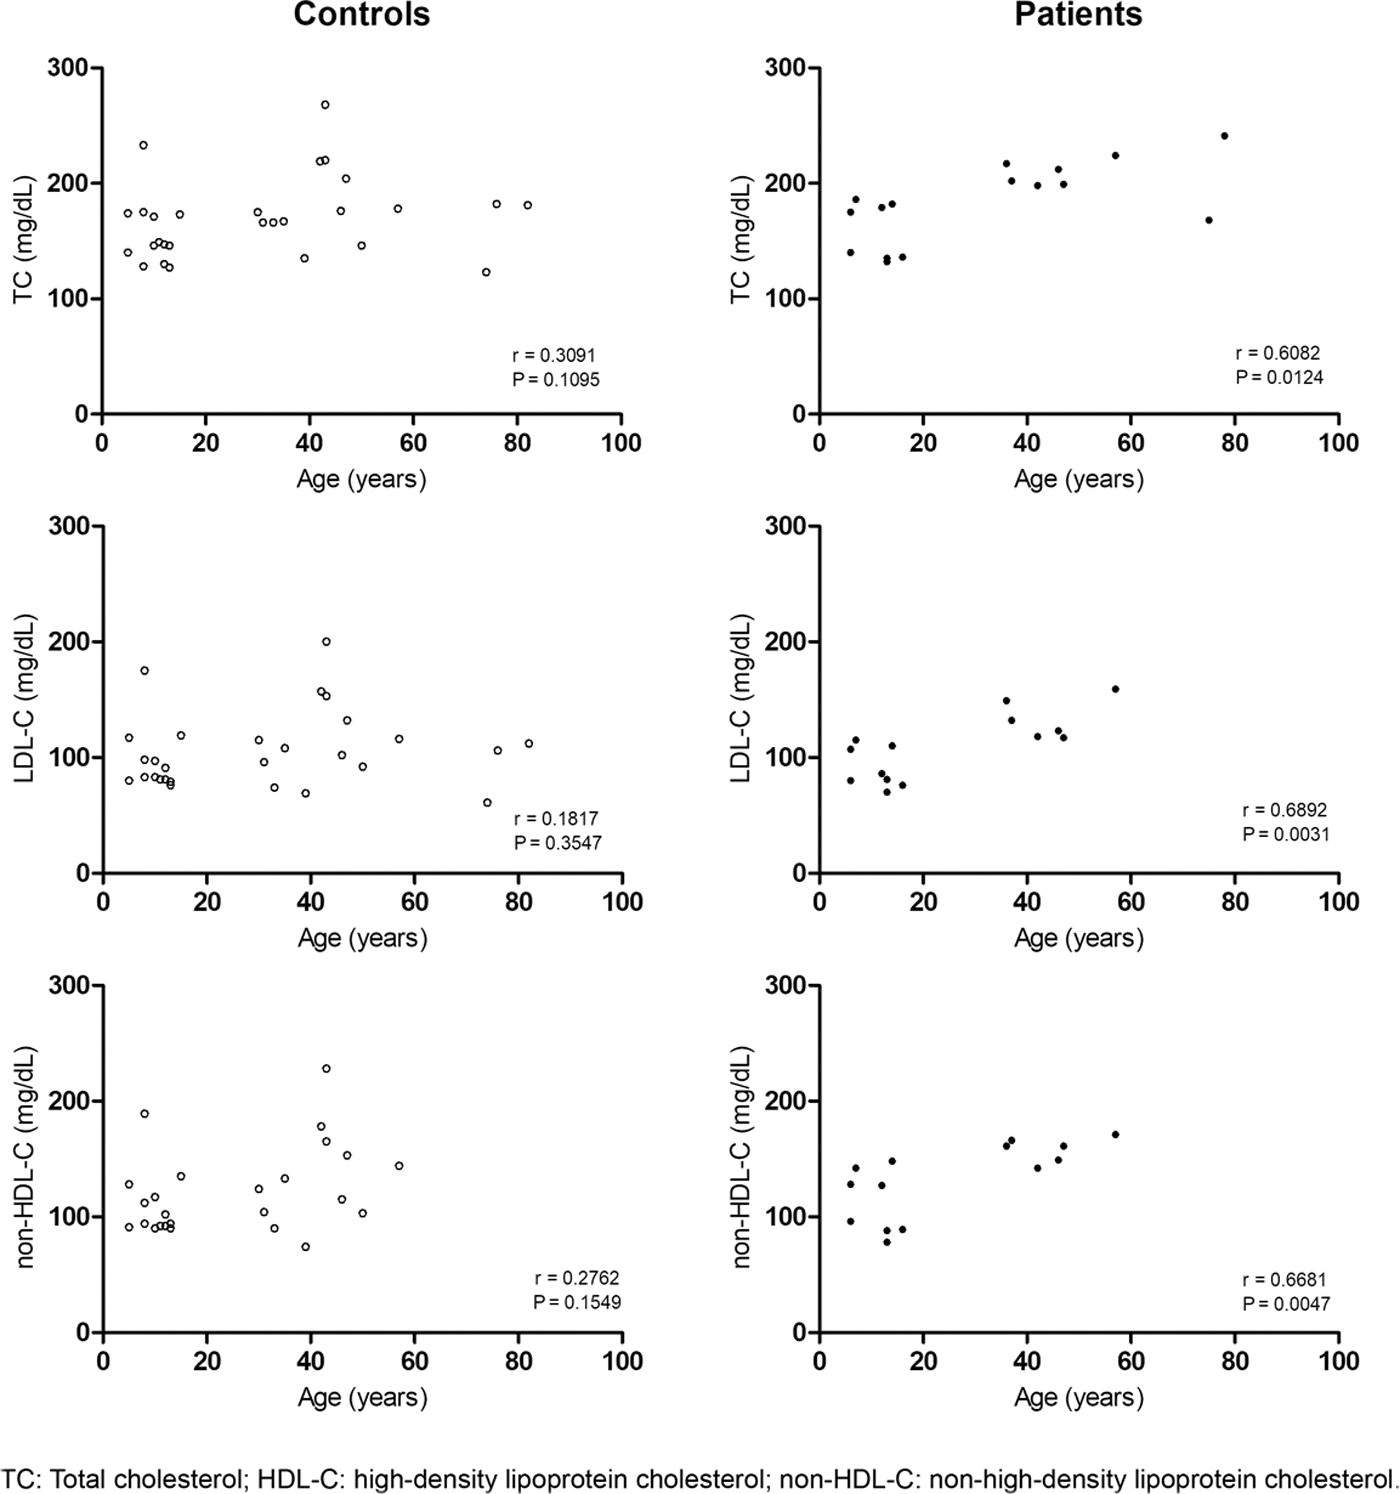
Correlation between TC, HDL-C, and non-HDL-C with age in patients with RTHβ and controls. HDL-C, high-density lipoprotein cholesterol; RTHβ, resistance to thyroid hormone beta; TC, total cholesterol.
In the individualized analysis of patients with RTHβ, we observed that six of eight patients exhibited a large abdominal perimeter; two of these patients met the criteria for MetS with high levels of TG and low levels of HDL-C, and one had altered blood pressure. No glycemic change was observed in this group. No control presented with MetS.
Regarding inflammatory cytokines, there was no significant difference between the groups when evaluating the mean CRPus and TNF-α values (Table 3). On the other hand, the RTHβ adults and children/adolescents had higher median IL-6 values than their control groups, however, with statistically significant values only for the adults, as shown in Figure 3.

Serum levels of interleukin-6 (individual values and median) in patients with RTHβ compared with respective controls. RTHβ, resistance to thyroid hormone beta.
Serum levels of leptin and adiponectin levels did not demonstrate a significant difference when comparing adults and children/adolescents to their respective controls (Table 3).
Insulin sensitivity
Patients with RTHβ and controls presented similar fasting serum insulin levels (adults 6.3 pmol/L ± 2.7 vs. 6.4 pmol/L ± 2.7, children/adolescents 11.2 pmol/L ± 3.3 vs. 9.1 pmol/L ± 3.2) and HOMA-IR (adults 1.2 ± 0.5 vs. 1.3 ± 0.6, children/adolescents 2.3 ± 0.6 vs. 1.8 ± 0.6) (Table 3).
All adult patients and controls underwent a successful clamp, and during HEC, the values of metabolized glucose (M) calculated during 80–120 minutes of the procedure (steady-state period) were corrected for FFM (M/FFM, μmol/min−1/Kg−1) obtained by a bioimpedance test carried out immediately before the procedure. No difference was observed in the mean M/FFM values between patients with RTHβ and controls (48.3 ± 14.0 vs. 52.9 ± 18.3; p = 0.62) (Fig. 4).
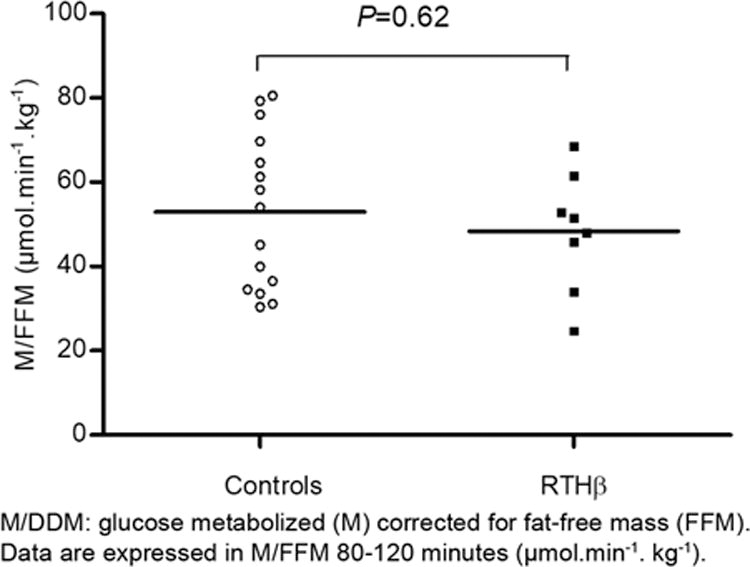
Assessment of tissue sensitivity to insulin obtained during hyperinsulinemic–euglycemic clamp comparing adult patients with RTHβ and controls. RTHβ, resistance to thyroid hormone beta.
Discussion
This investigation evaluated IR and IS and cardiometabolic risk factors in patients with RTHβ. Few data are available in the literature regarding these aspects of this clinical condition, and to the best of our knowledge, no publication has reported IS evaluated by HEC, a method considered the gold standard for such assessment. Furthermore, to our knowledge, this is the first study that evaluated cytokine levels in patients with RTHβ.
Two recently published studies evaluated IR in patients with RTHβ by calculating HOMA-IR; one demonstrated increased IR associated with increased hepatic and intramyocellular lipids. 14 In contrast, the other study showed that fasting insulin and HOMA-IR levels did not differ significantly between patients with RTHβ versus controls. 15 In our study, we evaluated IS in the skeletal muscle in adult patients by HEC, and IR in all patients (adults and children/adolescents) by calculating HOMA-IR. In both assessments, we observed no difference in sensitivity/resistance to insulin between the patients with RTHβ and the controls, in agreement with the findings of Chaves et al. 15 Differences in the populations studied, as well as the limitations associated with the use of HOMA-IR index as an indirect measure of IS, may explain these findings.
Our results demonstrate that adult patients with RTHβ have increased circulating cholesterol (total and LDL-C), in agreement with other studies. 14,15 That TC concentrations fall promptly after the administration of T3 in patients with RTHβ 28 suggests resistance to the thyroid hormone action in the liver and a status of hypothyroidism in the organ. Furthermore, previous study showed lower cell surface LDL-C receptor expression and reduced clearance of circulating LDL-C to justify this lipid change in the syndrome. 14
Interestingly, we observed that TC, LDL-C, and non-HDL-C levels correlated with age in patients with RTHβ, but not in controls with similar BMI and weight and within the same age range. This may suggest that the metabolic disorder deteriorates with age in patients with RTHβ.
In addition to dyslipidemia, other metabolic abnormalities, such as endothelial dysfunction and hepatic lipid accumulation, have been reported in patients with RTHβ. 14,15 Therefore, close monitoring of these patients is warranted in the presence of such abnormalities.
MetS has not been described in RTHβ. However, in our study, two of the eight adult patients assessed met the criteria for MetS. Furthermore, we observed statistically significantly higher TC and LDL-C among adult patients with RTHβ, suggesting a potential elevation in cardiovascular risk for individuals with RTHβ. Therefore, timely administration of lipid-lowering therapy for patients with hypercholesterolemia and/or recommendations for lifestyle changes (e.g., weight loss, physical activity) for those diagnosed with MetS are warranted.
It is well established that thyroid disorders may exacerbate the risk of cardiovascular diseases. Hypothyroidism is associated with an increased cardiovascular risk, partially due to its impact on the individual’s lipid profile, whereas hyperthyroidism is linked to increased cardiac output, widened pulse pressure, and tachycardia. 29
Long-term studies of patients with RTHβ do not exist to understand the main causes of death of these patients. Recently, for the first time, 61 English patients with RTHβ diagnosed between 1997 and 2019 were compared with 2750 age- and sex-matched controls. The authors documented reduced survival and increased cardiovascular morbidity in this cohort. Compared with controls, the patients exhibited increased risks for all-cause, atrial fibrillation, heart failure, and major adverse cardiovascular events comprising cardiovascular death, acute myocardial infarction, heart failure, or stroke. The median age of the first occurrence of any adverse event was 11 years earlier in patients with RTHβ (56 years, 95% CI: 44–65) compared with controls (67 years, 65–70). 30
In our study, we found increased levels of IL-6 in patients with RTHβ, without changes in other inflammatory markers, such as CRPus and TNF-α. Also, we observed a negative correlation between metabolized glucose and IL-6 (p = 0.038, r = −0.32). These results can be justified by the metabolic changes existing in RTHβ syndrome.
IL-6 is a pivotal cytokine of innate immunity that enacts a broad set of physiological functions traditionally associated with host defense, immune cell regulation, proliferation, and differentiation. Over the past 20 years, there has been increasing recognition that the innate immune response pathway leading from the NLRP3 (NOD-, LRR-, and pyrin domain-containing protein 3) inflammasome to IL-1 to IL-6 is involved in the genesis of chronic low-grade inflammation, which is a driving force for atherosclerotic disease initiation and progression. 31 Therefore, the high IL-6 levels observed in these patients confer an additional cardiovascular risk to RTHβ syndrome.
This study has some limitations. The RTHβ syndrome is a rare disease, so a small number of patients were included. Although assessing hepatic fat content could provide additional information, it was not performed at this time.
In conclusion, the relevance of the study lies in the unprecedented assessment of IS using HEC in a series of patients with RTHβ, demonstrating, contrary to what we imagined, that these patients do not present greater IR. Furthermore, we demonstrated for the first time an increase in IL-6 levels in patients with RTHβ, possibly due to metabolic changes. A larger number of patients from different ethnic populations should be studied to confirm these findings.
Footnotes
Authors’ Contributions
P.D.-H.: Investigation (lead), formal analysis (equal), writing—original draft (equal), and writing—review and editing (equal); P.G.: Conceptualization (equal), methodology (equal), writing—review and editing (equal), and supervision (equal); P.M.: Formal analysis (equal) and writing—review and editing (equal); L.M.: Conceptualization (lead), investigation (supporting), methodology (equal), formal analysis (equal), resources (lead), writing—review and editing (lead), supervision (equal), project administration (lead), and funding acquisition (lead). All authors read and approved the final version of the article and are accountable for all aspects of the work.
Data Availability
Data generated and analyzed in the study are available from the corresponding author upon request.
Author Disclosure Statement
The authors have nothing to disclose.
Funding Infomration
P.D.-H.: No funding information to declare; P.G.: No funding information to declare; P.M.: No funding information to declare; L.M.: FAEPA—Fundação de Apoio ao Ensino, Pesquisa e Assistência do Hospital das Clínicas da FMRP—USP.