
Abstract
Background:
It has long been known that thyroid disease can lead to changes in energy metabolism, thermoregulation, and anxiety behavior. While these actions have been partially attributed to thyroid hormone (TH) receptor α1 (TRα1) action in the brain, the precise neuroanatomical substrates have remain elusive.
Methods:
We used PET-CT scans to identify brain regions affected by TH. We then inhibited TRα1 signaling specifically in the most affected region, the zona incerta (ZI), a still mysterious region previously implicated in thermogenesis and anxiety. To this end, we used an adeno-associated virus (AAV) expressing a dominant-negative TRα1R384C in wild-type mice and phenotyped the animals. Finally, we used tyrosine hydroxylase-Cre mice to test specifically the contribution of ZI dopaminergic neurons.
Results:
Our data showed that AAV-mediated inhibition of TRα1 signaling in the ZI lead to increased energy expenditure at thermoneutrality, while body temperature regulation remained unaffected. Moreover, circulating glucocorticoid levels were increased, and a mild habituation problem was observed in the open field test. No effects were observed when TRα1 signaling was selectively inhibited in dopaminergic neurons.
Conclusions:
Our findings suggest that altered TH signaling in the ZI is not involved in body temperature regulation but can affect basal metabolism and modulates stress responses.
Introduction
Thyroid hormones (THs) play a crucial role in several pathways in the body. Both increased and decreased levels of circulating 3,3’,5-triiodothyronine (T3) and thyroxine (T4) can lead to metabolic and behavioral abnormalities. 1,2 Hyperthyroidism, a condition characterized by an excess of THs, manifests in weight loss, heat intolerance, tachycardia, and anxiety, 3 whereas hypothyroidism, a condition with low levels of THs, is associated with weight gain, cold intolerance, bradycardia, and major depression. 4 Although some of these effects have been thoroughly studied, such as energy expenditure modulation 5 and body weight change, 6 other aspects of the field remain poorly understood. It is known that increased levels of THs can lead to anxiety and irritability, 3,7 indicating that they do not solely act on the body’s periphery but also in the brain.
THs act on their target tissues by interacting with nuclear TH receptors (TRs), TRα, and TRβ. The main TR expressed in the brain is TRα1, where it is present in nearly all neurons. 2,8 To better understand the consequences of impaired TRα1 signaling, mice heterozygous for the TRα1R384C mutation have been generated. This mutation causes the receptor to have approximately a 10-fold decreased affinity to T3, essentially inhibiting TH signaling. The mutant receptor is dominant-negative, signifying that its expression will inhibit general TR signaling. 9 Mice carrying the mutation exhibit increased anxiety-like behavior and bradycardia, as well as several developmental defects. Interestingly, these mice also show lower body weight, which can be attributed to a decrease in adipose tissue mass. 10,11 In addition, it has been shown that this mutation causes a state of hypermetabolism, as the brown adipose tissue (BAT) is overactivated, 12 yet central body temperature is decreased due to increased tail heat loss. 13 However, even though several brain regions have already been implicated in the central actions of THs, such as body temperature regulation, 14 it remains unknown which brain region mediates which symptom.
In this study, we show that THs act in the zona incerta (ZI), a region implicated in thermogenesis and anxiety-related behavior. Inhibition of TH signaling specifically in the ZI by adeno-associated virus (AAV)-mediated expression of the dominant-negative TRα1R384C leads to an increase in basal energy expenditure and elevated levels of circulating glucocorticoids. These effects are not observed when inhibition was selective for dopaminergic neurons only, indicating that these neurons are not responsible for the TH-mediated changes.
Materials and Methods
Animals
Male wild-type C57Bl/6NCr mice used for AAV injections were obtained from Charles River Laboratories (Charles River, Germany). Male C57Bl/6NCr TH-Cre mice 15 along with their littermate controls, were obtained from the Gemeinsame Tierhaltung, University of Luebeck, Germany. All mice, aged 3–6 months, were individually housed at a temperature of 22°C, following a 12-hour light/dark cycle, and provided with a standard chow diet (#1314; Altromin, Germany) and water ad libitum. All experimental protocols adhered to the EU guidelines (210/63/EU) and were approved by MLLEV Schleswig-Holstein (Germany).
PET-CT imaging
Positron emission tomography (PET) imaging was performed twice per mouse (before treatment and two weeks after treatment with T3) as previously described, 16 using an Inveon preclinical PET/computer tomography (CT) system (Siemens). The mice were anesthetized with 2% isoflurane, placed on a twin mouse carrier (MEDRES, Germany), and cannulated in the tail vein with a 30G cannula connected to a polythene tubing (ID = 0.28 mm), which was fixated using a drop of glue. After starting the PET recording, 7–8 MBq of [18F] Fluorodeoxyglucose (FDG) in 50–100 μL saline were injected, and 45 minutes of emission data were recorded. Subsequently, the animals were subjected to a CT scan (180 projections/360°, 200 ms, 80 kV, 500 μA) for attenuation correction of the PET data, and the skull image was used for image co-registration and fat/lean mass quantifications. Plasma glucose levels were determined using a standard glucometer (Bayer, Germany) from tail vein blood after removal of the catheter. PET data were histogrammed in 12 × 30 s, 3 × 60 s, 3 × 120 s, 7 × 240 s time frames and binned using full 3D binning. The MAP-SP algorithm provided by the manufacturer was used to construct the PET images, and co-registration was performed using the imaging analysis software Vinci 17 to a 3D mouse brain atlas constructed from the 2D Paxinos mouse brain atlas. 18
Kinetic modeling
The PET data of the aorta, identified in the image of the first time frame of each animal, were used to extract an image-derived input function and corrected for partial volume effects by assuming a standardized volume fraction of 0.6. 19 Parametric images of the [18F]FDG kinetic constants K1, k2, k3, and k4 were calculated using a voxel-by-voxel (voxel size = 0.4 mm × 0.4 mm × 0.8 mm) data fitting to kinetic model with a two-tissue-compartment. The tissue-to-plasma glucose concentration ratio (CE/CP) is a measure for glucose transport with CE/CP = K1/(k2 + k3/0.26). 16,20 Because neuronal activation causes elevated glucose transport and this parameter is more robust to plasma glucose level alterations, we used the changes in glucose transport (CE/CP) as surrogate for differences in neuronal activation.
Stereotactic injections of AAV
Bilateral injections of 500 nL AAV serotype 1 per side into the ZI were performed according to the Mouse Brain Atlas 21 relative to the bregma (anterior-posterior 1.00 mm, medial-lateral ± 0.75 mm, dorsal-ventral −4.60 mm). For injection in wild-type mice, AAVs expressed either a dominant-negative TRα1R384C and mCherry (2.81 × 10¹² genome copies (GC)/mL) or green fluorescent protein (EGFP) (2.17 × 10¹² GC/mL) under a cytomegalie virus (CMV) promoter. TH-Cre mice received AAVs with a FLEXOn construct expressing either a dominant-negative TRα1R384C and mCherry (2.92 × 10¹² GC/mL) or control mCherry (2.3 × 10¹⁰ GC/mL) (VectorBuilder GmbH, Germany).
Immunofluorescence and immunohistochemistry
Brains were fixed in 4% paraformaldehyde for 24 hours and sectioned at 20–40 μm, blocked with 5% normal donkey serum (END9010-10; BIOZOL Diagnostics, Germany) or normal goat serum (#005–000-121; Jackson ImmunoResearch Labs, USA) in 0.3% Triton X-100 and incubated at 4°C with primary antibodies [anti-mCherry (1:1000; AB0040; OriGene, USA); anti-EGFP (1:1000; ab290; Abcam, UK); anti-tyrosine hydroxylase (1:1000; T2928; Sigma-Aldrich, USA); anti-c-FOS (1:500; #89065; Novus Biologicals, USA); anti-GFAP (1:1000; ab4674; Abcam); anti-NeuN (1:1000; ab104224; Abcam)] overnight and secondary antibodies [Alexa Fluor 594 (1:800; A-11058; Invitrogen, Thermo Fisher Scientific, USA); Alexa Fluor 488 (1:800; A-21206, A-21202; Invitrogen, Thermo Fisher Scientific); DyLight™ 405 AffiniPure™ (1:400; #703–475-155; Jackson ImmunoResearch Labs); biotinylated secondary antibody (1:250; BA-1000; Vector Laboratories)] for 1 hour.
Infrared thermography
Infrared images of interscapular BAT (iBAT), lower back, and tail were taken with an infrared camera (T335; FLIR, Sweden) in unrestrained animals. To uncover the skin above the iBAT, vaseline was applied between the shoulder blades as previously described. 22
Behavioral assay
Open field tests were conducted at 30 lux, and the elevated plus maze at 125 lux illumination. Animals were acclimated to the room for at least 1 hour before testing. Afterwards, mice were placed into the center of the apparatus and left to roam freely for 10 minutes (open field) or 5 minutes (elevated plus maze). Data were analyzed using tracking software (ANY-maze; Stoelting Europe, Ireland).
Liver glycogen
Hepatic glycogen content was determined using a Glycogen Assay Kit (MAK016; Sigma-Aldrich) according to the manufacturer’s instructions. Data were normalized to the amount of liver used per well.
Isolation of the ZI
The right brain hemispheres were collected after sacrifice and snap-frozen. To isolate the ZI, frozen brains were sectioned using a brain matrix, and sections containing the ZI were identified before dissecting and collecting the entire region with small punches.
Quantitative polymerase chain reaction
RNA isolation was conducted using snap-frozen tissue according to the manufacturer’s guidelines with RNeasy mini kits (#74104; #74804; #74704; #73504; QIAGEN, The Netherlands) with an additional DNase digestion step. Synthesis of cDNA was performed using the RevertAid First-Strand cDNA Synthesis Kit (K1621; Thermo Fisher Scientific). The quantitative polymerase chain reaction (PCR) was then carried out with GoTaq Master Mix (M7112; Promega, USA) and the QuantStudio system (Thermo Fisher Scientific). Housekeeping genes were selected according to NormFinder analysis 23 (Actb for ZI, Ppid and Hprt for liver, Gapdh and Ppia for muscle, Rplp0 and Hprt for iBAT, Ppid and Actb for adrenals, Rn18s and Actb for hypothalamus, and Actb for anterior pituitary). Data were analyzed with the ΔΔCT method and normalized for primer efficiency.
Enzyme-linked immunosorbent assay
Corticosterone (RE52211; Tecan, Switzerland), total T3 (DNOV053; NovaTec Immundiagnostica, Germany), and total T4 (EIA-1781; DRG Diagnostics, Germany) enzyme-linked immunosorbent assays were conducted with serum samples according to the manufacturers’ protocols.
Radiotelemetry and electrocardiography
Radiotelemetry transmitters (G2-E-Mitter; Philips Respironics, USA) were implanted abdominally to record body temperature and locomotor activity using radiotelemetry receivers (ER-400; Philips Respironics) as previously described. 24 Recordings were carried out at 22°C after a 2-week recovery period post-surgery. The ECGenie System (Mouse Specifics, USA) was used to record and analyze electrocardiograms (ECG).
Indirect calorimetry
Indirect calorimetry (TSE PhenoMaster, TSE Systems, Germany) was used to measure oxygen and carbon dioxide exchange in the animals. After acclimatisation to the respirometry chambers, food and water intake were recorded in intervals of 20 minutes. Animals were provided with food and water ad libitum at 22°C and fasted at 30°C for 6 hours to measure basal metabolic rate, body weight was recorded before and after the fasting period. The respiratory quotient (RQ) was calculated as the ratio between produced CO2 and consumed O2. Data were analyzed using TSE PhenoMaster Software (Version 6.5.3; TSE Systems) and Microsoft Excel (2021, Version: 2402; Microsoft Corporation, USA).
Statistics
All data were analyzed with Excel or GraphPad Prism 8 (GraphPad Software, USA). Statistical significance was tested with Student’s t-tests for comparisons between two groups, ANCOVAs for the identification of covariates in energy expenditure data, and two-way ANOVA with Tukey’s post hoc test for experiments with two groups and time as an additional variable. Significance levels were set as *p < 0.05; **p < 0.01; ***p < 0.001 and ****p < 0.0001. The figure design of Fig. 2A was created using BioRender.com.
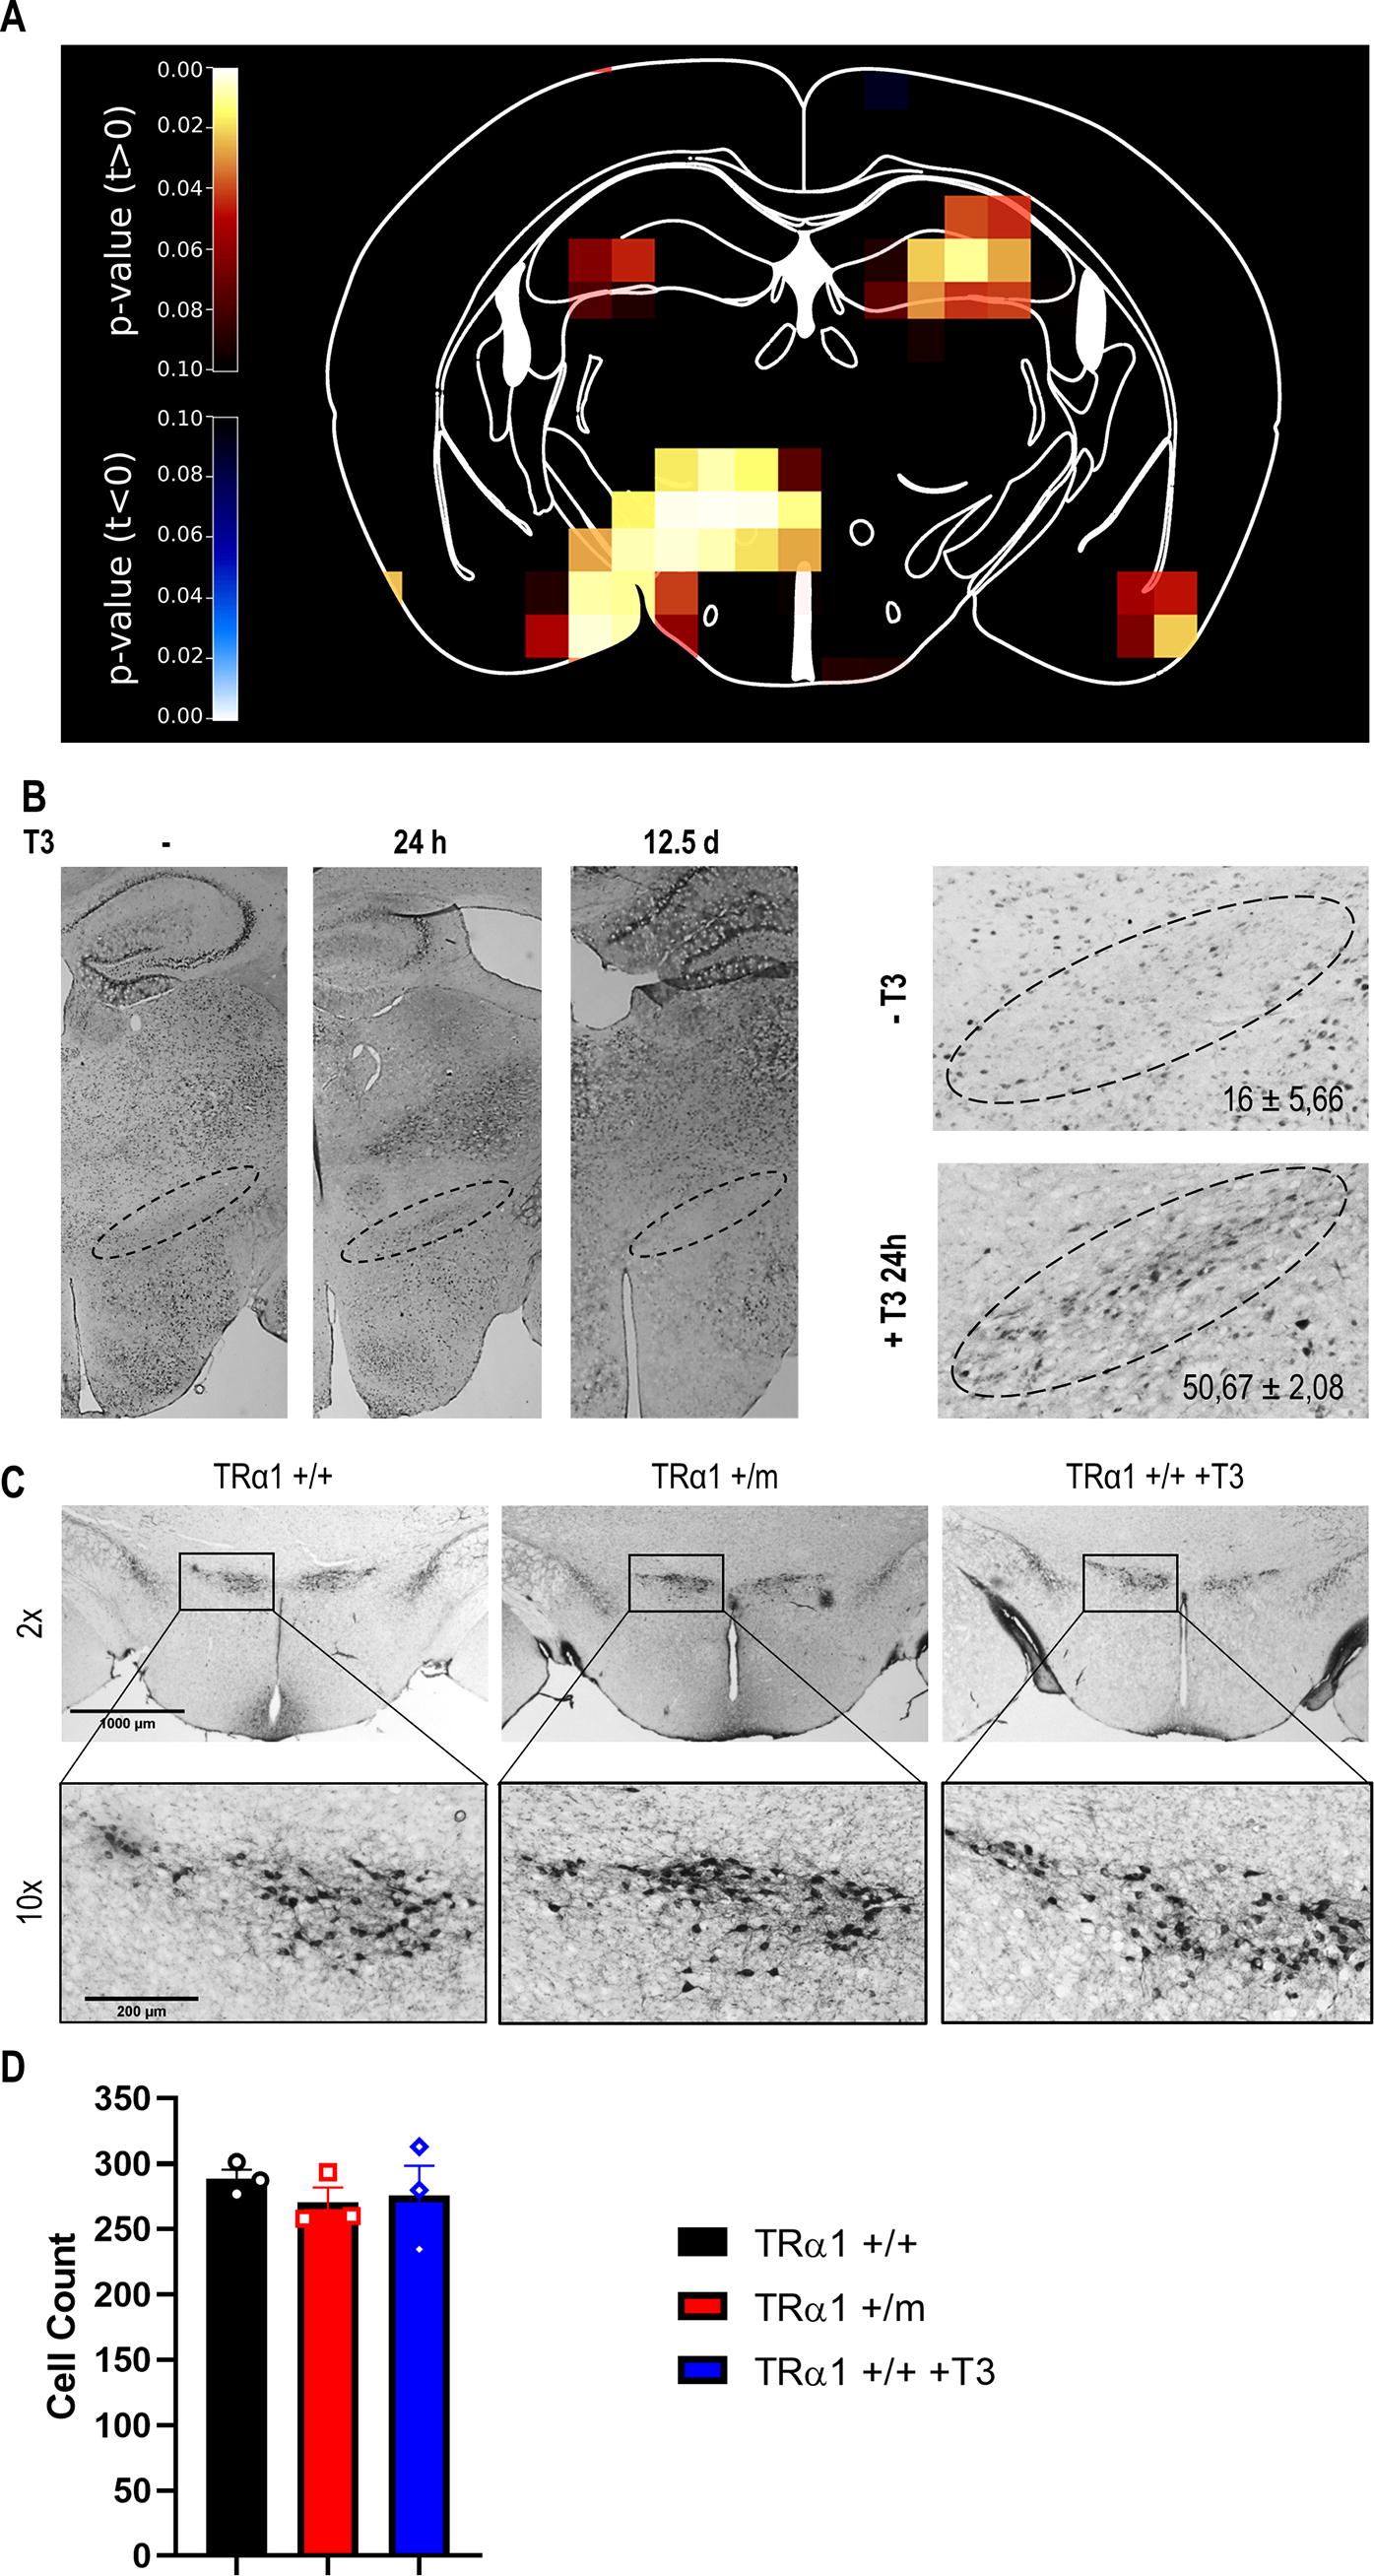
Activation of the zona incerta by thyroid hormones.
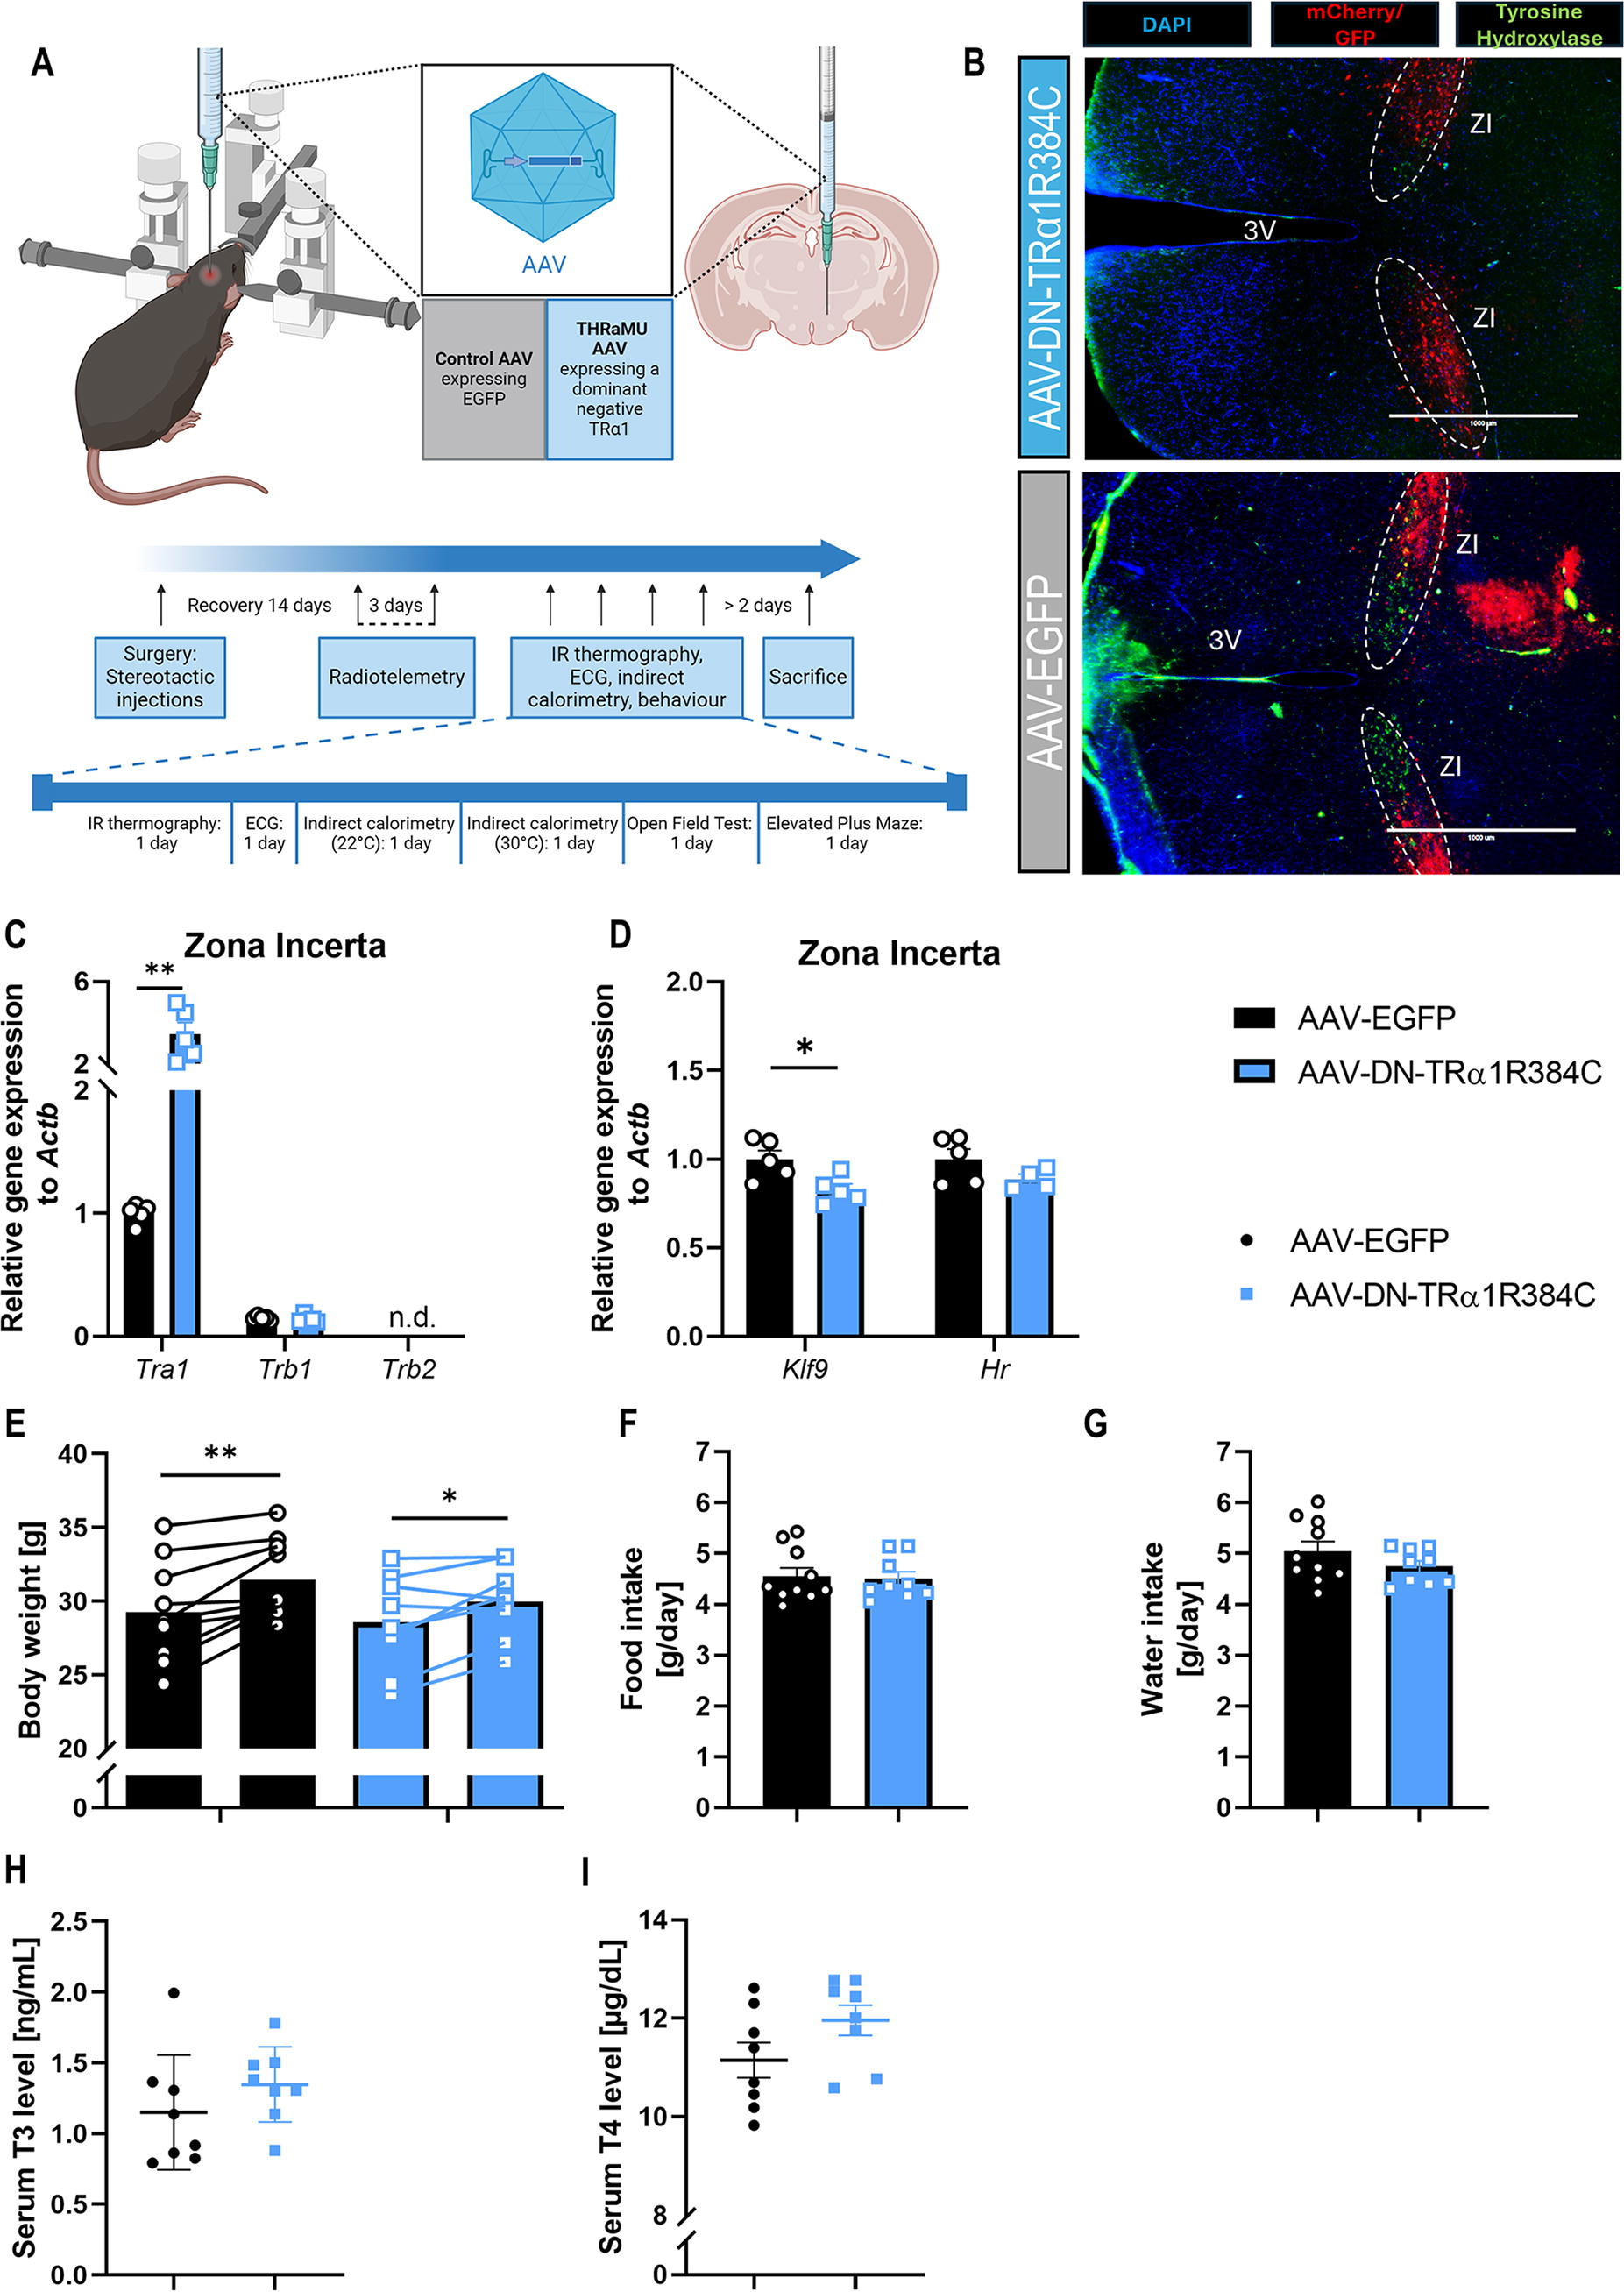
The effects of thyroid hormone signaling inhibition in the zona incerta.
Results
TH treatment activates the ZI
To identify TH-responsive brain regions, PET brain scans were conducted before and after oral T3 treatment, and relative glucose uptake was calculated (Fig. 1A). The region with the highest and most significant change in glucose uptake upon T3 was the ZI (Table 1), with a 16% increase (p = 0.00047). To validate neuronal activation of this region, we stained for the neuronal activation marker c-FOS in the ZI after 24 hours of T3. We observed approximately a 3-fold higher positive cell number as compared to controls. This effect was lost in mice treated with T3 for 12.5 days, likely due to c-FOS being a marker for early neuronal activation 25 (Fig. 1B). Based on these results and the known connection of the ZI to anxiety 26 and thermogenesis, 27 two parameters also affected in TRα1 mutant mice, we selected this region for further studies. Because it is known that the ZI contains dopaminergic neurons, 28 we initially counted these neurons in wild-type, TRα1+/m mice, and T3 treated wild-type mice using tyrosine hydroxylase as marker, 29 to exclude any developmental defects of TH. Our studies revealed no differences in neuron numbers between the groups (Fig. 1C–D).
Neuronal Activation of Different Brain Regions by Treatment with T3
Mice were treated orally with T3 in drinking water (0.5 mg/L) for 14 days. The table shows glucose uptake before (Day 0) and after (Day 14) treatment. Brain regions are sorted by highest difference in glucose uptake.
ZI, zona incerta; S1BF, primary somatosensory barrel field; Hip, hippocampus; MeP, posterior medial amygdaloid nucleus; Pir, piriform cortex; CPu, caudate putamen; LH, lateral hypothalamus.
Expression of a dominant-negative TRα1R384C in the ZI inhibits TH signaling
To directly test the consequences of altered TH signaling in the ZI for body temperature homeostasis and anxiety-related behavior, we injected AAVs expressing either a dominant-negative TRα1R384C or EGFP into the ZI of wild-type mice. The animals were equipped with radiotelemetry transmitters for non-invasive recording of body temperature and locomotor activity (Fig. 2A). The AAV injection in the ZI was verified by immunofluorescence of EGFP (control, approximately 34% transfection efficiency of neurons, EGFP+/NeuN+) or mCherry (TRα1R384C, approximately 40% transfection efficiency, mCherry+/NeuN+) in all animals (Fig. 2B). Co-staining with the cellular markers NeuN and GFAP suggested that the AAV primarily infected neurons in the ZI (Supplementary Figure S1A), and qPCR in isolated ZI confirmed the elevated Tra1 without any change in the other TH receptor Trb1 (Fig. 2C). We also observed reduced ZI expression of the neuronal TH target gene Klf9 (p = 0.02, Fig. 2D), confirming the downregulation of TH signaling, while Hr, in contrast to full TRα1 mutant mice (Supplementary Figure S1B), showed only a trend for reduction (p = 0.15). This difference is likely due to the fact that Hr is more prominently expressed in astrocytes, whereas AAV transduction favors neuronal cells.
When we then phenotyped the two groups, there was no difference in food or water intake after AAV injection, and body weight gain was also similar (Fig. 2E–G). We did not observe any difference in serum T3 and T4 concentrations between the two groups (Fig. 2H–I); however, pituitary Tshb mRNA expression was slightly elevated, while Trhr, Crhr, and Tbx19 were not altered, and hypothalamic Ucp2 30 was also unchanged (Supplementary Figure S1C). Body temperature recordings showed a mean temperature of around 35°C during the light phase and 36°C during the dark phase in both groups, with similar locomotion activity profiles (Supplementary Figure S1D–E). Accordingly, we found no changes in iBAT or tail temperatures (Supplementary Figure S1F), as revealed by infrared thermography, and thermogenic genes in iBAT were also similar (Supplementary Figure S1G). These findings suggest that the expression of a dominant-negative TRα1R384C indeed inhibits TR signaling in the ZI without affecting peripheral TH levels or the central control of body temperature regulation.
Inhibition of zona incerta TH signaling promotes basal metabolic rate
Since THs have been linked to influencing energy metabolism both in humans 31 and mice, 32 we conducted indirect calorimetry, revealing no significant difference in oxygen consumption or RQ at 22°C (Fig. 3A–C). However, at 30°C during fasting conditions, ANCOVA analysis revealed significantly higher oxygen consumption in the dominant-negative TRα1 animals, indicating increased energy expenditure (p = 0.0029, Fig. 3D–E), which was not correlated with their serum hormone levels (Supplementary Figure S1H). The RQ was again not affected (Fig. 3F). Interestingly, the mice receiving TRα1R384C lost significantly more weight during the fasting period at 30°C (4% of total body weight in dominant-negative TRα1 animals vs 2.8% in controls, p = 0.04, Fig. 3G). Analysis of the liver revealed no difference in hepatic glycogen content (Fig. 3H) or the expression of genes involved in liver metabolism (Fig. 3I). Gene expression analysis of the muscle showed significantly decreased expression of Sln, whereas other genes involved in calcium flux and muscle growth were not affected (Fig. 3J).

Contributions of zona incerta TRα1 to energy metabolism.
When we then analyzed the animals for stress and anxiety-related behavior, we observed approximately 3-fold increased corticosterone levels in the dominant-negative TRα1 group compared to control animals (Fig. 4A), while hypothalamic Crh and anterior pituitary Pomc, as a precursor for ACTH, were not changed (Fig. 4B). Readouts of glucocorticoid action, such as hepatic target genes or hippocampal volume were not affected (Supplementary Figure S2A+B), and heart rate or ECG complexes were also not altered (Supplementary Figure S2C), suggesting an acute elevation of serum levels rather than a permanent resetting. On the behavioral level, the ZI TRα1R384C group spent more time in the outer zones and less time at the center of the open field compared to the control group in the second half of the test, whereas no difference was observed in the first 5 minutes. Overall speed and distance travelled were not altered in either time period (Fig. 4C). In the elevated plus maze, we observed more entries into the open arm, which, however, when normalized to total entries was no longer significantly different, and mobility was not affected (Fig. 4D).
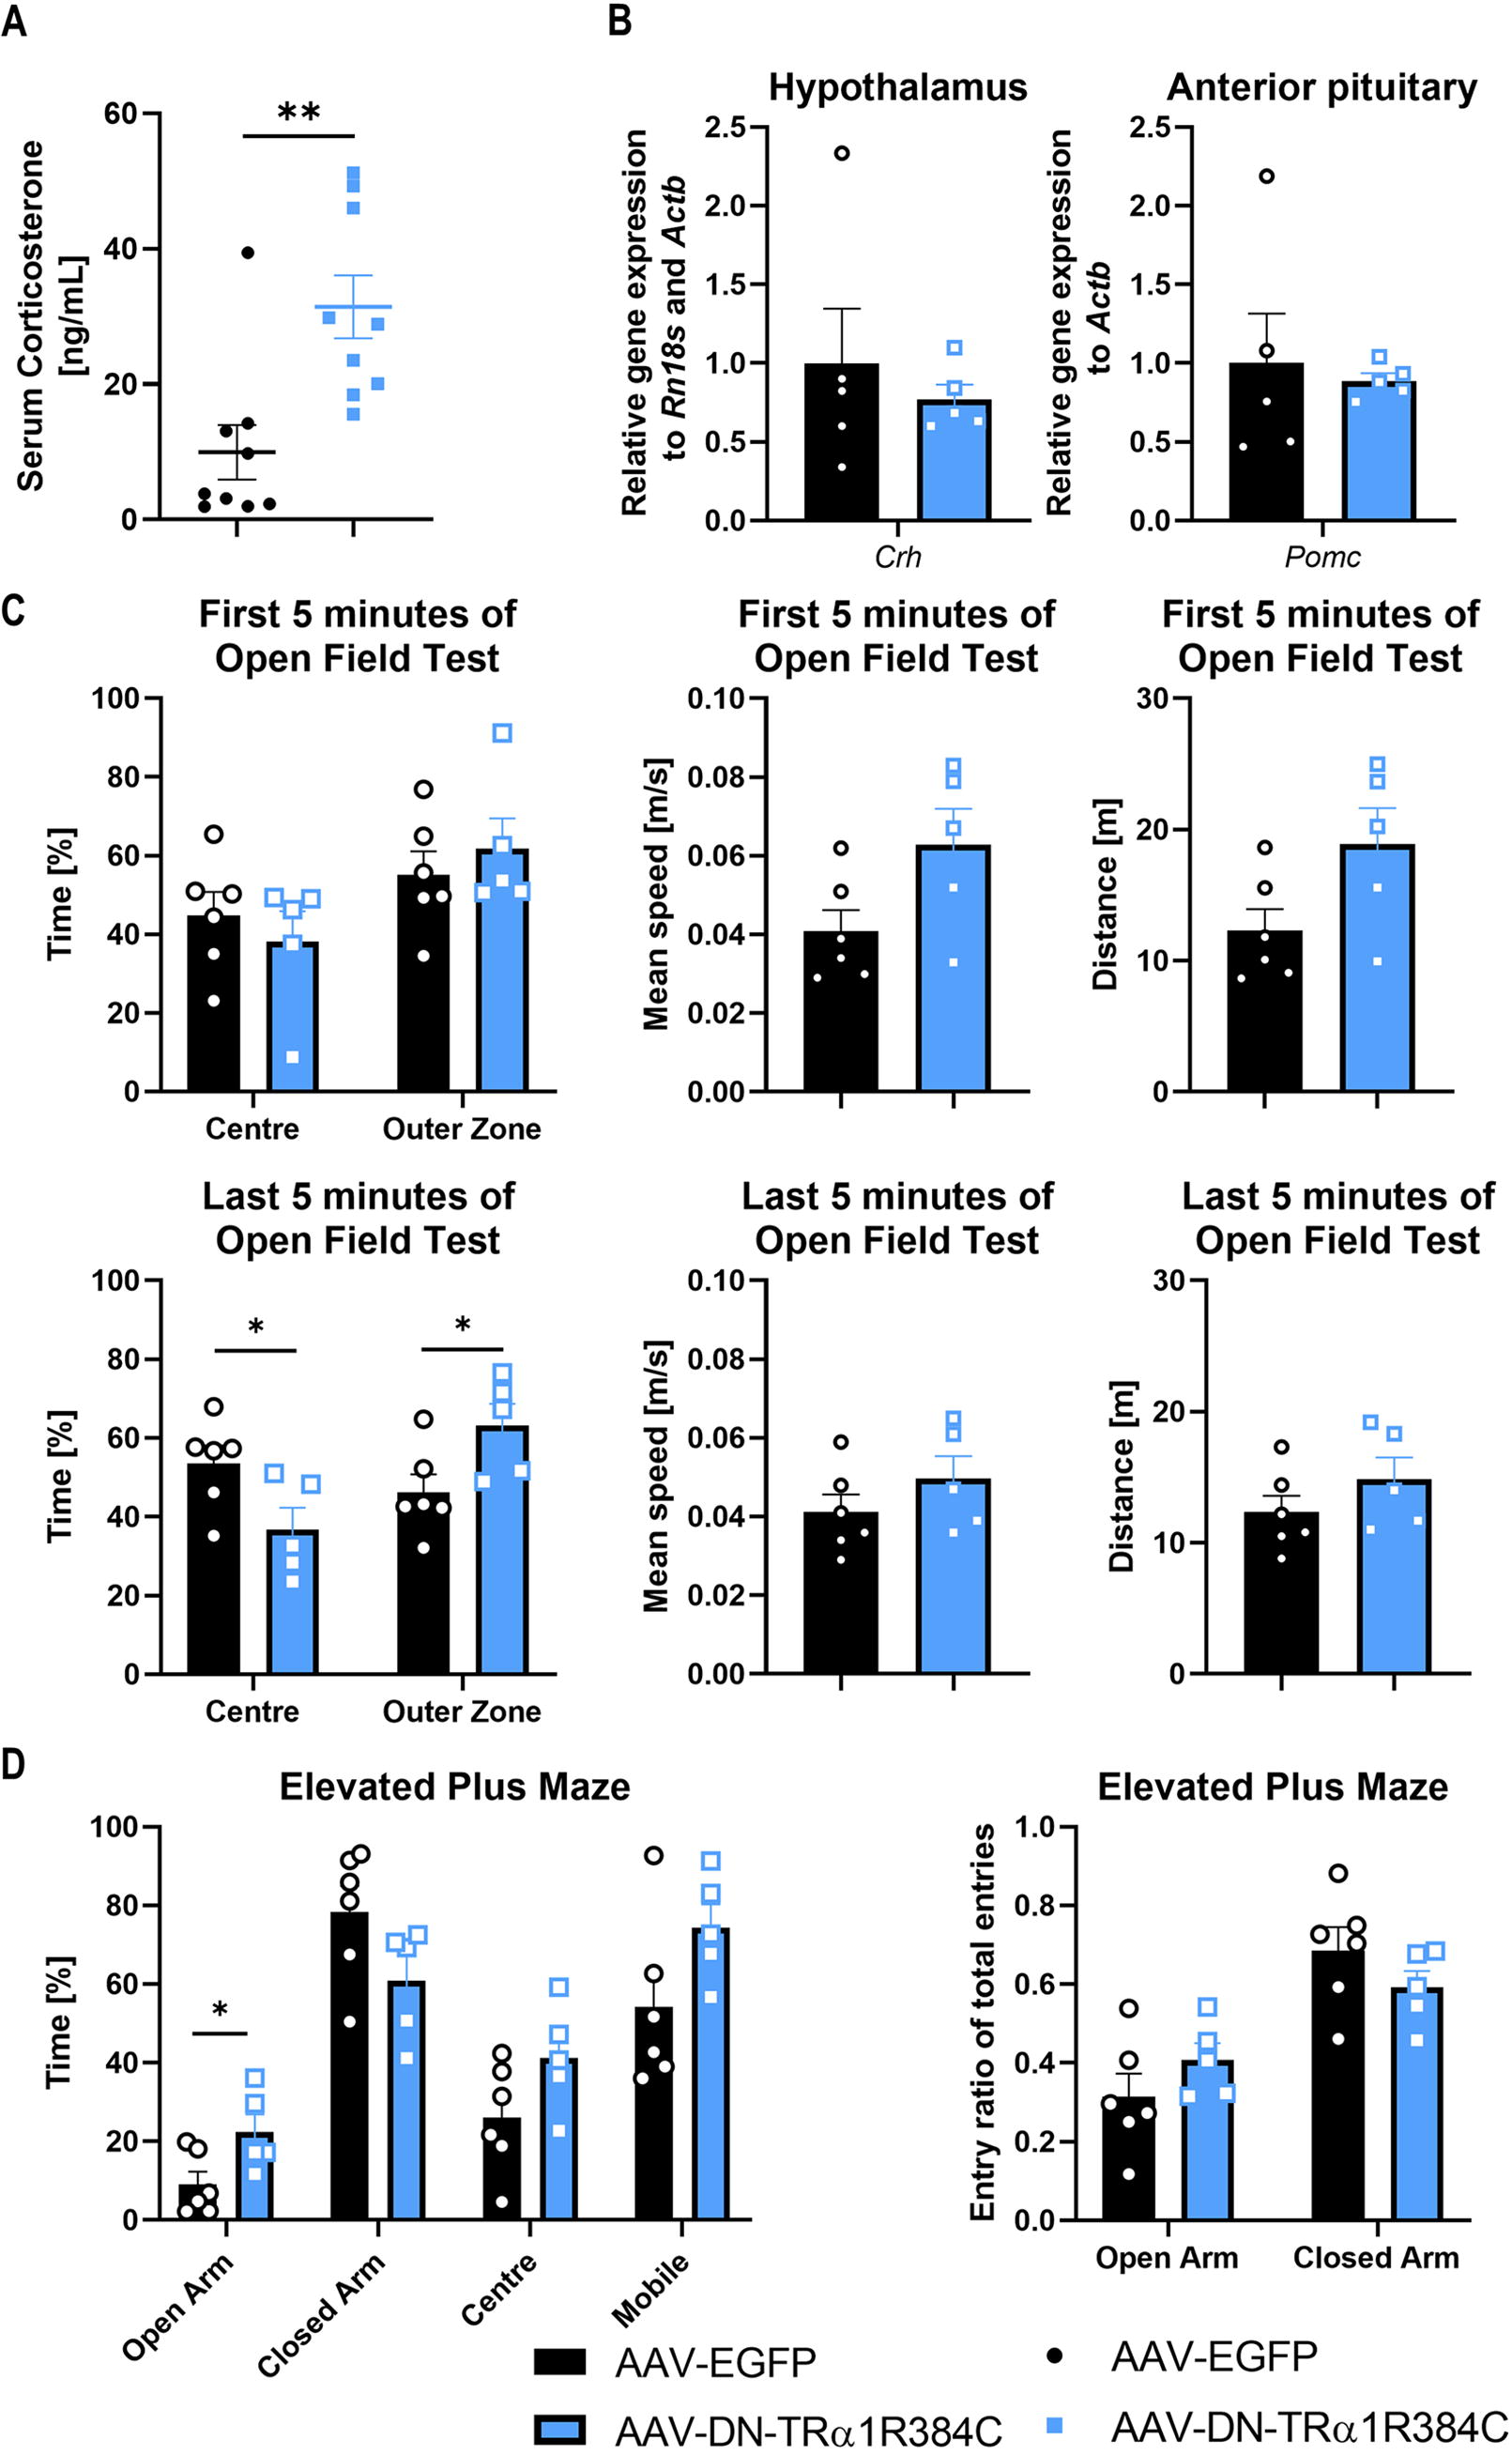
The effects of zona incerta thyroid hormone signaling on anxiety-like behavior.
Effects of TRα1 inhibition in the zona incerta are not mediated by dopaminergic neurons
To test whether dopaminergic neurons mediate the observed phenotype, we repeated the phenotyping in tyrosine hydroxylase-Cre mice and used a conditional AAV with a FLEXOn mutant TRα1R384C. Expression of mCherry and colocalization with tyrosine hydroxylase could be observed in the ZI (Supplementary Figure S3A), indicating targeting of dopaminergic neurons with about 50% transfection efficiency (Supplementary Figure S3B). The analysis revealed no change in body temperature (Supplementary Figure S3C), locomotion (Supplementary Figure S3D) or iBAT thermogenesis (Supplementary Figure S3E). Indirect calorimetry at 30°C in fasted animals revealed no difference in oxygen consumption (Supplementary Figure S3F) or body weight loss (Supplementary Figure S3G). Finally, no change in heart rate or related parameters (Supplementary Figure S3H), anxiety (Supplementary Figure S3I), or serum corticosterone was found (Supplementary Figure S3J). Taken together, these findings suggest that the observed effects of ZI TRα1 signaling are not mediated by dopaminergic neurons but rather by a different neuron population.
Discussion
Impairment in TH signaling can lead to problems in maintaining body temperature 14,33 as well as increased anxiety, 11,34 although it is not yet understood which brain regions are responsible for these effects. We aimed to identify these regions using PET scans and selective AAV-mediated inhibition of TH signaling. Our data now show that THs modulate the activity of the ZI, a still somewhat mysterious region implicated in anxiety and thermoregulation. Inhibition of TRα1 signaling in the ZI leads to increased glucocorticoid serum levels, higher energy expenditure, and mild changes in the open field test, suggesting that ZI TH signaling could affect how the brain copes with stressful situations.
The role of the zona incerta in fear and anxiety
The ZI is a grey matter region of the subthalamus, which largely consists of inhibitory neurons, but its function is still poorly understood. It has been implicated in visceral activity, as well as locomotion control, arousal, and attention. 35 More recent studies also show an involvement of the ZI in fear generalization and anxiety, 26,36 and Parkinson’s disease patients receiving deep-brain stimulation of the ZI have reported amelioration of anxiety. 37 Our findings of increased time in the outer zones of the open fields in the ZI mutant TRα1 mice support the general role of this brain region in handling anxiety 38 and stress. 39 Interestingly, our phenotype does not fully replicate classical rodent anxiety, as the elevated plus maze did not show any alterations in exploratory behavior, which was observed in other studies stimulating ZI neurons. 40,41 This is, however, in line with the observation that the effect in the open field test was limited to the second 5-minute period. This suggests that the initial exploratory behavior in a novel environment is not affected, but the animals do not habituate to the new environment as quickly as controls. 42 In contrast, mice heterozygous for the mutant TRα1 in all tissues display a severe anxiety phenotype in the open field and elevated plus maze; however, their phenotype is dominated by massive freezing and an approximate 75% reduction in total distance covered, which suggests the involvement of other brain regions implicated in motor control, e.g., cortex or cerebellum, 34 and complicates the interpretation of the behavioral assays. Nevertheless, our data suggest that TH signaling in the ZI can modulate the anxiety or stress response, but the precise effect seems to depend on the nature and duration of the stressor.
The role of the zona incerta in the endocrine stress response
Stress is closely linked to the activation of the hypothalamus-pituitary-adrenal (HPA) axis, which can facilitate the development of anxiety disorders, especially during childhood. 43 The HPA axis controls the release of corticosterone, the main glucocorticoid in rodents, from the adrenal gland. 44 Our data show that inhibition of TH signaling in the ZI induces an increase in serum corticosterone levels, which interestingly is not observed in full TRα1+m mutant mice 10 despite their strong anxiety. 34 As we did not observe any change in hypothalamic Crh or anterior pituitary Pomc expression, nor a change in glucocorticoid receptor target gene expression levels or hippocampal volumes, as marker of long-term altered glucocorticoid signaling, 45 we conclude that the elevated glucocorticoid levels are an acute phenomenon, possibly an exaggerated endocrine response, but not a permanent resetting of the entire HPA axis. 46 This is supported by the findings of elevated basal metabolic rate, as corticosterone affects pathways involved in energy metabolism 47 and high levels of glucocorticoids cause acutely increased energy expenditure in humans. 48 If the levels were elevated in the long term, as in Cushing’s syndrome, it would rather lead to the opposite phenotype, including adiposity. 49
Zona incerta in energy expenditure and body temperature regulation
Our ZI TRα1 mutant mice displayed a significant increase in oxygen consumption at 30°C during fasting conditions, which was not seen at 22°C with access to food and water. Since mice at 30°C are in their thermoneutral zone, where additional thermogenesis to maintain core body temperature is not needed, 50 this excludes any contributions of the iBAT to the phenotype. Furthermore, the fasting conditions ensure that energy is not produced by diet-induced thermogenesis. 51 Consequently, our data indicate that the increase in energy expenditure is presumably caused by muscle metabolism. The ability of THs to alter energy metabolism is well established. 5,52 THs can influence ion leakage at calcium pumps in skeletal muscle, which subsequently leads to a higher energy demand. 53,54 While our findings did not show any difference in expression of SERCA genes, Atp2a1 or Atp2a2, we observed a decrease in Sln expression in the skeletal muscle. Sln encodes sarcolipin, a protein that is an inhibitor of SERCA mediated Ca2+ flux. 55 This suggests a connection to muscle Ca2+ metabolism and could indicate an alteration of Ca2+ leakage.
That there was no significant difference in energy expenditure at 22°C is likely explained by the fact that any increase in muscle metabolism would reduce the need for additional facultative thermogenesis, 56 which leads to a net zero change in energy turnover. Although it has been shown that central TH action can alter the body temperature set point, leading to a state of pyrexia, 14 and that the hypothalamus has been identified as the responsible region, 33 our findings suggest that the ZI is not involved in the central regulation of body temperature or iBAT 27 by TRα1.
Most interestingly, the ZI TRα1 mutant animals lost significantly more weight when fasting, which can only be partially explained by the elevated energy expenditure. It is tempting to speculate that this could be caused by polyuria, as pronounced urination is a common symptom in animals with Cushing’s syndrome, 57 but this remains to be tested.
Limitations
While the initial PET study identifying the ZI used increased T3 signaling, the AAV study employed an inhibition of TR signaling. Although this is due to the fact that there is currently no genetic tool to cause elevated T3 specifically in a defined area or cell type, further PET studies on hypothyroid or TRα1+m mutant mice will be required to more tightly link these two observations. Moreover, the behavioral phenotype needs to be evaluated in greater detail, given that the open field test and the elevated plus maze did not provide a clear-cut anxiety phenotype. Here, repeated measurements will be required to not only follow the development of the phenotype after the AAV injection but also to dissect the problems in long-term habituation in greater detail, as evidenced by the difference between the first and second half of the open field experiment.
Conclusion
Taken together, our data show that inhibiting TH signaling specifically in the ZI alters how the brain responds to stress by affecting habituation behavior and the glucocorticoid response. Our data may therefore contribute to a better understanding of the clinical phenotype of hypothyroid patients, who occasionally display elevated glucocorticoid levels 58 and can develop anxiety disorders, 59 and suggest that the ZI may be partially involved in these effects.
Footnotes
Acknowledgments
We thank the Gemeinsame Tierhaltung Lübeck for animal caretaking, and Prof Paul Pfluger (Helmholtz Munich) for fruitful discussions on brain effects of glucocorticoids.
Authors’ Contributions
Julia Maier, Riccardo Dore, Rebecca Oelkrug, Annika Glatzel and Anna-Lena Cremer conducted the experiments; Julia Maier, Riccardo Dore, Rebecca Oelkrug and Sonja Binder analyzed the data; Julia Maier, Riccardo Dore, Annika Glatzel, Heiko Backes and Jens Mittag designed the study; Markus Schwaninger and Henrik Oster contributed software and animals; Julia Maier and Jens Mittag drafted the first version of the article; all authors read, corrected, and approved the final version of the article.
Author Disclosure Statement
The authors have no conflicts of interest to declare.
Funding Information
This work was funded by the German Research Council DFG (funding ID 424957847 TRR296 LocoTact to MS, HO and JM, funding ID 445465132 to JM and HB, funding ID 434396546 to RO).
Supplementary Material
Supplementary Figure S1
Supplementary Figure S2
Supplementary Figure S3