
Abstract
Background:
Previous Mendelian randomization (MR) studies showed an association between hypothyroidism and cataract and between high-normal free thyroxine (FT4) and late age-related macular degeneration (AMD), but not between FT4, thyroid stimulating hormone (TSH), or hyperthyroidism and diabetic retinopathy or cataract. These studies included a limited number of genetic variants for thyroid function and did not investigate autoimmune thyroid disease (AITD) or glaucoma, include bidirectional and multivariable MR (MVMR), and examine sex differences or potential mediation effects of diabetes. We aimed to address this knowledge gap.
Methods:
We examined the causality and directionality of the associations of AITD, and FT4 and TSH within the reference range with common age-related eye diseases (diabetic retinopathy, cataract, early and late AMD, and primary open-angle glaucoma). We conducted a bidirectional two-sample MR study utilizing publicly available genome-wide association study (GWAS) summary statistics from international consortia (ThyroidOmics, International AMD Genetics Consortium, deCODE, UK Biobank, FinnGen, and DIAGRAM). Bidirectional MR tested directionality, whereas MVMR estimated independent causal effects. Furthermore, we investigated type 1 diabetes (T1D) and type 2 diabetes (T2D) as potential mediators.
Results:
Genetic predisposition to AITD was associated with increased risk of diabetic retinopathy (p = 3 × 10⁻⁴), cataract (p = 3 × 10⁻³), and T1D (p = 1 × 10⁻³), but less likely T2D (p = 0.01). MVMR showed attenuated estimates for diabetic retinopathy and cataract when adjusting for T1D, but not T2D. We found pairwise bidirectional associations between AITD, T1D, and diabetic retinopathy. Genetic predisposition to both T1D and T2D increased the risk of diabetic retinopathy and cataract (p < 4 × 10⁻⁴). Moreover, genetically predicted higher FT4 within the reference range was associated with an increased risk of late AMD (p = 0.01), particularly in women (p = 7 × 10⁻³). However, we neither found any association between FT4 and early AMD nor between TSH and early and late AMD. No other associations were observed.
Conclusions:
Genetic predisposition to AITD is associated with risk of diabetic retinopathy and cataract, mostly mediated through increased T1D risk. Reciprocal associations between AITD, diabetic retinopathy, and T1D imply a shared autoimmune origin. The role of FT4 in AMD and potential sex discrepancies needs further investigation.
Introduction
Diabetic retinopathy, cataract, age-related macular degeneration (AMD), and glaucoma are common age-related eye diseases characterized by progressive vision impairment and blindness if left untreated. 1 Most of these eye diseases are more prevalent in women 2 and in individuals with diabetes. 3
Autoimmune thyroid disease (AITD) predominantly consists of Hashimoto’s thyroiditis, typically characterized by hypothyroidism, and Graves’ disease, typically characterized by hyperthyroidism. 4 The association between Graves’ disease and thyroid eye disease is clinically established. 5 In observational studies, hypothyroidism, 6 high free T4 (FT4) within the reference range, 7 and hyperthyroidism 6 have been associated with AMD, but the association with glaucoma is debated. 8 –10 Previous observational studies have neither investigated the association between AITD and eye diseases nor between thyroid function and diabetic retinopathy or cataract.
AITD often co-occurs with other autoimmune diseases, such as pernicious anemia 11 and type 1 diabetes (T1D). 12 Thus, we hypothesize that a possible common denominator for AITD and age-related eye diseases is T1D, and less likely type 2 diabetes (T2D), which has a smaller autoimmune component. 13
Previous Mendelian randomization (MR) studies showed an association between hypothyroidism and cataract, 14 as well as high-normal FT4 and late AMD. 15 Meanwhile, no association was found between FT4 and TSH (within the normal range), or hyperthyroidism, and diabetic retinopathy or cataract. 16 These MR studies utilized relatively small sets of genetic instruments for FT4 and thyroid-stimulating hormone (TSH). 17 We aimed to address this knowledge gap.
In the present MR study, using publicly available GWAS summary statistics from the latest genome-wide association study (GWAS) conducted within the ThyroidOmics Consortium 18 and other international consortia (International AMD Genetics Consortium [IAMDGC], deCODE, UK Biobank, FinnGen, and DIAGRAM), we examined the causality and directionality of the associations of thyroid function (thyroid disease as well as thyroid hormones within the reference range) with common age-related eye diseases (diabetic retinopathy, cataract, early and late AMD, and glaucoma). Compared to previous MR studies, novelty of our study includes: (1) two to five-fold increased sample size and consequently three- to four-fold increased number of genetic instruments for FT4 and TSH, respectively, (2) examination of additional thyroid function traits (AITD, as well as free and total triiodothyronine [FT3 and TT3], FT3/FT4 ratio and TT3/FT4 ratio, and increased or decreased TSH) and additional eye diseases (early AMD and primary open-angle glaucoma), (3) sex-stratified analyses (only available for FT4, TSH, and late AMD), (4) testing the directionality by bidirectional MR as well as MR Steiger and Steiger filtering, and (5) examining the potential mediating role of diabetes (T1D and T2D), including multivariable MR (MVMR).
Materials and Methods
MR approach with the three core assumptions is illustrated in Figure 1A, and the bidirectional methodology in Figure 1B. Beyond these core assumptions, the causal interpretation of MR estimates relies on the gene–environment equivalence assumption. This assumption asserts that changes in exposure levels will produce the same outcome effect, regardless of whether the exposure is driven by genetic variants, environmental factors, or interventions.
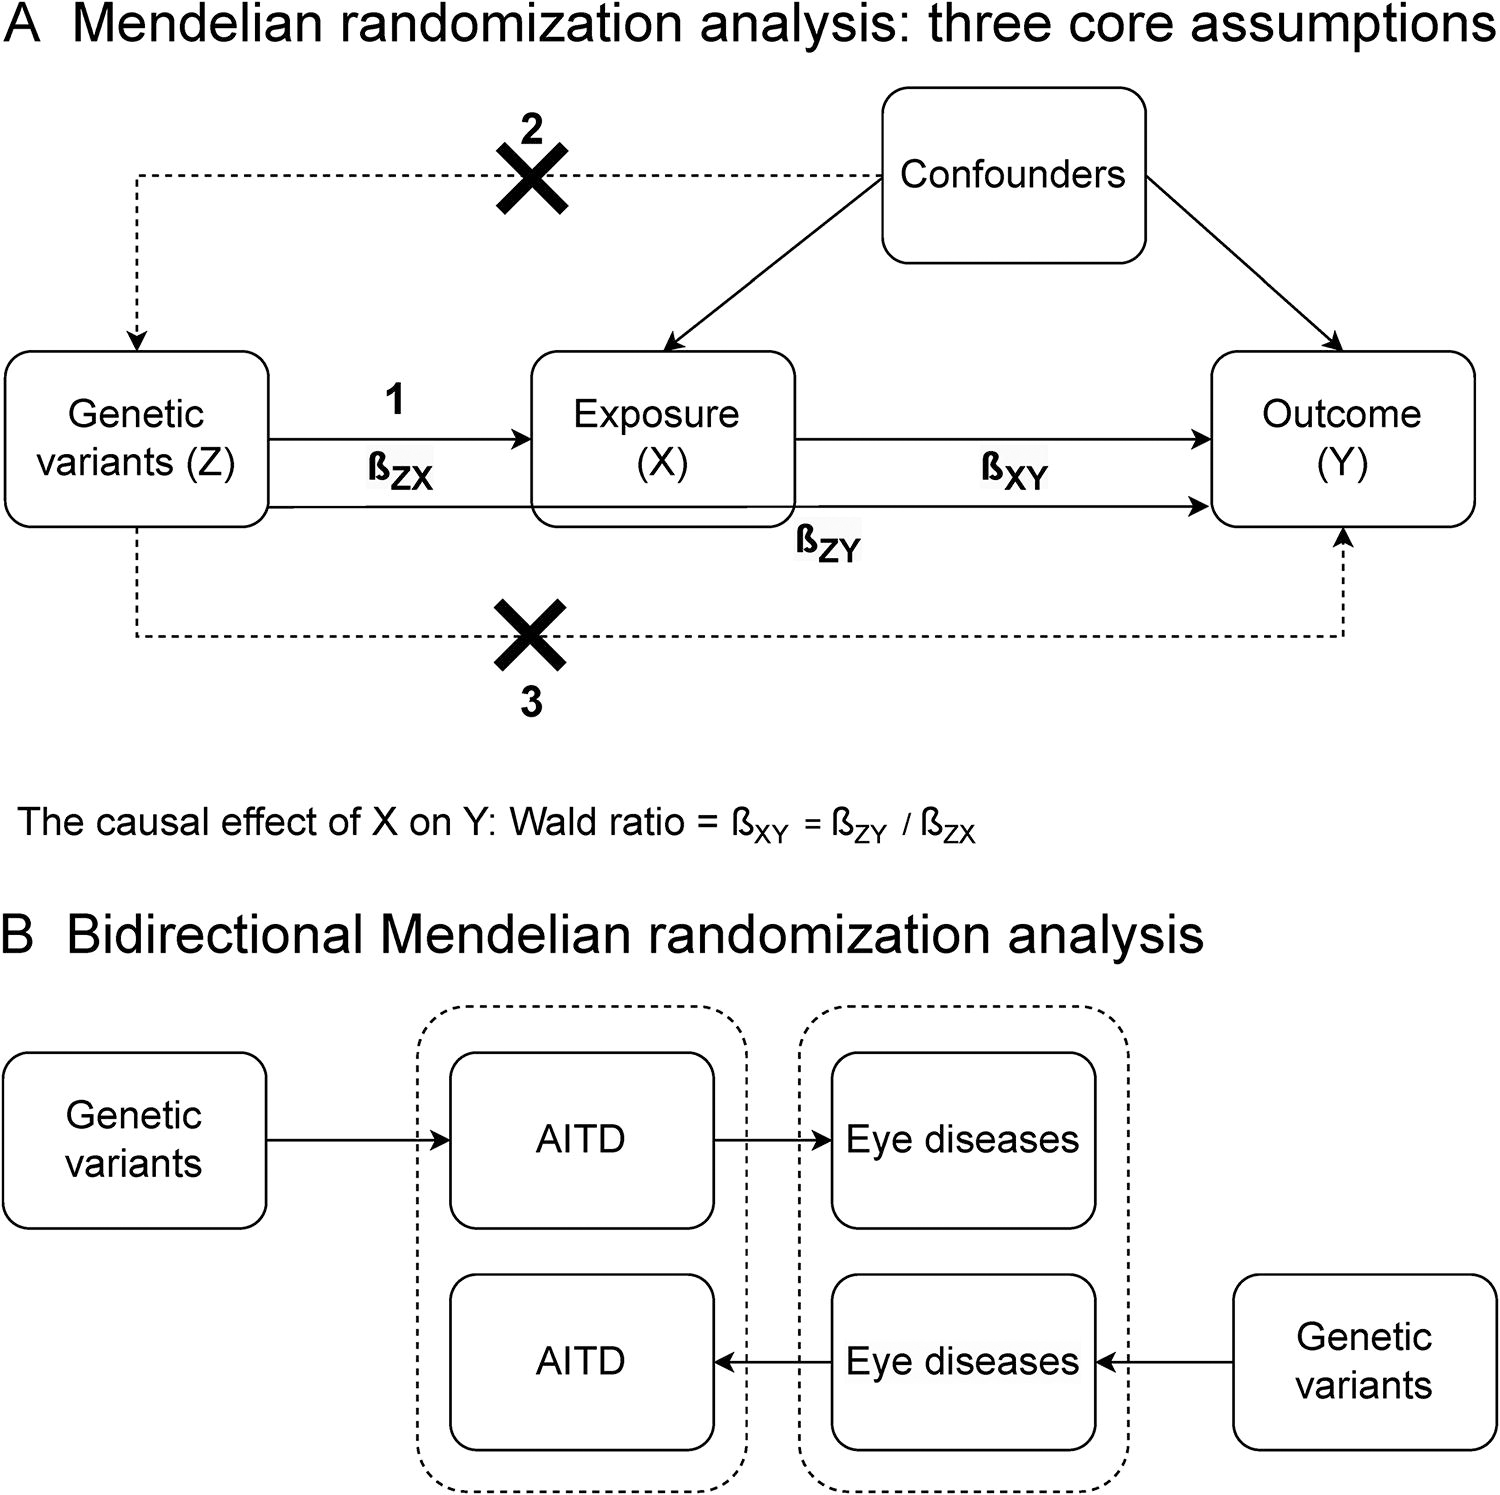
Conceptual illustration of the Mendelian randomization (MR) approach with three core assumptions
Ethics
All ethics approvals were collected by the relevant GWASs.
Identification of genetic variants associated with thyroid function
The genetic variants associated with thyroid function were identified as top independent genetic variants reported in the main or supplementary tables of the published GWASs (Supplementary Table S1). Furthermore, we restricted genetic variants to autosomal (not on X-chromosome) single nucleotide polymorphisms (SNPs) that were associated with the relevant trait/disease at GWAS significance level (p ≤ 5 × 10⁻⁸), and had an F-statistic of at least 10, indicating sufficient instrument strength. 19
Briefly, for the main analyses, we used the largest and most recent ThyroidOmics Consortium GWAS on FT4, TSH, FT3, TT3, FT3/FT4 ratio, and TT3/FT4 ratio (for which TSH was within the cohort-specific reference range), 18 TSH outside the cohort-specific reference range (indicating hypo- and hyperthyroidism), 18 as well as deCODE GWAS on AITD 4 (Supplementary Table S1). AITD was based on International Classification of Diseases version 10 (ICD-10) codes E06.3 (Hashimoto’s thyroiditis), E05.9 (Graves’ disease), E03.9 (other unspecified hypothyroidism), and/or thyroxine treatment, excluding known nonautoimmune causes of hypothyroidism, and consisted therefore predominantly of hypothyroidism. We did not investigate Graves’ disease or Hashimoto’s thyroiditis separately due to the lack of sufficiently powered GWASs. The variance explained (R 2) by the GWAS SNPs was 14.1% for TSH, 6.0% 18 for FT4, and 8.0% for AITD. 4
In supplementary analyses, we used a smaller, but sex-stratified ThyroidOmics Consortium GWAS on FT4 and TSH levels within the cohort-specific reference range 17 as well as a GWAS of UK Biobank and FinnGen on hypothyroidism (Supplementary Table S1). 20 The latter was based on ICD-10 code E03 (other hypothyroidism) and/or thyroxine treatment, thus including nonautoimmune causes of hypothyroidism.
Age-related eye diseases
For the main analyses, we employed FinnGen for diabetic retinopathy (ICD-10 code H36) and senile cataract (ICD-10 code H25), 21 the International AMD Genetics Consortium (IAMDGC) for early AMD, 22 and late AMD, 23 and a European meta-GWAS excluding UK Biobank participants for primary open-angle glaucoma (ICD-10 code H40.1) 24 (Supplementary Table S1). AMD phenotyping was ascertained differently in the participating cohorts, but briefly, early AMD only included early stages of AMD 22 while late AMD included intermediate or advanced AMD. 23
In supplementary analyses, we utilized FinnGen for proliferative (subtype of) diabetic retinopathy, 21 IAMDGC for late AMD stratified by sex, 25 a meta-GWAS of FinnGen and UK Biobank for cataract, 26 and a European meta-GWAS including UK Biobank for primary open-angle glaucoma. 24
Diabetes
In the main analyses, we used GWAS datasets without UK Biobank participants for T1D 21 and T2D. 27 This approach aimed to avoid (UK Biobank) participant overlap with the GWASs for AITD and early AMD. However, to increase power, in supplementary analyses, GWAS datasets included UK Biobank participants. 27,28
Statistical analysis
Analyses were performed in R version 4.2.3. using TwoSampleMR, 29,30 MendelianRandomization, 31 and CAUSE packages. 32
A strict Bonferroni correction is likely overly conservative as the thyroid traits are correlated and the eye diseases are not completely independent of each other. We therefore used a less strict, but a pragmatic a priori p-value significance threshold of p < 0.005. Most important, however, we did not rely solely on p-values as evidence of an association. Instead, we evaluated each result based on effect size, standard error (SE), biological plausibility, and consistency across exposures, outcomes, and main and sensitivity analyses. For each SNP, the effect allele was defined as the allele associated with increase in the relevant exposure (Supplementary Table S2). For all outcomes, we extracted summary statistics for the relevant exposure SNPs and aligned the effect to the effect allele (data harmonization). This excluded inconsistent and palindromic SNPs with effect allele frequencies close to 50%. Summary statistics (β-coefficient or log-odds, SE, p value, effect allele, other allele, and effect allele frequency) for all SNPs associated with thyroid function are shown in Supplementary Table S2. Instrument strength was assessed as F-statistics and calculated using t-statistics approach as β 2/SE 2.
TSH, FT4, FT3, and TT3 were inverse normal transformed, whereas ratios were natural log-transformed prior to analyses. Since not all SNPs were present in all GWASs, the numbers of SNPs across MR analyses vary slightly.
Causal estimates for each exposure-outcome combination were derived by meta-analyzing individual causal estimates, computed as Wald ratios of the SNP-outcome and SNP-exposure associations for each SNP.
The main analysis was the inverse variance weighted (IVW) multiplicative random-effects meta-analysis. 33 Heterogeneity was assessed using Cochran’s Q and the corresponding I 2 index (range: 0%−100%, higher I 2 indicating greater heterogeneity). 34 We opted for a random-effects model due to its conservative nature compared to fixed-effects models, particularly as heterogeneity increases. However, since the IVW model assumes all SNPs are valid instruments, sensitivity analyses were conducted using MR-Lasso, weighted median MR, and MR-Egger regression methods. 33
MR-Lasso uses Lasso regression to identify and remove invalid SNPs by adding a penalty term to the causal effect estimator, which shrinks the regression coefficient towards zero and forces coefficients of individual SNPs to be zero. 35 The WM estimate represents the median of the inverse-variance weighted empirical distribution function of Wald ratio estimates, relaxing the first MR assumption by assuming at least 50% of the weight from genetic variants originates from valid instruments. 36 Although causal estimates are derived from the slopes of linear regressions between SNP-outcome and SNP-exposure associations, only the MR-Egger regression line is not constrained to zero. The MR-Egger intercept, along with its corresponding p value for testing intercept = 0, serves as an indicator of the average pleiotropic effect across all SNPs. 37 Additionally, we evaluated the extent of the NOME (NO Measurement Error in the SNP-exposure associations) violation utilizing I2 GX (range: 0%−100%, where lower values indicate higher risk of NOME violation potentially leading to regression dilution bias). A strong violation of the NOME assumption typically stems from weak instruments and can bias the causal effect estimate towards zero.
Directionality was assessed using bidirectional MR, Steiger filtering, and MR Steiger. Steiger filtering removes genetic variants where the exposure doesn’t explain more variance than the outcome, whereas MR Steiger considers all variants and confirms causality if the exposure explains more variance than the outcome collectively. 29
Since the MR method estimates the total causal effects, we performed (IVW-based) MVMR to assess the direct (independent) causal effects of AITD on diabetic retinopathy and cataract. 38 We performed three MVMR analyses for each of the two outcomes, taking into account (i.e., adjusting for): 1) T1D only (MVMR, +T1D), 2) T2D only (MVMR, +T2D), and 3) both T1D and T2D (MVMR, +T1D+T2D).
We designate “genetic predisposition” for binary exposures such as thyroid and eye diseases, and “genetically predicted” for continuous exposures such as thyroid hormone levels and ratios. It’s crucial to note that the clinical utility of the causal estimates is limited, 39 especially for binary exposures, as they can only assess the causal null hypothesis through 95% confidence intervals and p-values. 40 This is why we, for binary exposures, only provide p-values under the Results section.
We performed a post hoc MR Causal Analysis Using Summary Effect estimates (MR-CAUSE) to further assess correlated pleiotropy and bias in the association between AITD, T1D, and diabetic retinopathy, and AITD, T1D, and cataract. MR-CAUSE stands out from other MR methods by utilizing a substantially larger number of variants to test causality, comparing whether the causal model is notably better than the sharing model. 32
Results
Thyroid dysfunction and eye diseases
Genetic predisposition to AITD was associated with increased risk of diabetic retinopathy in main IVW analysis (p = 3 × 10⁻⁴, Fig. 2A) and all sensitivity MR analyses before and after Steiger filtering (all p < 2 × 10⁻³, Supplementary Tables S3 and S4). Between SNP heterogeneity was high (I 2 = 55%, Supplementary Table S3). There was some evidence of directional pleiotropy (Egger intercept: PEgger = 5 × 10⁻⁴), but low risk of NOME violation (I2 GX = 94%, Supplementary Table S3). All supplementary analyses including hypothyroidism and proliferative diabetic retinopathy were concordant (all p < 2 × 10⁻³, Supplementary Tables S3 and S4).
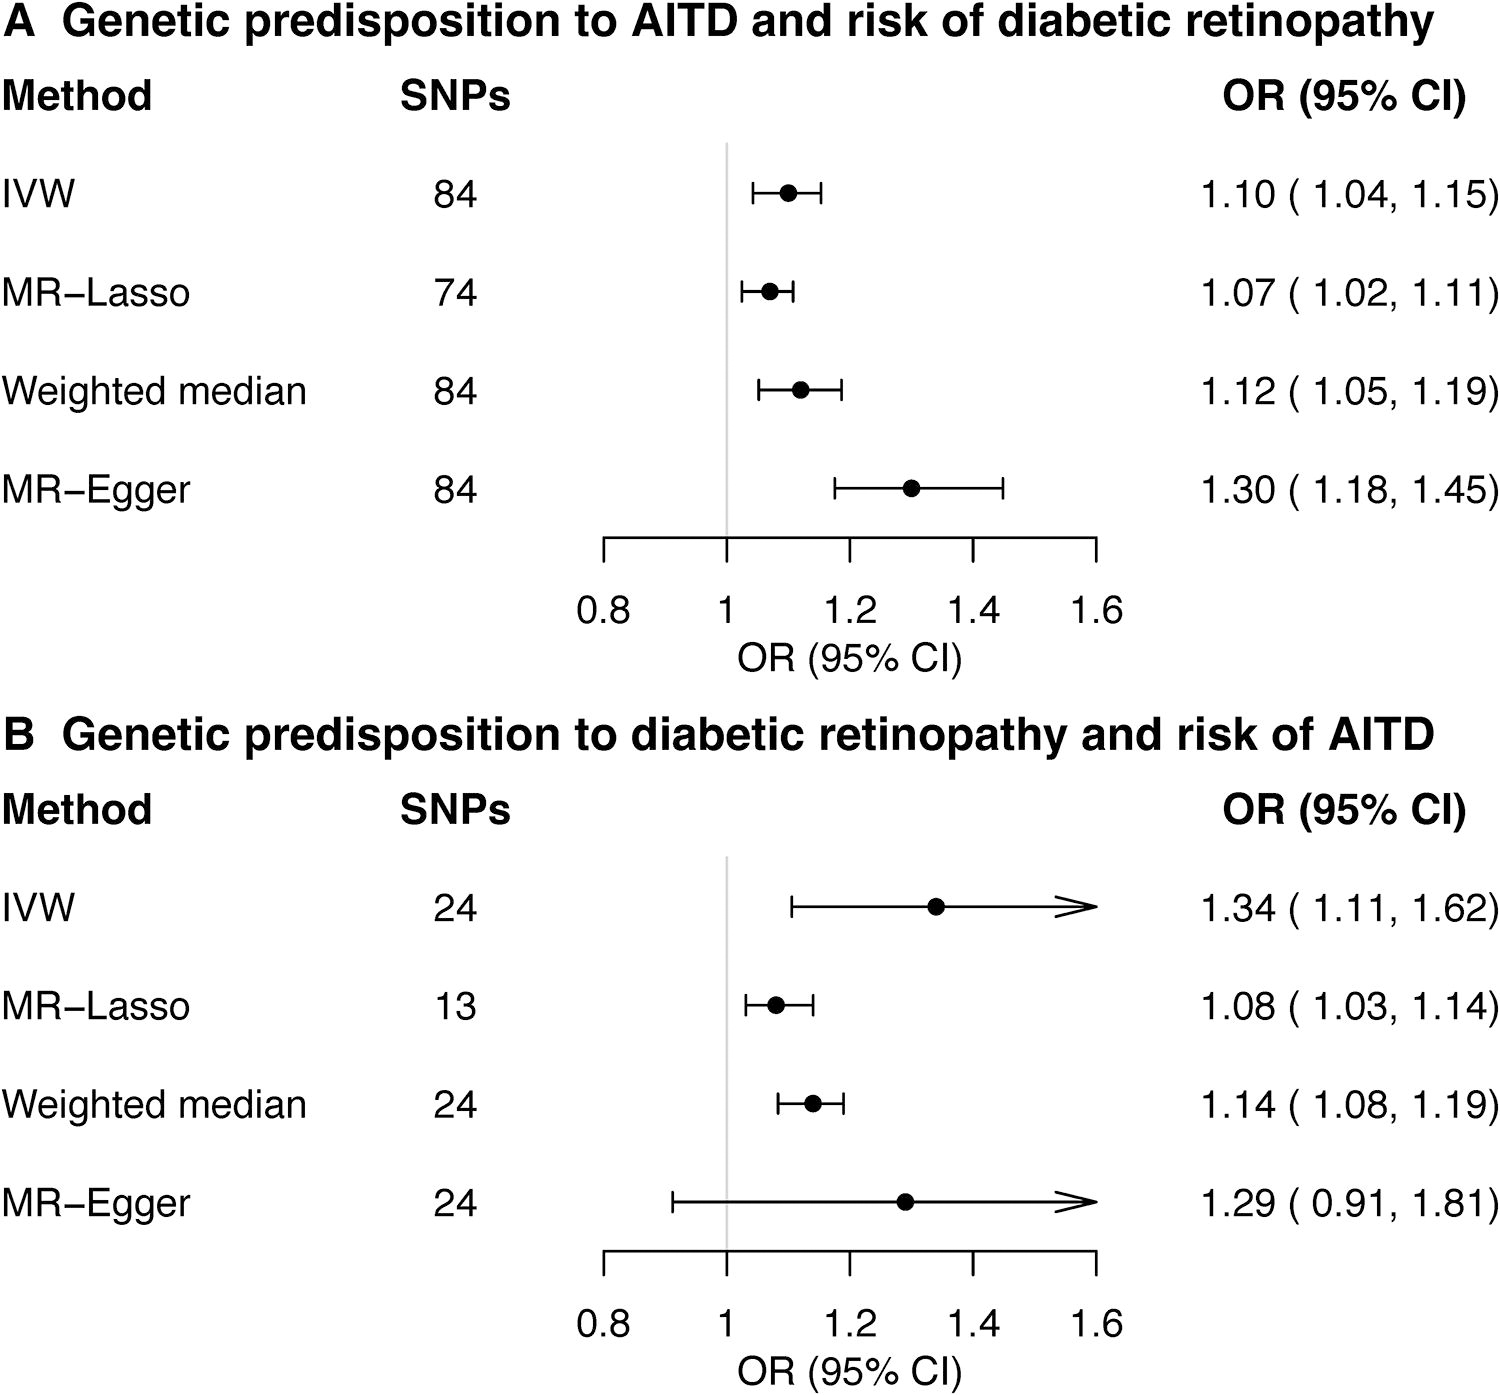
Bidirectional Mendelian randomization (MR) analyses between autoimmune thyroid disease (AITD) and diabetic retinopathy. Estimates (odds ratios [ORs] and 95% confidence intervals [CIs]) from the main random-effects inverse variance weighted (IVW), and sensitivity MR analyses (MR-Lasso, weighted median, and MR-Egger) are expressed as ORs for genetic predisposition to the relevant exposure. Note that the estimate sizes do not have a clear interpretation and can only be used to assess the null hypothesis (see Materials and Methods). For each exposure and method, the number of single nucleotide polymorphisms (SNPs) included in the analysis is shown in parenthesis. AITD included 30,234 cases and 755,172 controls from Iceland and UK Biobank (deCODE Consortium) and was based on ICD-10 codes E06.3 (Hashimoto’s thyroiditis), E05.9 (Graves’ disease), E03.9 (other unspecified hypothyroidism) and/or thyroxine treatment, excluding known nonautoimmune causes of hypothyroidism, and consisted therefore predominantly of hypothyroidism. Diabetic retinopathy included 14,584 cases and 202,082 controls from Finland (FinnGen Consortium). Additional sensitivity statistics are shown in Supplementary Tables S3 and S4.
In the bidirectional MR, genetic predisposition to diabetic retinopathy was associated with increased risk of AITD in main IVW analysis (p = 3 × 10⁻³, Fig. 2B), in MR-LASSO and in weighted median, but not in MR-Egger sensitivity MR analyses (Supplementary Table S5). Between SNP heterogeneity was extremely high (I 2 = 98%, Supplementary Table S5). There was no evidence of directional pleiotropy (PEgger = 0.78), and low risk of NOME violation (I2 GX = 97%). Steiger filtering and supplementary analyses (of hypothyroidism and proliferative diabetic retinopathy) generated largely concordant results (Supplementary Tables S5 and S6).
Genetic predisposition to AITD was associated with increased risk of cataract in main IVW analysis (p = 3 × 10⁻³, Fig. 3A, Supplementary Table S3), in MR-LASSO and MR-Egger, before and after Steiger filtering, but not in weighted median MR analysis (Supplementary Tables S3 and S4). Between SNP heterogeneity was low (I 2 = 11%, Supplementary Table S3). There was no evidence of directional pleiotropy (PEgger = 0.07) or NOME violation (I2 GX = 94%). Supplementary analyses of hypothyroidism and cataract were similar, but less robust (Supplementary Tables S3 and S4).

Bidirectional Mendelian randomization (MR) analyses between autoimmune thyroid disease (AITD) and cataract. Estimates (odds ratios [ORs] and 95% confidence intervals [CIs]) from the main random-effects inverse variance weighted (IVW), and sensitivity MR analyses (MR-Lasso, weighted median and MR-Egger) are expressed as ORs for genetic predisposition to the relevant exposure. Note that the estimate sizes do not have a clear interpretation and can only be used to assess the null hypothesis (see Materials and Methods). For each exposure and method, the number of single nucleotide polymorphisms (SNPs) included in the analysis is shown in parenthesis. AITD included 30,234 cases and 755,172 controls from Iceland and UK Biobank (deCODE Consortium) and was based on ICD-10 codes E06.3 (Hashimoto’s thyroiditis), E05.9 (Graves’ disease), E03.9 (other unspecified hypothyroidism), and/or thyroxine treatment, excluding known non-autoimmune causes of hypothyroidism, and consisted therefore predominantly of hypothyroidism. Cataract included 26,758 cases and 189,604 controls from Finland (FinnGen consortium). Additional sensitivity statistics are shown in Supplementary Tables S5 and S6.
In the bidirectional MR, genetic predisposition to cataract was not associated with risk of AITD (Fig. 3B, Supplementary Tables S5 and S6).
The MR-CAUSE results for the association between AITD and cataract indicate that the causal model is not significantly better than the sharing model (p = 0.29).
Genetic predisposition to AITD was not associated with (early or late) AMD or glaucoma (all p > 0.10, Supplementary Tables S3 and S4). We found no association between genetically predicted TSH outside the reference range (increased or decreased) and risk of any eye diseases (Supplementary Tables S3 and S4).
Diabetes as a mediator of the AITD association with diabetic retinopathy and cataract
MVMR analyses showed that adjusting for T1D, but not for T2D, attenuated the effects of AITD on the risk of diabetic retinopathy and cataract towards null (Fig. 4, Supplementary Table S7). Pairwise associations between AITD, T1D, and diabetic retinopathy were bidirectional (Figs. 2, 4, and 5, Supplementary Tables S3 and S4, Table S8–S11). In fact, AITD SNPs explained more variation in T1D (r 2 = 4.2%) than in AITD (r 2 = 3.8%) which is why MR Steiger evaluated the direction as false (Supplementary Table S8), and Steiger filtering abrogated the estimates (Supplementary Table S9). Finally, we found no robust evidence of an association between genetically predicted AITD and T2D (Supplementary Tables S8–S11). Collectively, this suggests a shared autoimmune genetic cause underlying AITD and T1D that may explain the apparent association between AITD and diabetic retinopathy.
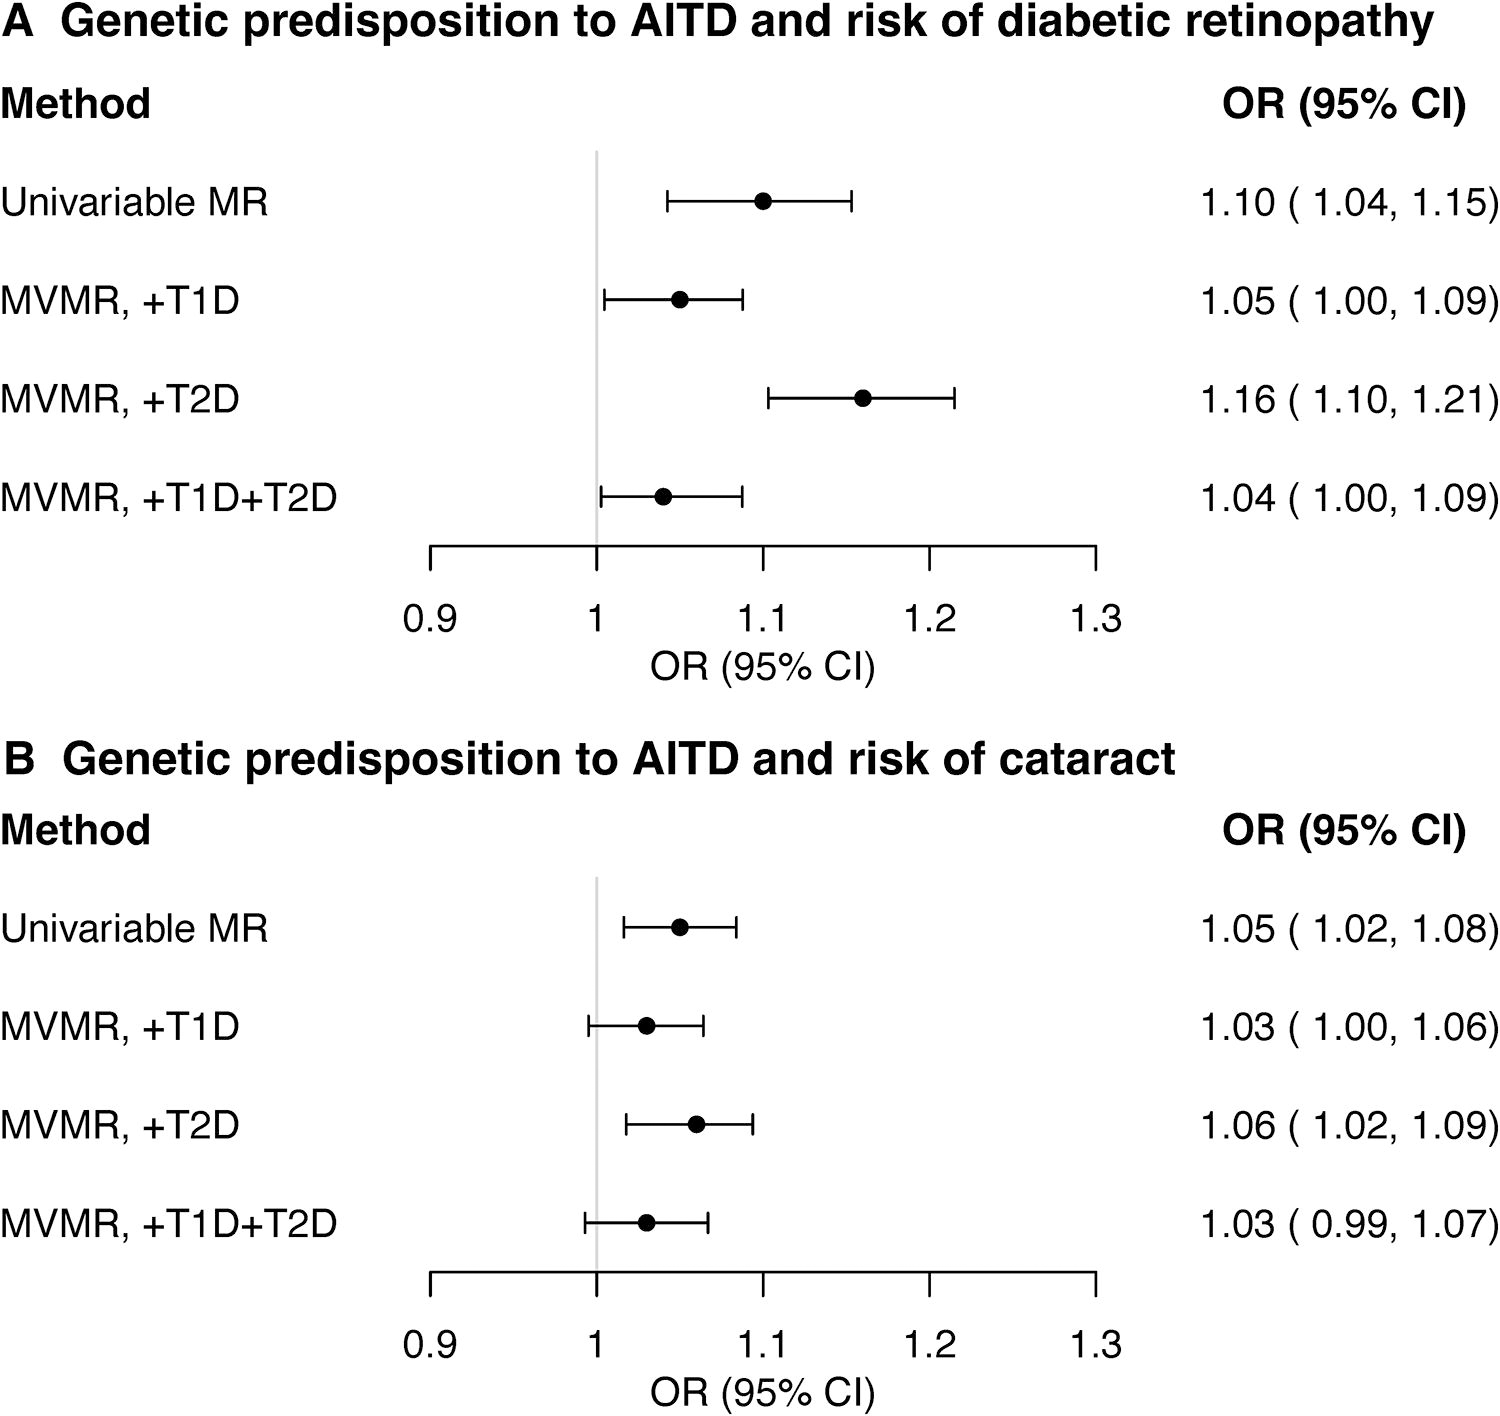
Multivariable Mendelian randomization (MVMR) analyses between autoimmune thyroid disease (AITD), diabetic retinopathy, and cataract. Estimates (odds ratios [ORs] and 95% confidence intervals [CIs]) are based on the inverse variance weighted MR method and expressed as ORs for genetic predisposition to the relevant exposure. Note that the estimate sizes do not have a clear interpretation and can only be used to assess the null hypothesis (see Materials and Methods). MVMR estimated the independent (adjusted) causal effects of AITD on diabetic retinopathy and cataract when adjusted for: type 1 diabetes (MVMR, +T1D), type 2 diabetes (MVMR, +T2D), or both T1D and T2D (MVMR, +T1D+T2D). For each exposure and method, the number of single nucleotide polymorphisms (SNPs) included in the analysis is shown in parenthesis. AITD included 30,234 cases and 755,172 controls from Iceland and UK Biobank (deCODE Consortium) and was based on ICD-10 codes E06.3 (Hashimoto’s thyroiditis), E05.9 (Graves’ disease), E03.9 (other unspecified hypothyroidism) and/or thyroxine treatment, excluding known nonautoimmune causes of hypothyroidism, and consisted therefore predominantly of hypothyroidism.Diabetic retinopathy (14,584 cases and 202,082 controls) and cataract (26,758 cases and 189,604 controls) were from Finland (FinnGen Consortium). Corresponding MVMR estimates for T1D and T2D are shown in Supplementary Table S7.
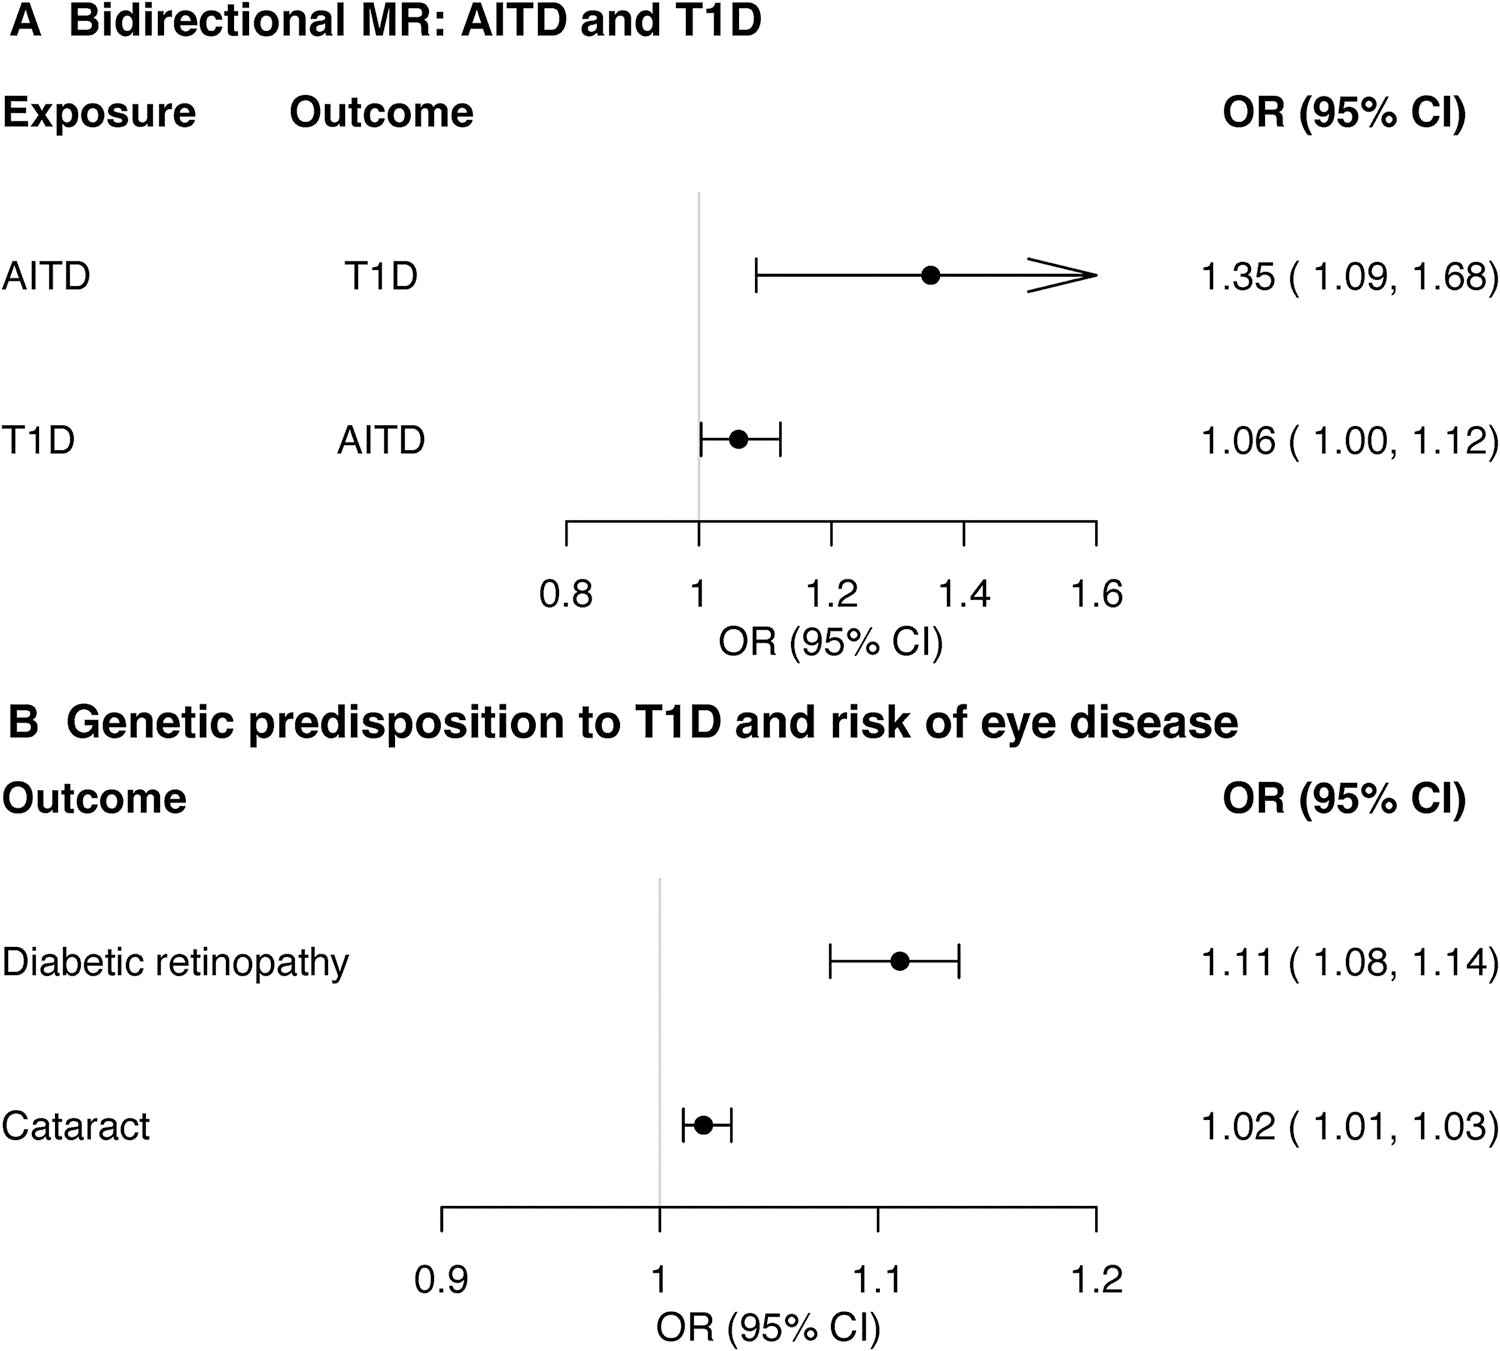
Type 1 diabetes (T1D) as a mediator of the autoimmune thyroid disease (AITD) association with diabetic retinopathy and cataract. Estimates (odds ratios [ORs] and 95% confidence intervals [CIs]) are based on the random-effects inverse variance weighted MR method and expressed as ORs for genetic predisposition to the relevant exposure. Note that the estimate sizes do not have a clear interpretation and can only be used to assess the null hypothesis (see Materials and Methods). AITD included 30,234 cases and 755,172 controls from Iceland and UK Biobank (deCODE Consortium) and was based on ICD-10 codes E06.3 (Hashimoto’s thyroiditis), E05.9 (Graves’ disease), E03.9 (other unspecified hypothyroidism), and/or thyroxine treatment, excluding known nonautoimmune causes of hypothyroidism, and consisted therefore predominantly of hypothyroidism. T1D included 7467 cases and 10,218 controls of European ancestry, and did not include UK Biobank participants. Diabetic retinopathy (14,584 cases and 202,082 controls) and cataract (26,758 cases and 189,604 controls) were from Finland (FinnGen Consortium). Additional sensitivity statistics (including type 2 diabetes) are shown in Supplementary Tables S3, S4, Table and Table S8–S11.
Diabetes and common age-related eye diseases
Genetic predisposition to T1D, as well as T2D, was associated with an increased risk of not only diabetic retinopathy but also cataract (Figs. 4 and 5, Supplementary Tables S10 and S11). Neither diabetes type was associated with a risk of (early or late) AMD (Supplementary Tables S10 and S11). Genetic predisposition to T2D, but not to T1D, may be associated with an increased risk of glaucoma (p = 0.07, Supplementary Tables S10 and S11). Finally, bidirectional analyses showed no association between common age-related eye diseases and either diabetes type (Supplementary Tables S8 and S9).
The euthyroid state and common age-related eye diseases
Genetically predicted higher FT4 (within the reference range) was nominally associated with increased risk of late AMD in main IVW (p = 0.01, Fig. 6A, Supplementary Table S3) and in MR-Lasso analyses, before and after Steiger filtering, but not in weighted median MR and MR-Egger analyses (Supplementary Tables S3 and S4). Between-SNP heterogeneity was moderate (I 2 = 33%, Supplementary Table S3). There was no evidence of directional pleiotropy (PEgger = 0.69) or NOME violation (I2 GX = 93%). Supplementary analyses (using a smaller, but sex-stratified GWAS for FT4) generated similar but imprecise estimates (p > 0.05, Supplementary Tables S3 and S4), which were largely driven by the association in women (p = 7 × 10⁻³) rather than in men (p = 0.32, Supplementary Table S12, Fig. 6A). Although the estimates for TSH and early and late AMD were directionally consistent (Fig. 6B, Supplementary Tables S3, S4, Table and S12), the estimates for FT4 and early AMD were not (Supplementary Tables S3 and S4).

Mendelian randomization (MR) estimates for the association of genetically predicted thyroid hormone levels with the risk of late age-related macular degeneration (AMD). Estimates (odds ratios [ORs] and 95% confidence intervals [CIs]) are based on the inverse variance weighted MR method and expressed as ORs per one standard deviation increase in the relevant exposure. For each exposure, the number of single nucleotide polymorphisms (SNPs) included in the analysis is shown in parenthesis. Thyroid hormone levels were from the ThyroidOmics Consortium and included individuals with measurements of free thyroxine (FT4) and thyroid stimulating hormone (TSH) within the (cohort-specific) reference range. FT4, all* was measured in up to 119,120 and TSH, all* in up to 271,040 individuals. However, sex-stratified summary statistics on FT4 and TSH levels were only available in a smaller subset of these individuals (FT4, all: 49,269; FT4, women: 26,954; FT4, men: 22,315; TSH, all: 54,288; TSH, women: 29,670; TSH, men: 24,618). AITD included 30,234 cases and 755,172 controls from Iceland and UK Biobank (deCODE Consortium) and was based on ICD-10 codes E06.3 (Hashimoto’s thyroiditis), E05.9 (Graves’ disease), E03.9 (other unspecified hypothyroidism) and/or thyroxine treatment, excluding known nonautoimmune causes of hypothyroidism, and consisted therefore predominantly of hypothyroidism. Additional sensitivity statistics are shown in Supplementary Tables S3, S4, Table and S12.
Bidirectional MR, sex-combined and sex-stratified, showed no associations between genetic predisposition to late AMD and FT4 levels (data not shown). We found no association between other thyroid function traits (FT3, TT3, FT3/FT4 ratio, TT3/FT4 ratio) and risk of common age-related eye diseases (Supplementary Tables S3 and S4).
Discussion
Our MR study shows that the association between AITD and diabetic retinopathy and cataract is primarily mediated via T1D. Conversely, when it comes to cataract, T2D is a stronger risk factor than T1D. Furthermore, only T2D, and not T1D, is a risk factor for glaucoma. The reciprocal associations between AITD, diabetic retinopathy, and T1D suggest a common autoimmune origin. Moreover, genetically predicted higher FT4 levels within the normal range may increase the risk of late AMD, particularly in women. These are novel findings.
It is important to emphasize that the common autoimmune origin of AITD and diabetic retinopathy introduces correlated pleiotropy, which violates the second and third core MR assumptions (Fig. 1). Consequently, the genetic variants are no longer valid instruments, leading to biased and invalid causal inferences in MR studies. Indeed, MR-CAUSE was the only MR method that did not support a causal role of AITD in diabetic retinopathy and cataract.
MVMR analyses showed that T1D, but not T2D, played a mediating role in linking AITD to diabetic retinopathy and cataract. This finding aligns with clinical studies, which consistently found a stronger link between autoimmune diabetes types (like T1D and latent autoimmune diabetes of adults) and the risk of diabetic retinopathy, compared to lifestyle-related diabetes (T2D). 41,42
While various autoimmune and systemic diseases are known to increase the risk of cataract, 43 this is the first study linking AITD with cataract. Most important, however, this was largely due to diabetes. Since AITD and T1D were bidirectionally associated, and genetic predisposition to T1D was also associated with cataract, it is likely that T1D rather than AITD impairs glucose homeostasis leading to cataract. 44,45 Furthermore, T2D was a stronger risk factor for cataract than T1D. Previous MR studies on the association between T2D and cataract showed conflicting results. Although one study was concordant with ours, 46 two others found no association, 47,48 possibly due to a substantially smaller sample size in cases with cataract (5045 versus 26,758–39,519 in our study) 47 or T2D (19,119 versus 55,005–80,154 in our study). 48
In accordance with a previous MR study, we found that genetically predicted higher FT4 (within normal range) was associated with late AMD. 15 As a novel discovery, we found that this association was predominantly evident in women. Nevertheless, these may be chance findings, as we did not observe any associations between FT4 and early AMD, nor between other thyroid function traits and either early or late AMD. Although thyroid hormones appear to play a role in the pathogenesis of AMD in animal, 49,50 observational, 6,7,51 and possibly MR studies, 15 the exact biological mechanisms underlying FT4’s involvement in the onset and progression of AMD are unclear.
We found no association between AITD and thyroid function with glaucoma, which contradicts a prior observational link between hypothyroidism and glaucoma. 9 However, in our study, the lack of association between AITD and glaucoma was consistent with the lack of association between T1D and glaucoma. This suggests that autoimmunity does not play a major role in the development of glaucoma. Most important, in concordance with a previous MR study, 52 we did find that T2D, unlike T1D, was associated with increased glaucoma risk. This likely explains why we found no association between AITD and glaucoma.
This MR study is the most comprehensive to date on the relationship between thyroid function and common age-related eye diseases. It stands out for its significantly larger sample sizes, exploration of additional thyroid function traits and eye diseases, sex-stratified analyses, verification of directionality, and examination of diabetes as a potential mediator. The proportion of variance explains 8.0% for AITD, 4 14.1% for TSH, and 6.0% for FT4, 18 which could reduce the statistical power. 39 As a comparison, the variance explained is only 3% for more than 400 variants identified for BMI. 53
Although the AITD SNPs showed a moderate correlation with both Hashimoto’s and Graves’ disease, 4 the absence of large-scale GWAS publications for these two autoimmune diseases individually prevented us from distinguishing the genetic effects specific to the distinct AITDs. Consequently, there is a clear need for large-scale GWASs to be conducted separately for each AITD subgroup. Given that our findings are applicable solely to European populations, it is essential to validate these results across different ethnic groups. Additionally, we lacked sex-stratified GWASs for AITD, hypothyroidism, thyroid function other than FT4 and TSH, and common age-related eye diseases (other than late AMD). More research is needed to explore the role of FT4 in AMD and potential sex discrepancies.
Conclusions
In conclusion, the causal pathway from AITD to diabetic retinopathy and cataract is primarily mediated via T1D. Conversely, for cataract, T2D was a stronger risk factor than T1D. Furthermore, only T2D, and not T1D, was a risk factor for glaucoma. This underscores the importance of regular eye screenings in individuals with diabetes. Finally, high-normal FT4 levels may increase the risk of late AMD, especially among women, highlighting the need for further investigation into the role of FT4 in AMD as well as potential sex differences.
Footnotes
Acknowledgments
The authors thank the International Age-related Macular Degeneration Genomics Consortium (IAMDGC) for providing additional unpublished summary statistics for sex-combined and-stratified summary statistics for late AMD.
Data Availability Statement
All databases used in this article are publicly available. IAMDGC provided additional nonpublic information for this publication.
Authors’ Contributions
T.W.W.: GWAS SNPs for AMD; A.D.K., C.E., R.S., M.M., and A.T.: GWAS SNPs for thyroid function; C.E., A.T., E.M., A.K., L.B., E.H., R.S., B.O.Å., S.B., M.M., and A.D.K.: Methodology; A.D.K.: Analysis; A.D.K. and C.E.: Article draft. All authors: Interpretation, article revision, conceptualization, and final approval.
Author Disclosure Statement
A.D.K., C.E., and M.M. are members of the editorial board for the Thyroid journal and were blinded to the review of this article.
Funding Information
IAMDGC is supported by
Supplementary Material
Supplementary Table S1
Supplementary Table S2
Supplementary Table S3
Supplementary Table S4
Supplementary Table S5
Supplementary Table S6
Supplementary Table S7
Supplementary Table S8
Supplementary Table S9
Supplementary Table S10
Supplementary Table S11
Supplementary Table S12