
Abstract
Background:
Distant metastases (DM) are the leading cause of thyroid cancer-related death in patients with differentiated thyroid cancer (DTC). Despite significant progress in understanding DNA methylation in DTC, the methylation landscape of metastatic primary tumors and DM remains unclear. Our primary objective was to investigate DNA methylation dynamics during DTC progression, with a secondary goal of assessing potential clinical implications.
Materials and Methods:
We conducted a multicenter retrospective study in patients with DTC who underwent surgery at five university hospitals. We profiled DNA methylation in a discovery series of 97 samples (15 normal tissues, 30 non-metastatic [non-mDTC], and 35 metastatic [mDTC] primary DTC, and 17 paired metastases [lymph nodes and DM]). Results were validated in an independent series of 17 non-mDTC and 13 mDTC. We used receiver operating characteristic curve analysis to evaluate the identified prognostic CpG-signature.
Results:
DNA methylation alterations, mostly hypomethylation, increased progressively from primary tumors to DM, both in papillary (PTC) and follicular (FTC) thyroid carcinomas. Compared with normal tissue, non-metastatic primary PTC (non-mPTC) exhibited more hypomethylated than hypermethylated CpGs in contrast to non-metastatic primary FTC (non-mFTC). However, metastatic tumors, both mPTC and mFTC, predominantly exhibited hypomethylated CpGs. The overlap of differentially methylated CpGs (DMe-CpGs) was low between non-mPTC and non-mFTC (14% non-mPTC DMe-CpGs present in non-mFTC) but significantly higher between mPTC and mFTC (60% mPTC DMe-CpGs present in mFTC), underscoring the convergence of epigenetic changes during metastatic progression. The presence of many de novo DMe-CpGs from metastatic primary tumors (83% from mPTC and 40% from mFTC) in DM, including metachronous DM, supports the hypothesis that DM originates from a major subclone of the primary tumor. We identified and validated a 156-CpG signature in primary tumors capable of distinguishing between non-mDTC and mDTC, offering potential prognostic value for DM development regardless of histology.
Conclusions:
These results show a progressive increase in DNA methylation alterations, mainly hypomethylation, during PTC and FTC metastatic progression, suggesting a linear model, though the DNA methylation dynamics differs between the two histological types. The analysis of the 156-CpG signature in primary tumors may help identify patients with DTC at high risk for DM, enhancing a more personalized treatment.
Introduction
Most patients with differentiated thyroid cancer (DTC), which comprises both papillary thyroid cancer (PTC) and follicular thyroid cancer (FTC), have an excellent prognosis and can be effectively treated with standard therapies based on surgery and radioiodine. 1 However, some DTC tumors progress and develop distant metastases (DM), the main cause of thyroid cancer-related death, even many years after the initial diagnosis and treatment. 2,3 Therefore, early identification of patients with DTC at high risk of developing DM would allow the clinician to offer a more aggressive initial treatment as well as an intensive follow-up to prevent rapid progression and increase survival. Previous studies have focused on clinicopathological characteristics and genetic alterations. Age, histology, and tumor size, among others, have been shown to be independent risk factors of DM. 4 –7 Genomic studies, especially in PTC, have revealed that DTC has a low mutational burden, with BRAFV600E being the most common mutation followed by mutations in RAS, and have identified certain mutations (TERT, PIK3CA, TP53, AKT1) associated with aggressive tumors. 8 –11 However, although many of these factors are included in widely used risk stratification models, 1,12 the accuracy to early predict the development of DM should be refined.
DTC is also characterized by DNA methylation alterations. 13 DNA methylation is a well-known epigenetic mark that mostly occurs in the cytosines within CpG dinucleotides and is involved in many cellular functions, including regulation of gene expression and DNA structure. 14,15 DNA methylation is often considered a repressive mark. Most of the human genome is methylated, except some CpG-rich regions—known as CpG islands (CGIs)—which usually remain unmethylated and are associated with promoters. In comparison with normal cells, tumor cells can harbor hypermethylation and hypomethylation. 16,17 Hypermethylation is usually local and affects regulatory elements, whereas hypomethylation has been detected both locally and globally, affecting extensive domains of the genome that include repetitive and unique sequences. These epigenetic alterations, which co-occur within the same cancer cell, can lead to transcriptional alterations that trigger a transformation of the cellular phenotype.
Several genome-wide DNA methylation studies found that DTC methylomes were specifically associated with histology and with BRAF and RAS mutations, showing the relevance of this epigenetic mark in DTC. 18 –22 In addition, other studies have identified DNA methylation signatures with potential as diagnostic or prognostic biomarkers. 23 –25 However, there is a lack of epigenetic profiling in metastatic primary DTC (mDTC) and DM. Remarkably, in a previous study by our group, we found that primary DTC tumors that develop DM (mDTC) were affected by global hypomethylation of Alu repeats. 26 Accordingly, the 2022 World Health Organization Classification of Thyroid Neoplasms proposes global hypomethylation as a marker of adverse biology in DTC. 27
Here, we have performed a retrospective analysis of DNA methylomes in normal thyroid tissue, non-metastatic primary DTC (non-mDTC), mDTC, lymph node metastases (LNM), and DM, to characterize the DNA methylation alterations occurring during the metastatic progression of DTC. As a secondary objective, we aimed to study their potential clinical implications.
Material and Methods
Patient and samples
This was a retrospective study of normal and tumor thyroid tissue obtained from patients with non-mDTC and mDTC treated at five European centers. Patients with non-mDTC were defined as those with non-aggressive PTC or FTC variants (non-mPTC or non-mFTC), with no DM at diagnosis, and who were disease-free after initial treatment and remained disease-free during a follow-up of at least 5 years. mDTC patients were any PTC or FTC (mPTC or mFTC) patient with either synchronous or metachronous (occurring at least 6 months after diagnosis) DM. Primary tumors <1 cm in size were excluded. Normal tissue was defined as non-tumor thyroid tissue adjacent to tumor tissue, as indicated by the pathologist.
The discovery series for the DNA methylome analysis included 97 formalin-fixed, paraffin-embedded (FFPE) samples obtained from 68 patients with DTC who underwent thyroidectomy: 65 primary tumors (30 non-mDTC and 35 mDTC); 15 normal tissues, of which 13 were paired; 6 paired LNM (5 derived from mPTC and 1 from mFTC); and 11 DM, of which 10 were paired (6 derived from mPTC [PTC-DM] and 5 from mFTC [FTC-DM]), mostly from bone or lung, 3 metachronous. The validation series included 30 FFPE samples, 17 non-mDTC and 13 mDTC (9 from patients with metachronous DM). Baseline and tumor characteristics of the discovery series are shown in Table 1 and those of the validation series are shown in Supplementary Table S1. A participant flow diagram for each series and a scheme of the study design are depicted in Supplementary Figure S1.
Baseline Patient and Tumor Characteristics in the Discovery Series
Nine normal tissues from patients with non-mDTC and six from patients with mDTC.
From patients with mDTC.
The histology refers to the paried primary tumor.
There was one BRAF mutation other than V600E.
The three genes were all wild-type.
Data on some mutations were missing.
FTC, follicular thyroid cancer; DTC, differentiated thyroid cancer; DM, distant metastasis; LNM, lymph node metastasis; mDTC, metastatic primary thyroid tumor; non-mDTC, nonmetastatic primary thyroid tumor; PTC, papillary thyroid cancer.
Participating centers and ethics approval
The study was conducted in accordance with the Declaration of Helsinki as revised in 2013. The protocol and informed consent forms were approved by the Ethics Committees of the participating centers: University Hospital Germans Trias i Pujol (Badalona, Spain; PI-15-018), University Hospital Vall d’Hebron (Barcelona, Spain; PR[AG]90/2015), Hospital 12 de Octubre (Madrid, Spain, 15/024), Hospital de Móstoles (Madrid, Spain; 2015/007), and University Medical Center Groningen (Groningen, The Netherlands; METC 2012/183). All patients who were still alive during sample recruitment provided written informed consent for use of their thyroid tissue.
Mutation analyses
BRAF and RAS mutations were analyzed by Sanger sequencing, and TERT promoter (TERTp) mutations by digital polymerase chain reaction.
DNA methylation analysis
DNA methylation was profiled using the Infinium MethylationEPIC v1.0 (discovery series) and v2.0 (validation series) arrays, and data were analyzed using RnBeads. 28 Briefly, for each CpG site, methylation levels were quantified by beta values ranging from 0 to 1. Global DNA methylation was calculated as the mean beta value. Differential DNA methylation was analyzed through hierarchical linear models as implemented in the limma package3. p-Values were corrected for multiple testing using a false discovery rate. Probes with adjusted p ≤ 0.05 and delta-beta (Δβ) >0.2 or <−0.2 between groups of samples were considered hypermethylated or hypomethylated, respectively. The 156-CpG signature was identified by comparing non-mDTC and mDTC.
Clustering analyses were performed using the pheatmap package in R and GO analyses using the GO Consortium website.
The Cancer Genome Atlas dataset analyses
We used DNA methylation and gene expression data from The Cancer Genome Atlas (TCGA) thyroid dataset. 22 DNA methylation analyses were performed using the same methods as for the discovery series, and differential gene expression analyses were performed using DESeq2. 29
Statistical analyses
All analyses were performed using R version 4.1.3.
Additional information is available in Supplementary Data.
Results
Mutational analysis of the discovery series
Among the 65 primary tumors, 13 (20%) harbored a driver mutation in BRAF (11 BRAFV600E ), and 13 (20%) in RAS (9 NRAS, 3 HRAS, and 1 KRAS) (Table 1, Supplementary Table S2). Additionally, mutations in TERTp were detected in 1/30 (3,3%) non-mDTC versus 21/35 (60%) mDTC (p < 0.000001). The TERTp mutant allele frequency (MAF) of the non-mPTC was 2.9%, whereas the median TERTp MAF in mDTC was 18.2% (interquartile range, 0–35%). This is consistent with the association of this mutation with poor outcomes in patients with thyroid cancer. 30,31 Concomitant RAS and TERTp mutations were detected in five tumors, and concomitant BRAF and TERTp mutations in four. Importantly, LNM and DM harbored the same mutations as their paired primary tumors.
Progressive increase of DNA methylation alterations during metastatic progression of PTC and FTC
The analysis of global DNA methylation levels revealed that, compared with normal tissue, CGIs were hypermethylated in mPTC (p = 0.02) and mFTC (p = 0.001), but neither in non-mPTC (p = 0.744) nor in non-mFTC (p = 0.279). In contrast, non-CGI regions were hypomethylated in non-mPTC (p = 0.006), mPTC (p = 0.022), and mFTC (p = 0.012) but not in non-mFTC (p = 0.332) (Fig. 1). We did not find significant differences in CGI shores. Interestingly, the global methylation levels of LNM and DM were similar to that of metastatic primary tumors (Fig. 1 and Supplementary Fig. S2).
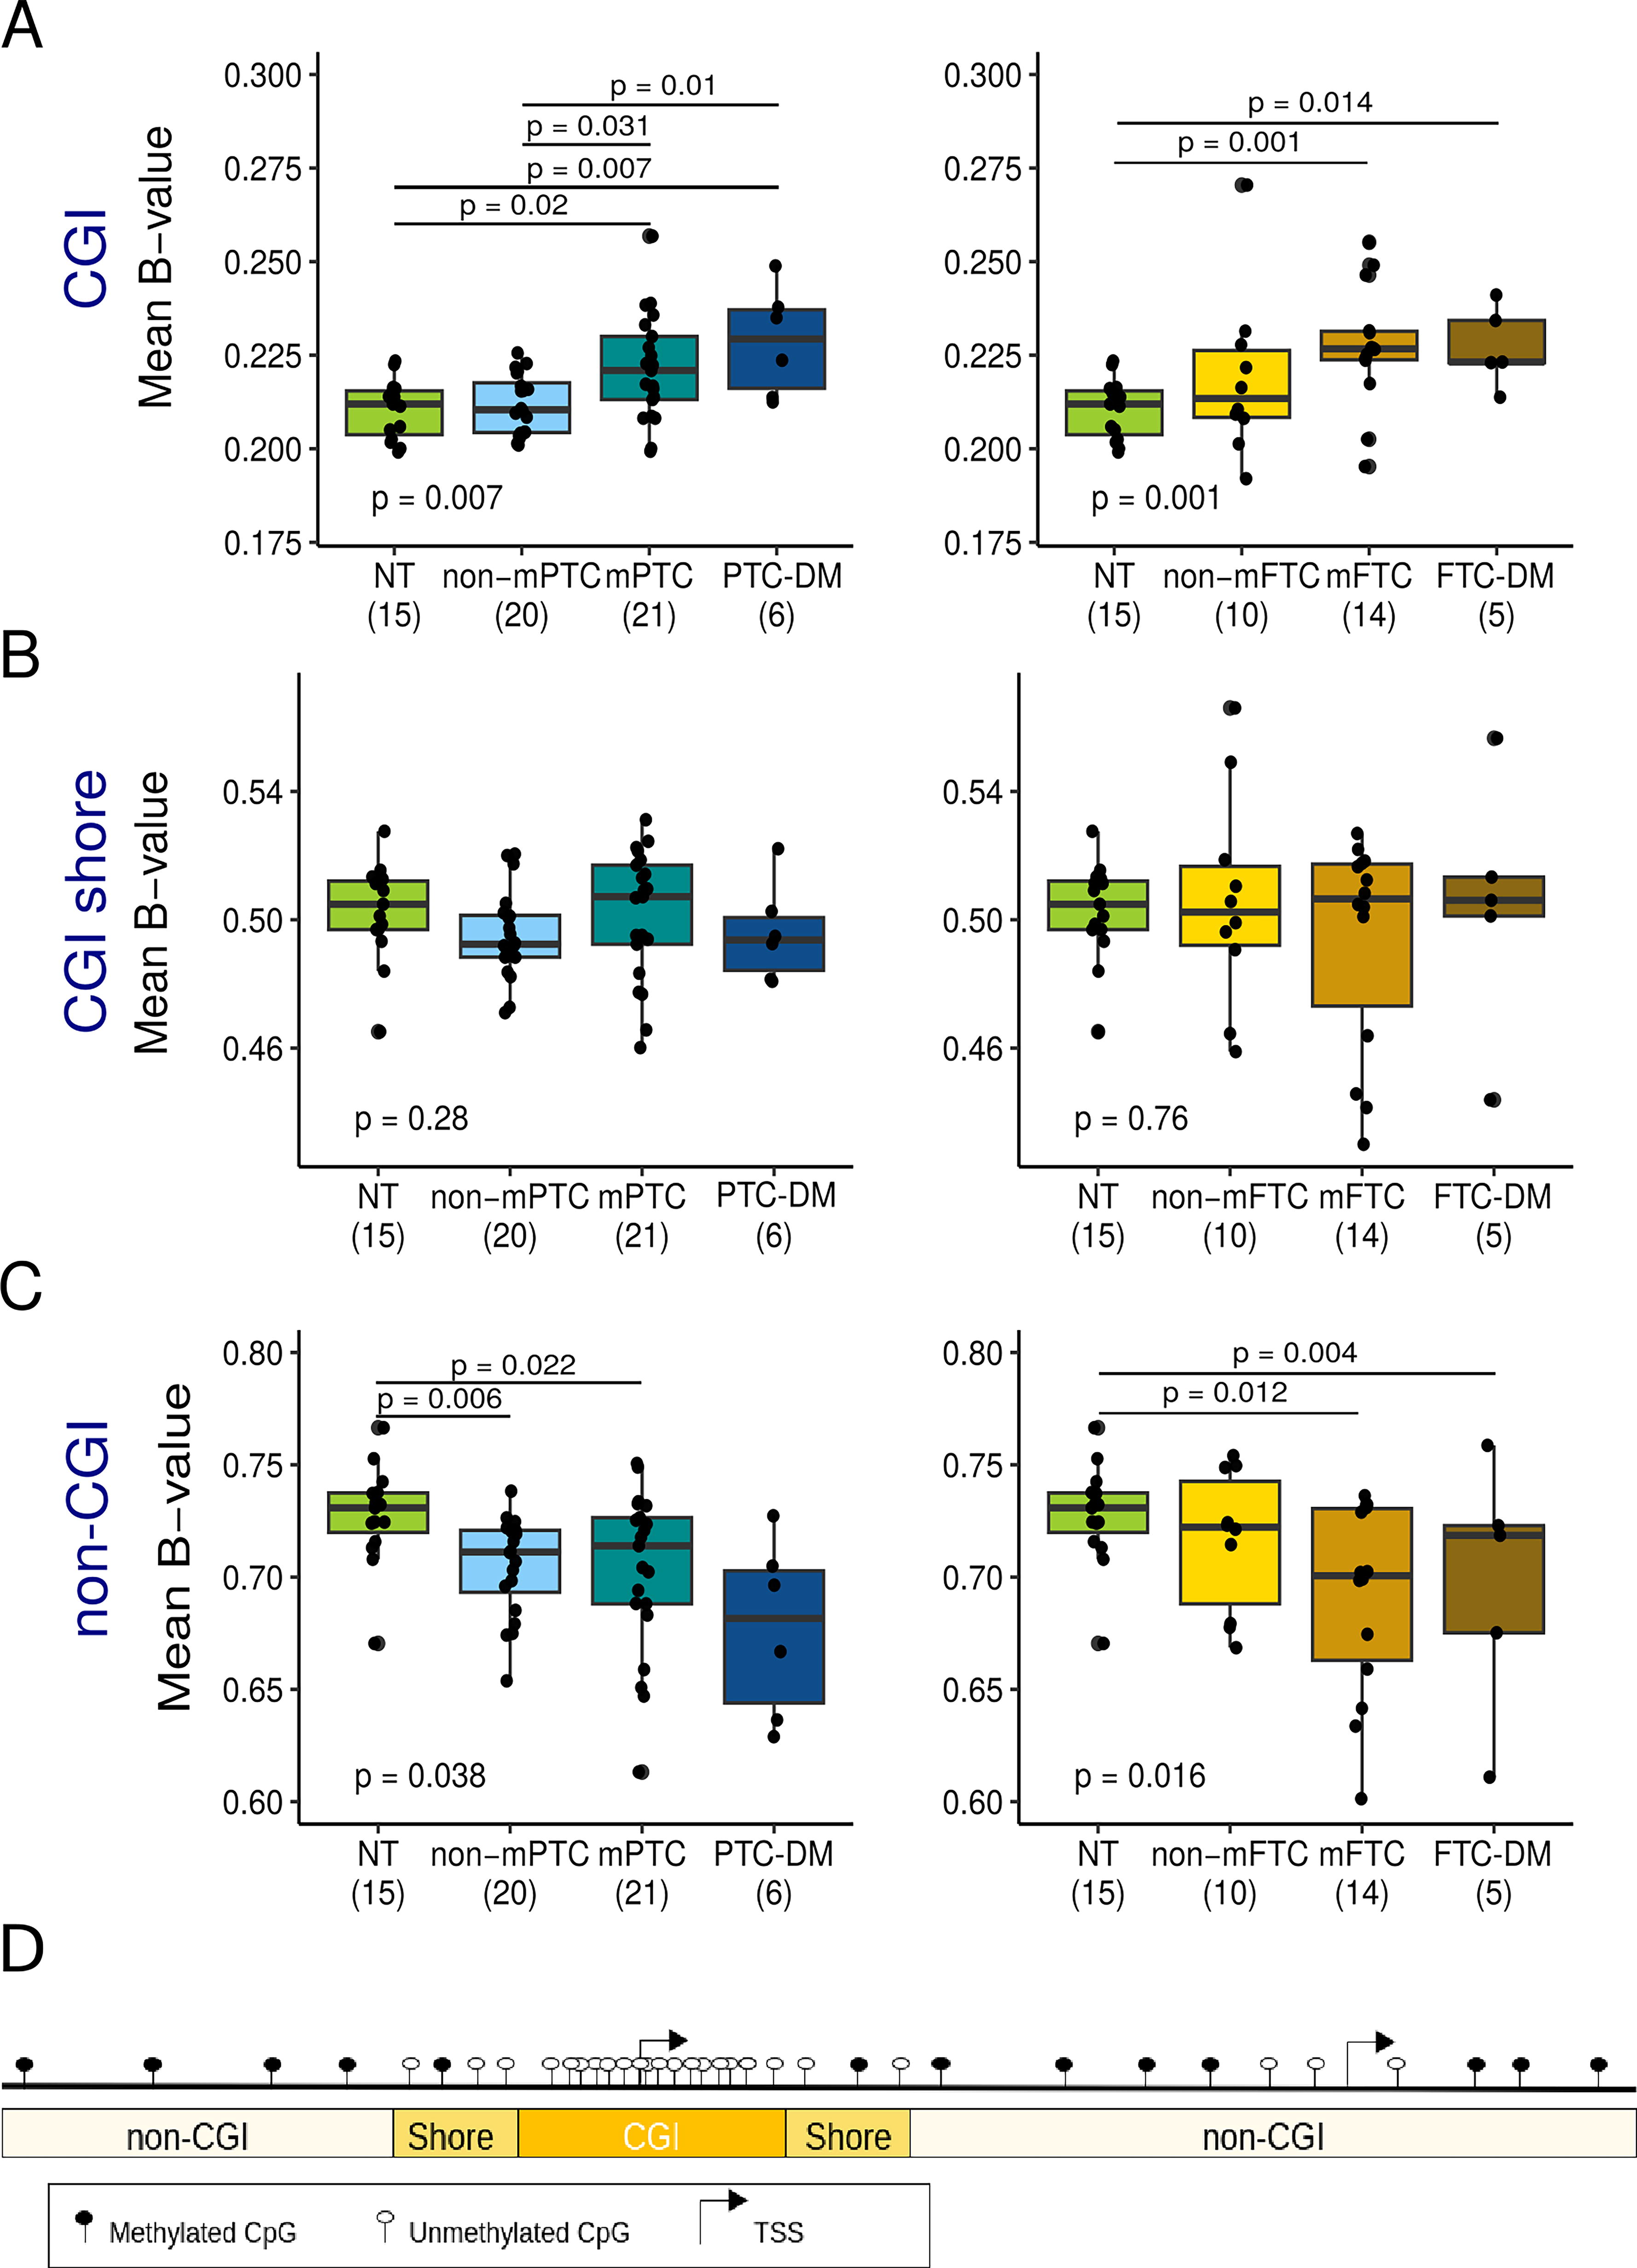
Changes in global DNA methylation levels during metastatic progression of papillary (PTC) and follicular thyroid cancer (FTC). Global DNA methylation levels measured as the mean of the beta-values of the CpGs located in
We then analyzed the differentially methylated CpGs (DMe-CpGs), including hypermethylation and hypomethylation, between each tumor group and normal tissue to better understand the dynamics of DNA methylation during DTC metastatic progression. We observed a progressive increase of DMe-CpGs from non-mDTC to DM, with a predominance of hypomethylation (Supplementary Fig. S3A). Compared with normal tissue, in non-mPTC, mPTC, and PTC-DM, we identified 6343, 6493, and 35,191 DMe-CpGs, respectively (Supplementary Fig. S3B). The correlation between these results and PTC data from TCGA was high, highlighting the robustness of our DNA methylome analysis (Supplementary Fig. S4). We also analyzed LNM derived from mPTC and found an increase of methylation alterations compared to primary tumor but less than in DM (n = 22,378) (Supplementary Fig. S3B). Notably, 48% of DMe-CpGs in PTC-LNM overlapped with DM. In non-mFTC, mFTC and FTC-DM, we identified 3323, 17,069, and 16,125 DMe-CpGs, respectively. The magnitude of the DNA methylation changes was greater between DM and normal tissue than between primary tumors (both PTC and FTC, metastatic, and non-metastatic) and normal tissue, which could be explained in part by higher cellular homogeneity in DM (Supplementary Fig. S5).
In line with our findings on global DNA methylation levels, 91% of DMe-CpGs in non-mPTC were hypomethylated in contrast to 52% in non-mFTC, whereas hypomethylation affected 67% and 77% of DMe-CpGs in mPTC and mFTC, respectively (Supplementary Fig. S3B). We also observed a high percentage of hypomethylated CpGs in DM (76% in PTC-DM and 50% in FTC-DM).
More importantly, 32% of DMe-CpGs in non-mPTC (1676 hypomethylated and 416 hypermethylated CpGs) were maintained in mPTC and PTC-DM, whereas 47% of those occurring in non-mFTC (926 hypomethylated and 632 hypermethylated) were also present in mFTC and FTC-DM (Fig. 2A). In addition, 83% of the de novo DMe-CpGs in mPTC (1895 hypomethylated and 1325 hypermethylated CpGs) were maintained in PTC-DM, and 40% of those arising in mFTC (4004 hypomethylated and 1912 hypermethylated CpGs) were also found in FTC-DM (Fig. 2A). This pattern, observed regardless of whether the DM were metachronous, suggests that the DM were seeded from a major subclone of the primary tumor. Overall, these results point to a linear progression model.
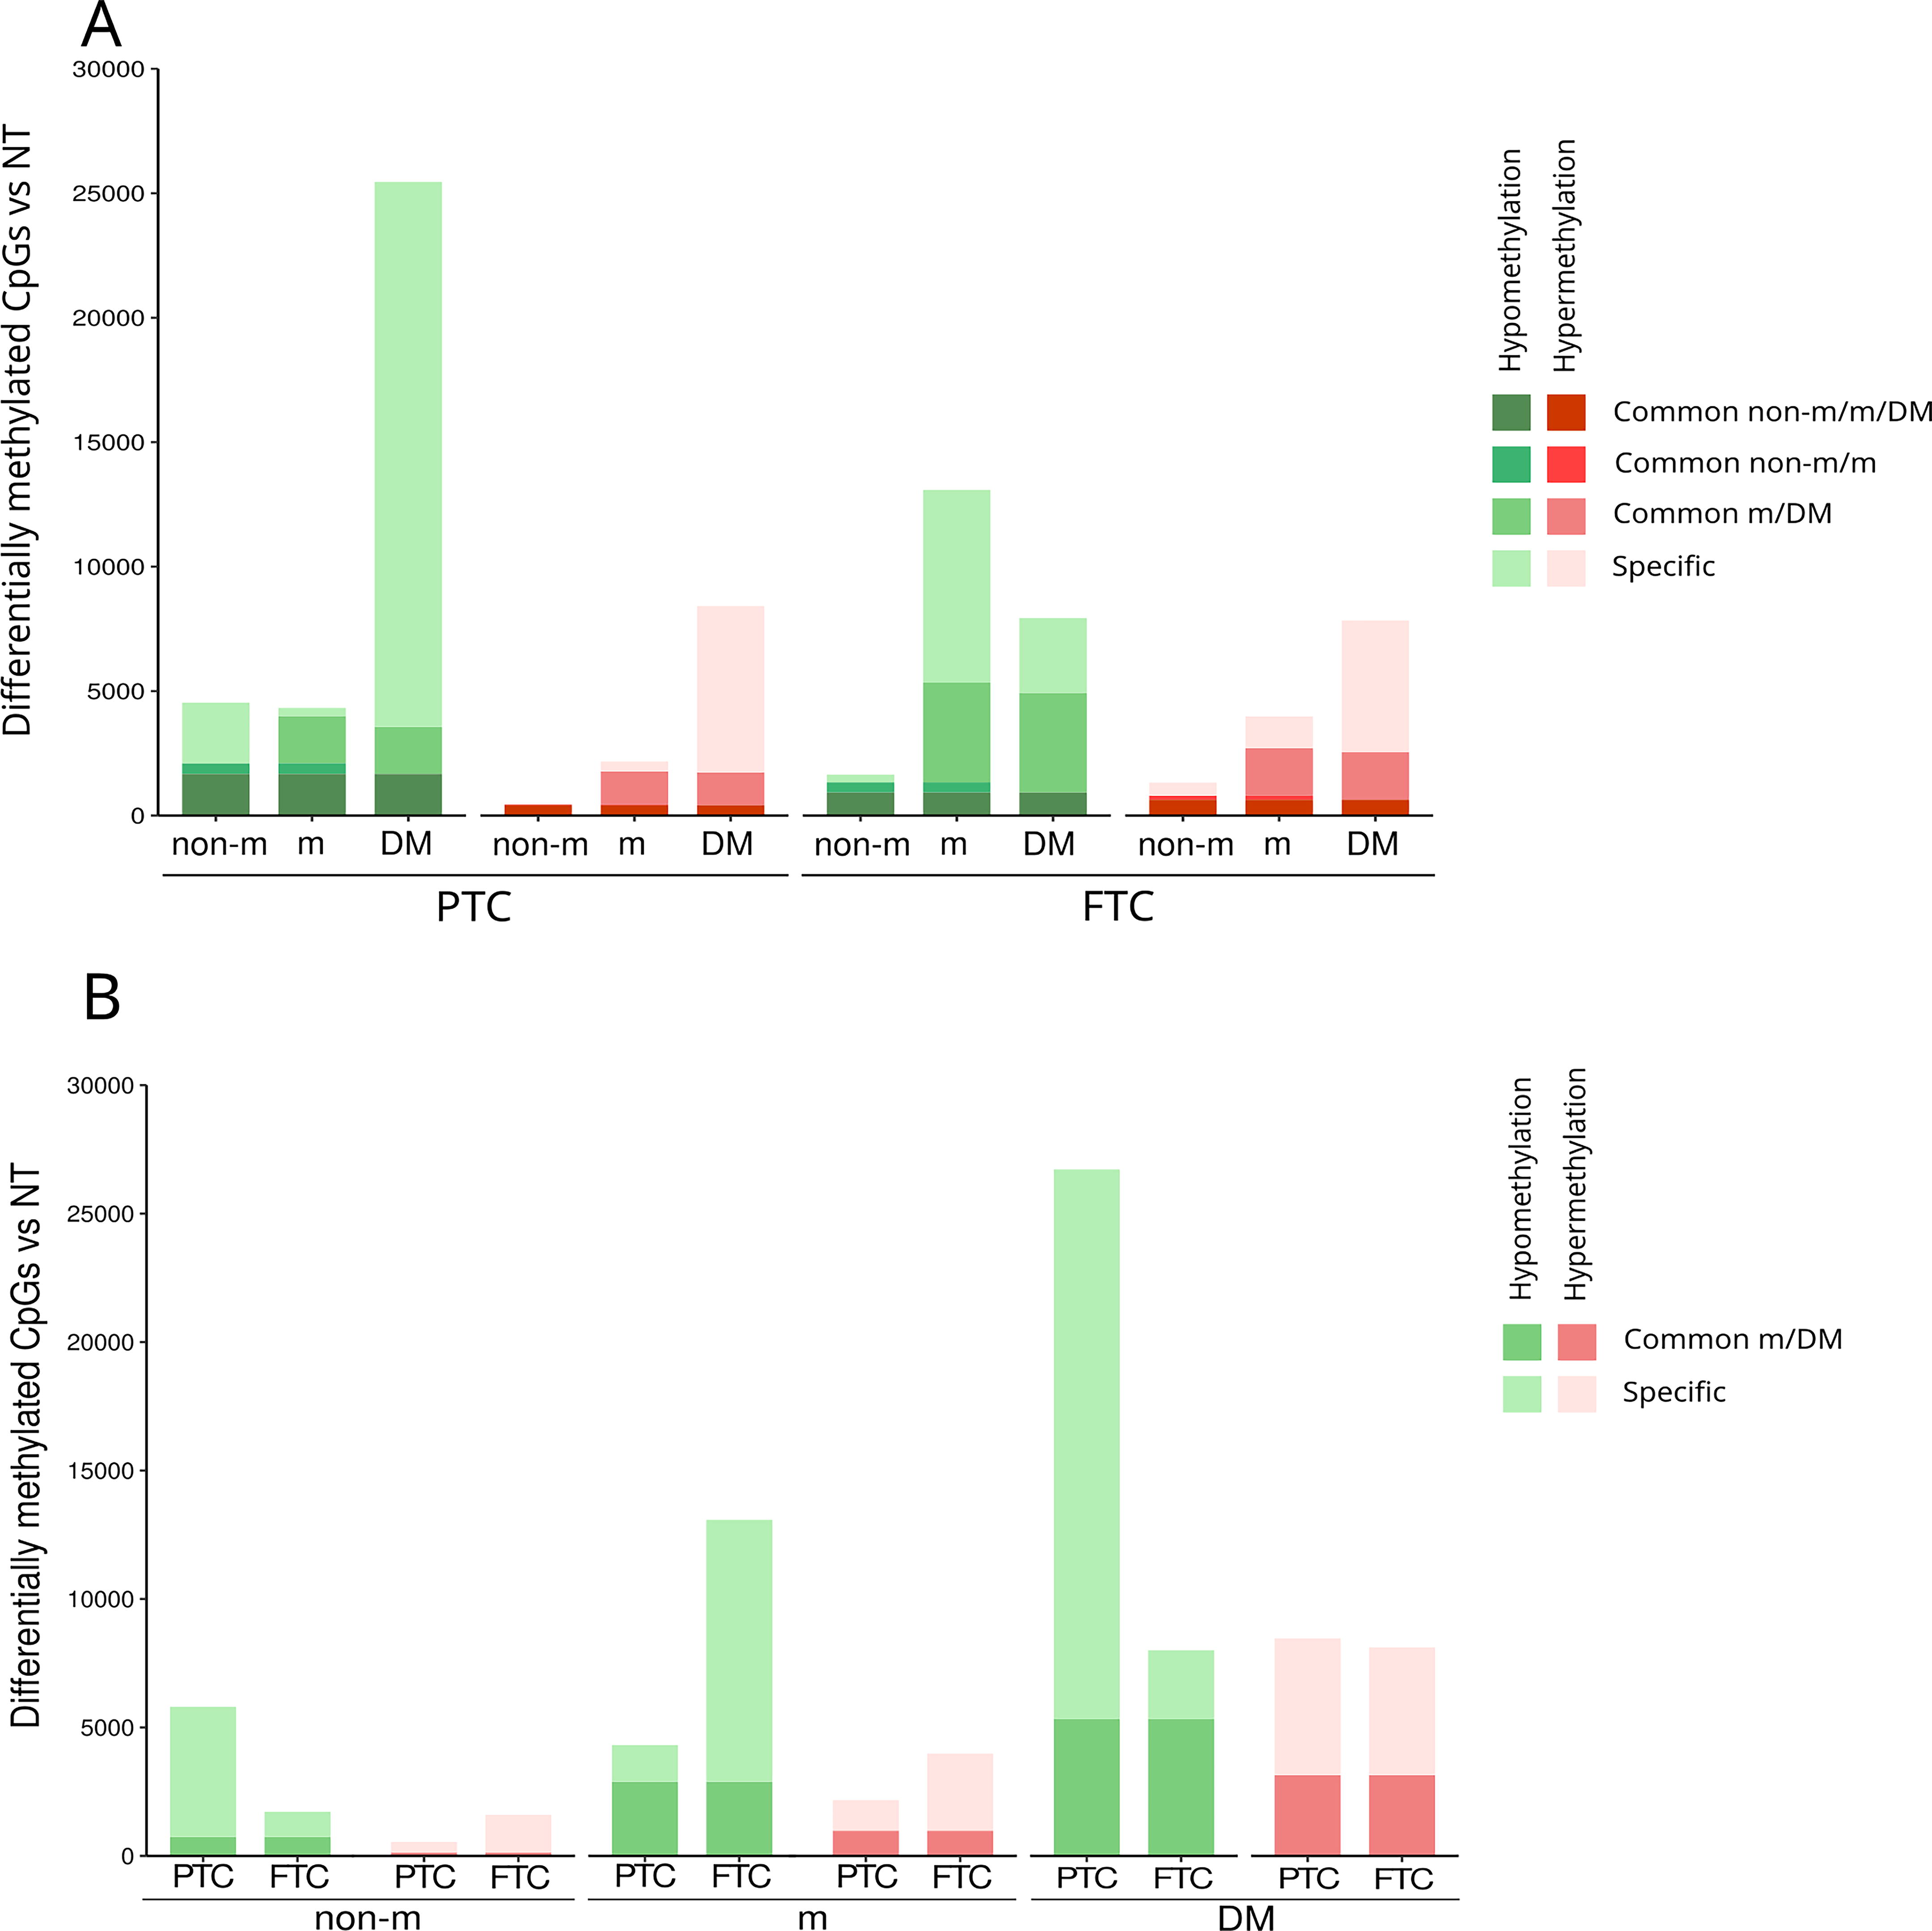
DNA methylation dynamics during metastatic progression in PTC and FTC.
We also compared methylation alterations between PTC and FTC at different points of metastatic progression. We found a low overlap of DMe-CpGs in non-mPTC with those in non-mFTC (14%), whereas the overlap of DMe-CpGs in mPTC and in mFTC was significantly higher (60%) (Fig. 2B). Similarly, significant overlap was found in DM, with 53% of FTC-DM DMe-CpGs overlapping PTC-DM DMe-CpGs. These results suggested histology-specific epigenetic alterations in the initiation of PTC and FTC but common epigenetic alterations in the metastatic progression of both histological types.
Genomic distribution and functional characterization of DNA methylation alterations during metastatic progression of DTC
To better understand the functional implications of methylation changes during metastatic progression, we analyzed the genome distribution of the DMe-CpGs (Fig. 3, Supplementary Table S3). The hypomethylated CpGs in all tumors, as well as the hypermethylated CpGs in non-mPTC, showed a high enrichment of CpGs far from CGIs (p < 2.2e-16, odds ratio [OR] > 3) at intergenic regions (p < 2.2e-16, OR > 1.1), and depletion of CpGs within CGIs (p < 2.2e-16, OR < 0.07) at 5′ regions (p < 2.2e-16, OR <0.5). In contrast, hypermethylated CpGs in FTC and PTC-DM were enriched in CGIs (p < 0.0075, OR > 1.2) and depleted in non-CGI regions (p < 1.64e-09, OR < 0.7). The differences in the genomic locations of hypermethylated CpGs in non-mPTC and non-mFTC again suggested that many of the epigenetic alterations involved in PTC and FTC initiation may be histology-specific.
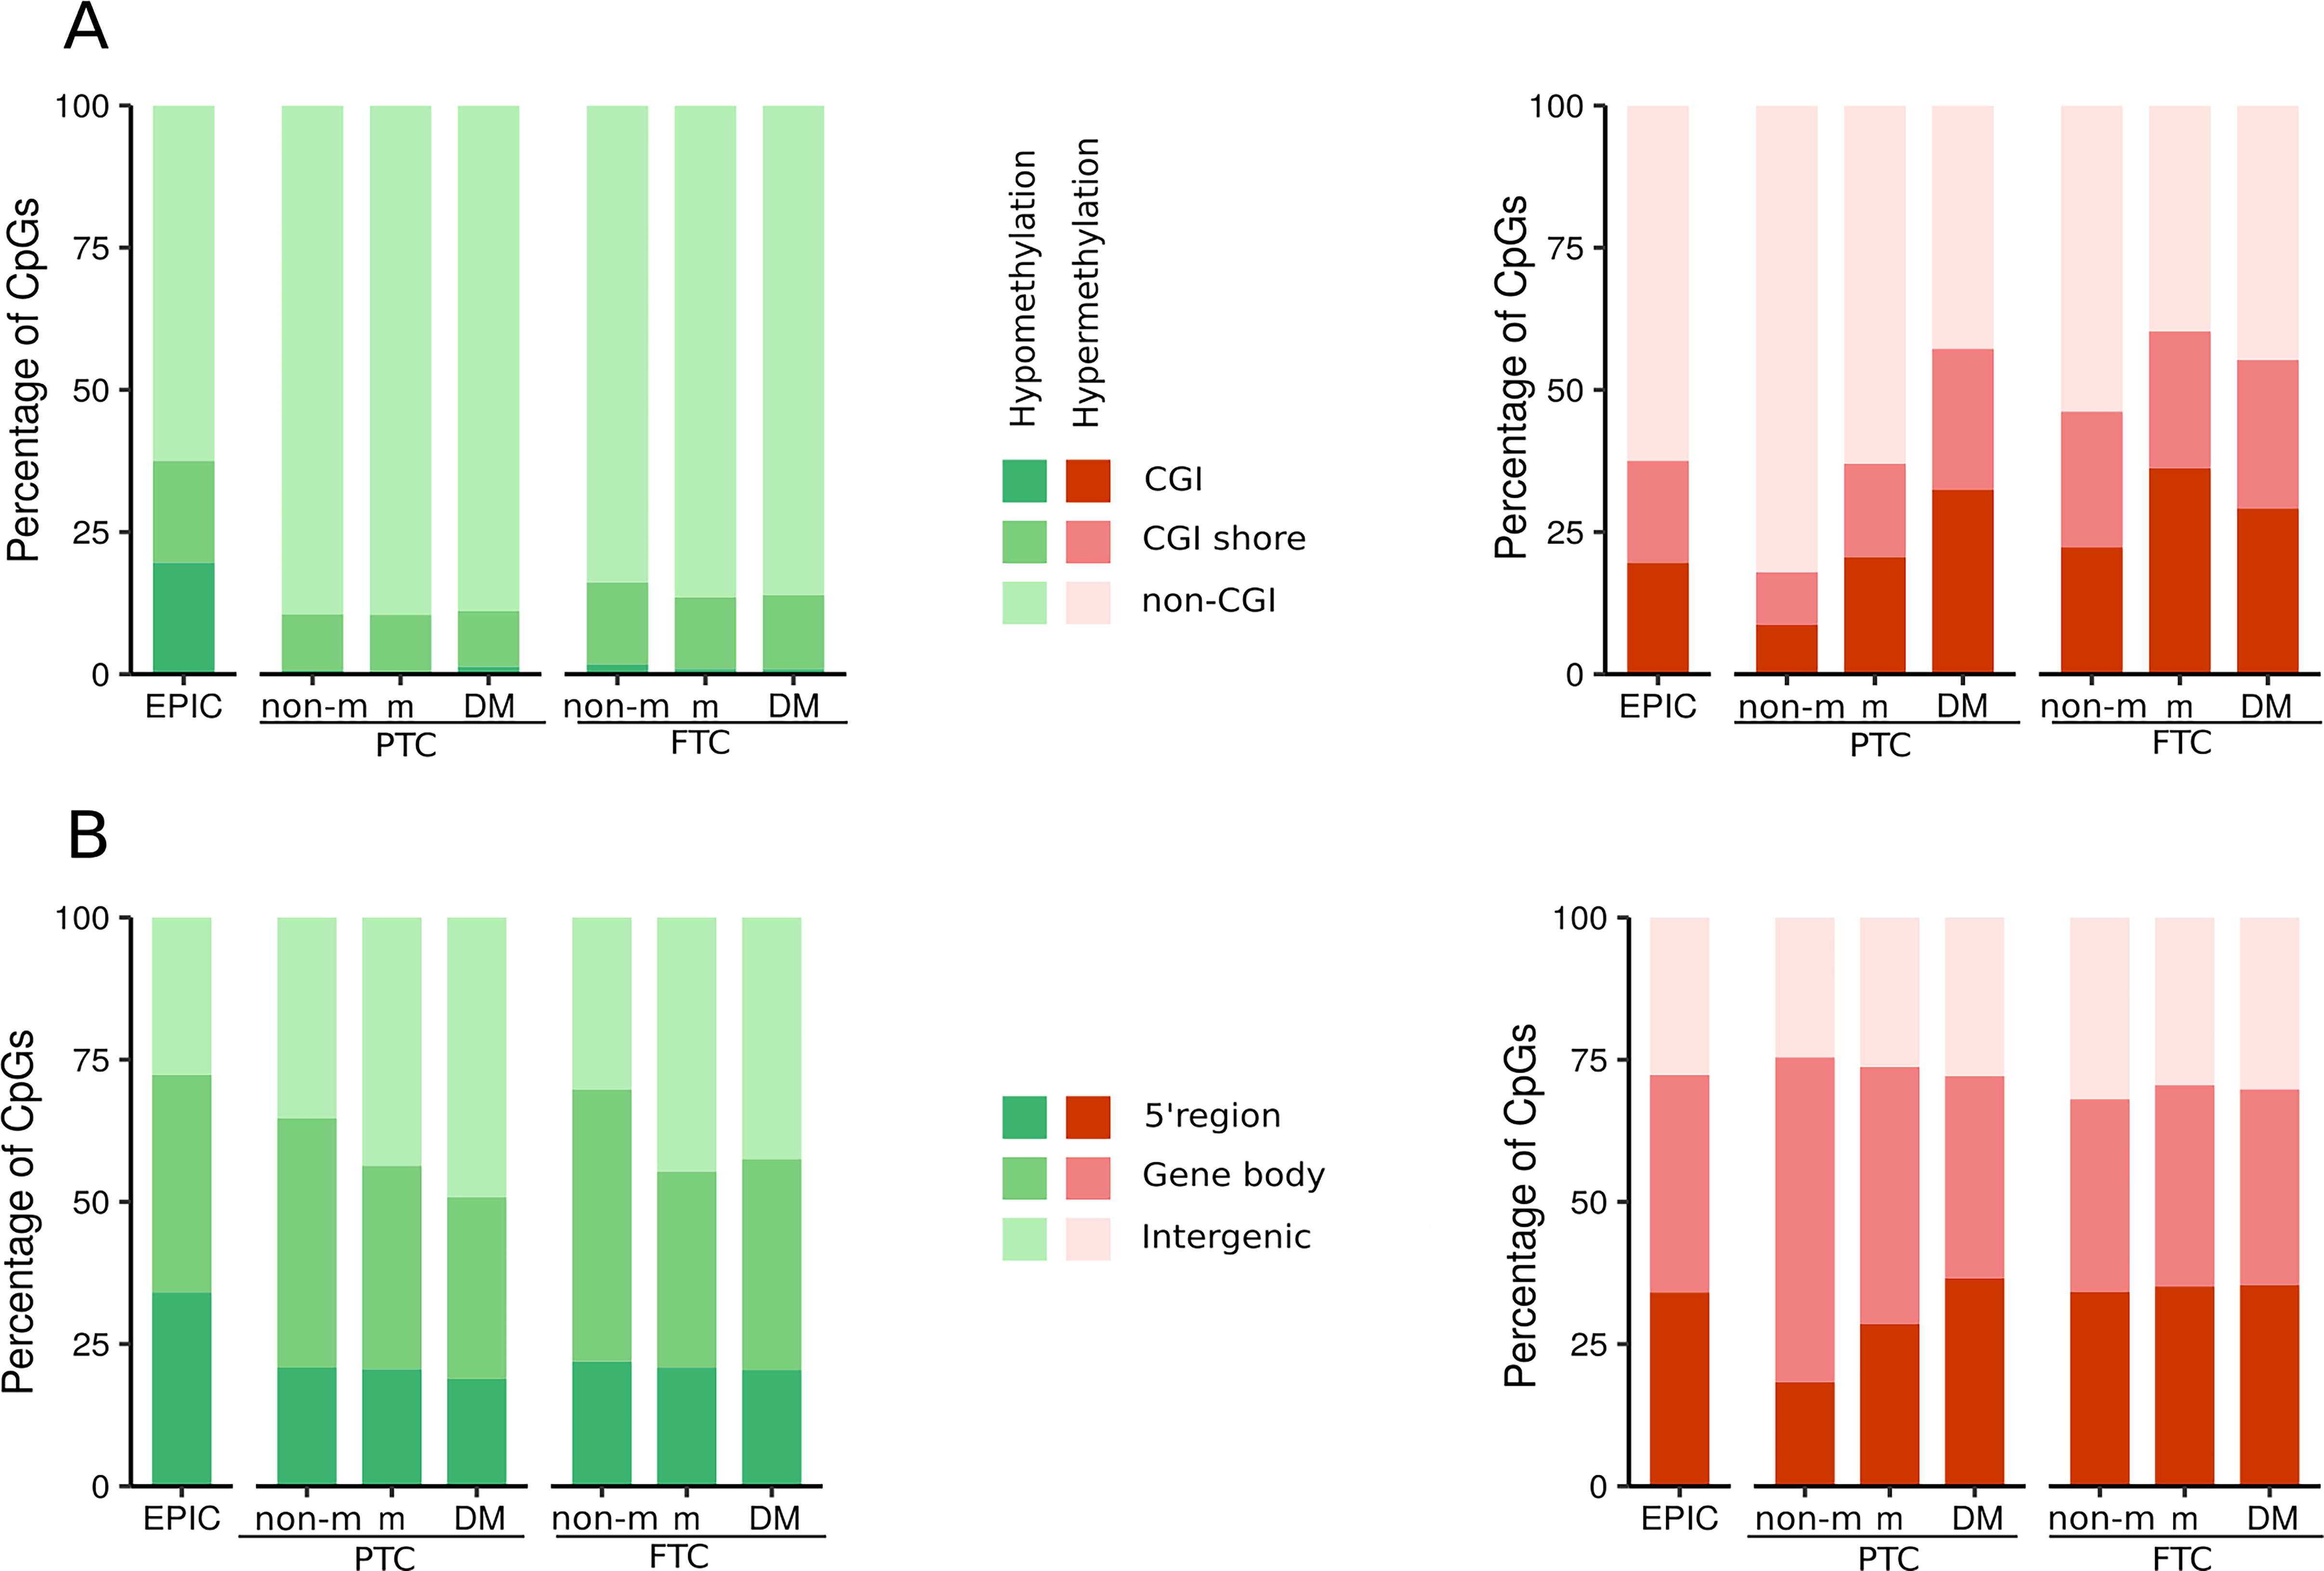
Relative genomic distribution of DMe-CpGs during metastatic progression in PTC and FTC. Stacked bar plots of the distribution of the differentially hypomethylated (green) and hypermethylated (red) CpGs across different CGI-related regions
To further investigate the potential functional implications of these alterations in DNA methylation, we performed a gene ontology (GO) analysis focusing on the DMe-CpGs located in the 5′ gene regulatory regions and their associated genes (Supplementary Table S4). In all tumor groups, we found high enrichment of GO biological process (BP) terms associated with cell adhesion, which has a key role in metastatic dissemination (Fig. 4, Supplementary Tables S5, S6 and S7). Specifically, we found many cadherin and protocadherin genes. Accordingly, GO molecular function (MF) terms involving calcium dependent processes and cellular component (CC) terms related to membrane and cell junction were also significantly enriched. In addition, certain GO terms were associated with specific tumor groups; for example, the organization or biogenesis of the cytoskeleton (BP term) and the extracellular region (CC term) were enriched in non-mPTC.
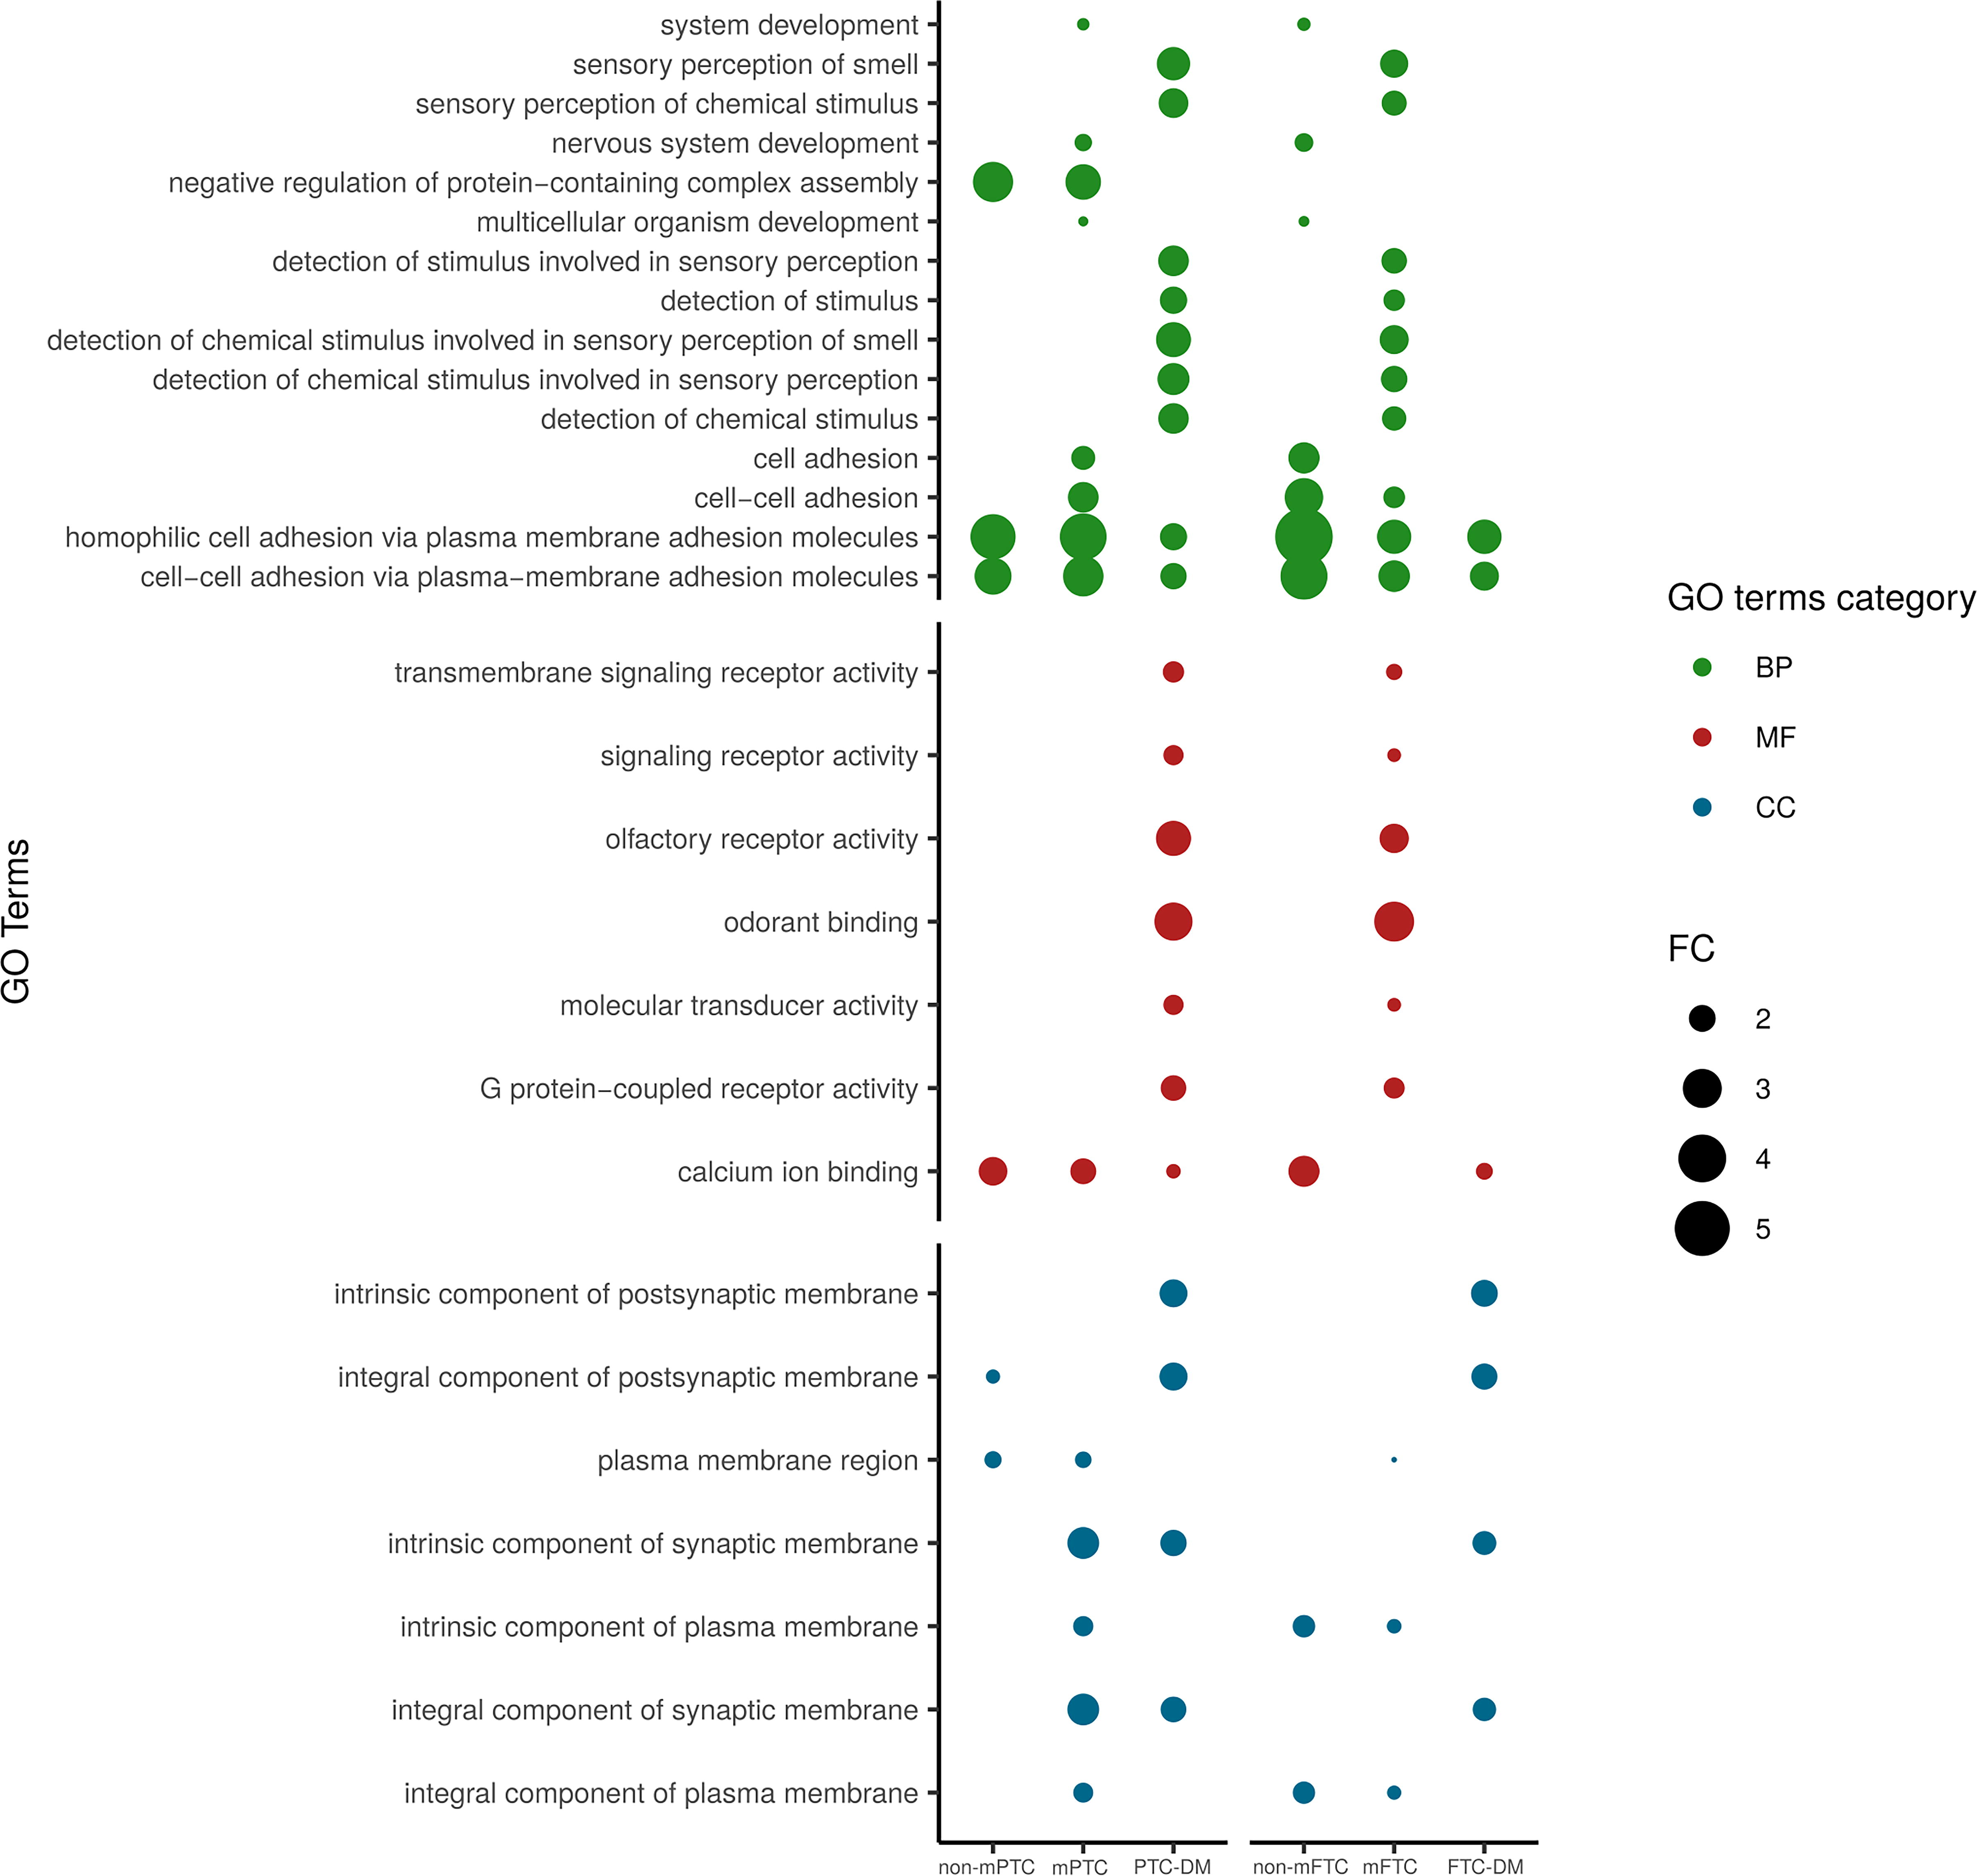
Gene ontology analysis of genes differentially methylated during metastatic progression of PTC and FTC. Dot chart showing the enriched gene ontology (GO) terms, listed on the left according to the different GO categories, of the genes differentially methylated at their 5′ regions in primary tumors (both non-metastatic and metastatic) and DM, compared with NT. Only GO terms shared between at least two groups of tumors are represented. Other GO terms are listed in Supplementary Tables S5, S6 and S7. Colors indicate the different GO categories. Dot size is based on fold-change (FC).
We also performed an integrative analysis of our DNA methylation data in non-mPTC and mPTC with TCGA gene expression data on low- and high-risk PTC (Fig. 5). Compared with normal tissue, a total of 651 and 944 DMe-CpGs in our non-mPTC and mPTC, respectively, were associated with 342 and 567 differentially expressed genes in TCGA low-risk and high-risk PTC, respectively (Supplementary Table S8). Interestingly, we found a negative correlation between DNA methylation and gene expression affecting 82% CpGs in non-mPTC and 56% in mPTCs (Fig. 5). Most of these CpGs showed CpG hypomethylation and gene upregulation and were mainly located in the 5′ region, suggesting that DNA methylation may play a role, at least partially, in regulating the associated genes. GO analyses of the differentially expressed genes associated with DMe-CpGs at their 5′ region showed an enrichment in cell adhesion (BP), calcium-dependent processes (MF), and membrane (CC), both in low- and high-risk PTC, as well as a specific enrichment in the CC extracellular region in low-risk PTC, confirming our results in the discovery series (Supplementary Table S9).

Correlation between DNA methylation and gene expression. Pie charts showing the percentage of DMe-CpGs in non-mPTC compared with NT from our discovery series and associated with differentially expressed (DE) genes in low-risk PTC compared with NT from The Cancer Genome Atlas (TCGA) dataset (dark yellow)
Taken together, these findings provide evidence for the regulatory role of DNA methylation in the metastatic progression of thyroid cancer.
Identification of a unique DNA methylation signature associated with mDTC
To investigate whether there is a specific DNA methylation signature that discriminates between non-mDTC and mDTC, we performed a differential methylation analysis between these two groups of tumors and identified a signature of 156 DMe-CpGs, 70% of which were hypomethylated in mDTC. Although DTC methylomes are strongly associated with histology and BRAF and RAS mutations, 18 –22 a hierarchical cluster analysis of this 156-CpG signature clearly separated primary tumors into two clusters independently of these variables: one cluster containing most of the non-mDTC (28/30), whereas the other contained most of the mDTC (31/34) (Fig. 6A). The clustering within mDTC was independent of TERTp mutation. Additionally, we included normal thyroid tissues and metastases in the clustering analysis. Normal tissues (even those paired with mDTC) clustered with non-metastatic DTC while metastases derived from mDTC (LNM and DM) clustered with mDTC. Interestingly, metastases did not form a distinct subcluster and most of them (10/15) clustered next to their paired primary tumor (Supplementary Fig. S6), indicating that these methylation alterations were generated in primary tumors and maintained in metastatic lesions. Of note, the primary tumors of the three patients with metachronous DM grouped with the primary tumors of patients with synchronous DM, suggesting that the 156-CpG signature could potentially predict the risk of developing DM (Fig. 6A). We validated these results using an independent series of 17 patients with non-mDTC and 13 patients with mDTC, 9 of whom had metachronous DM (Supplementary Fig. S7), providing further evidence for the predictive value of the 156-CpG signature.
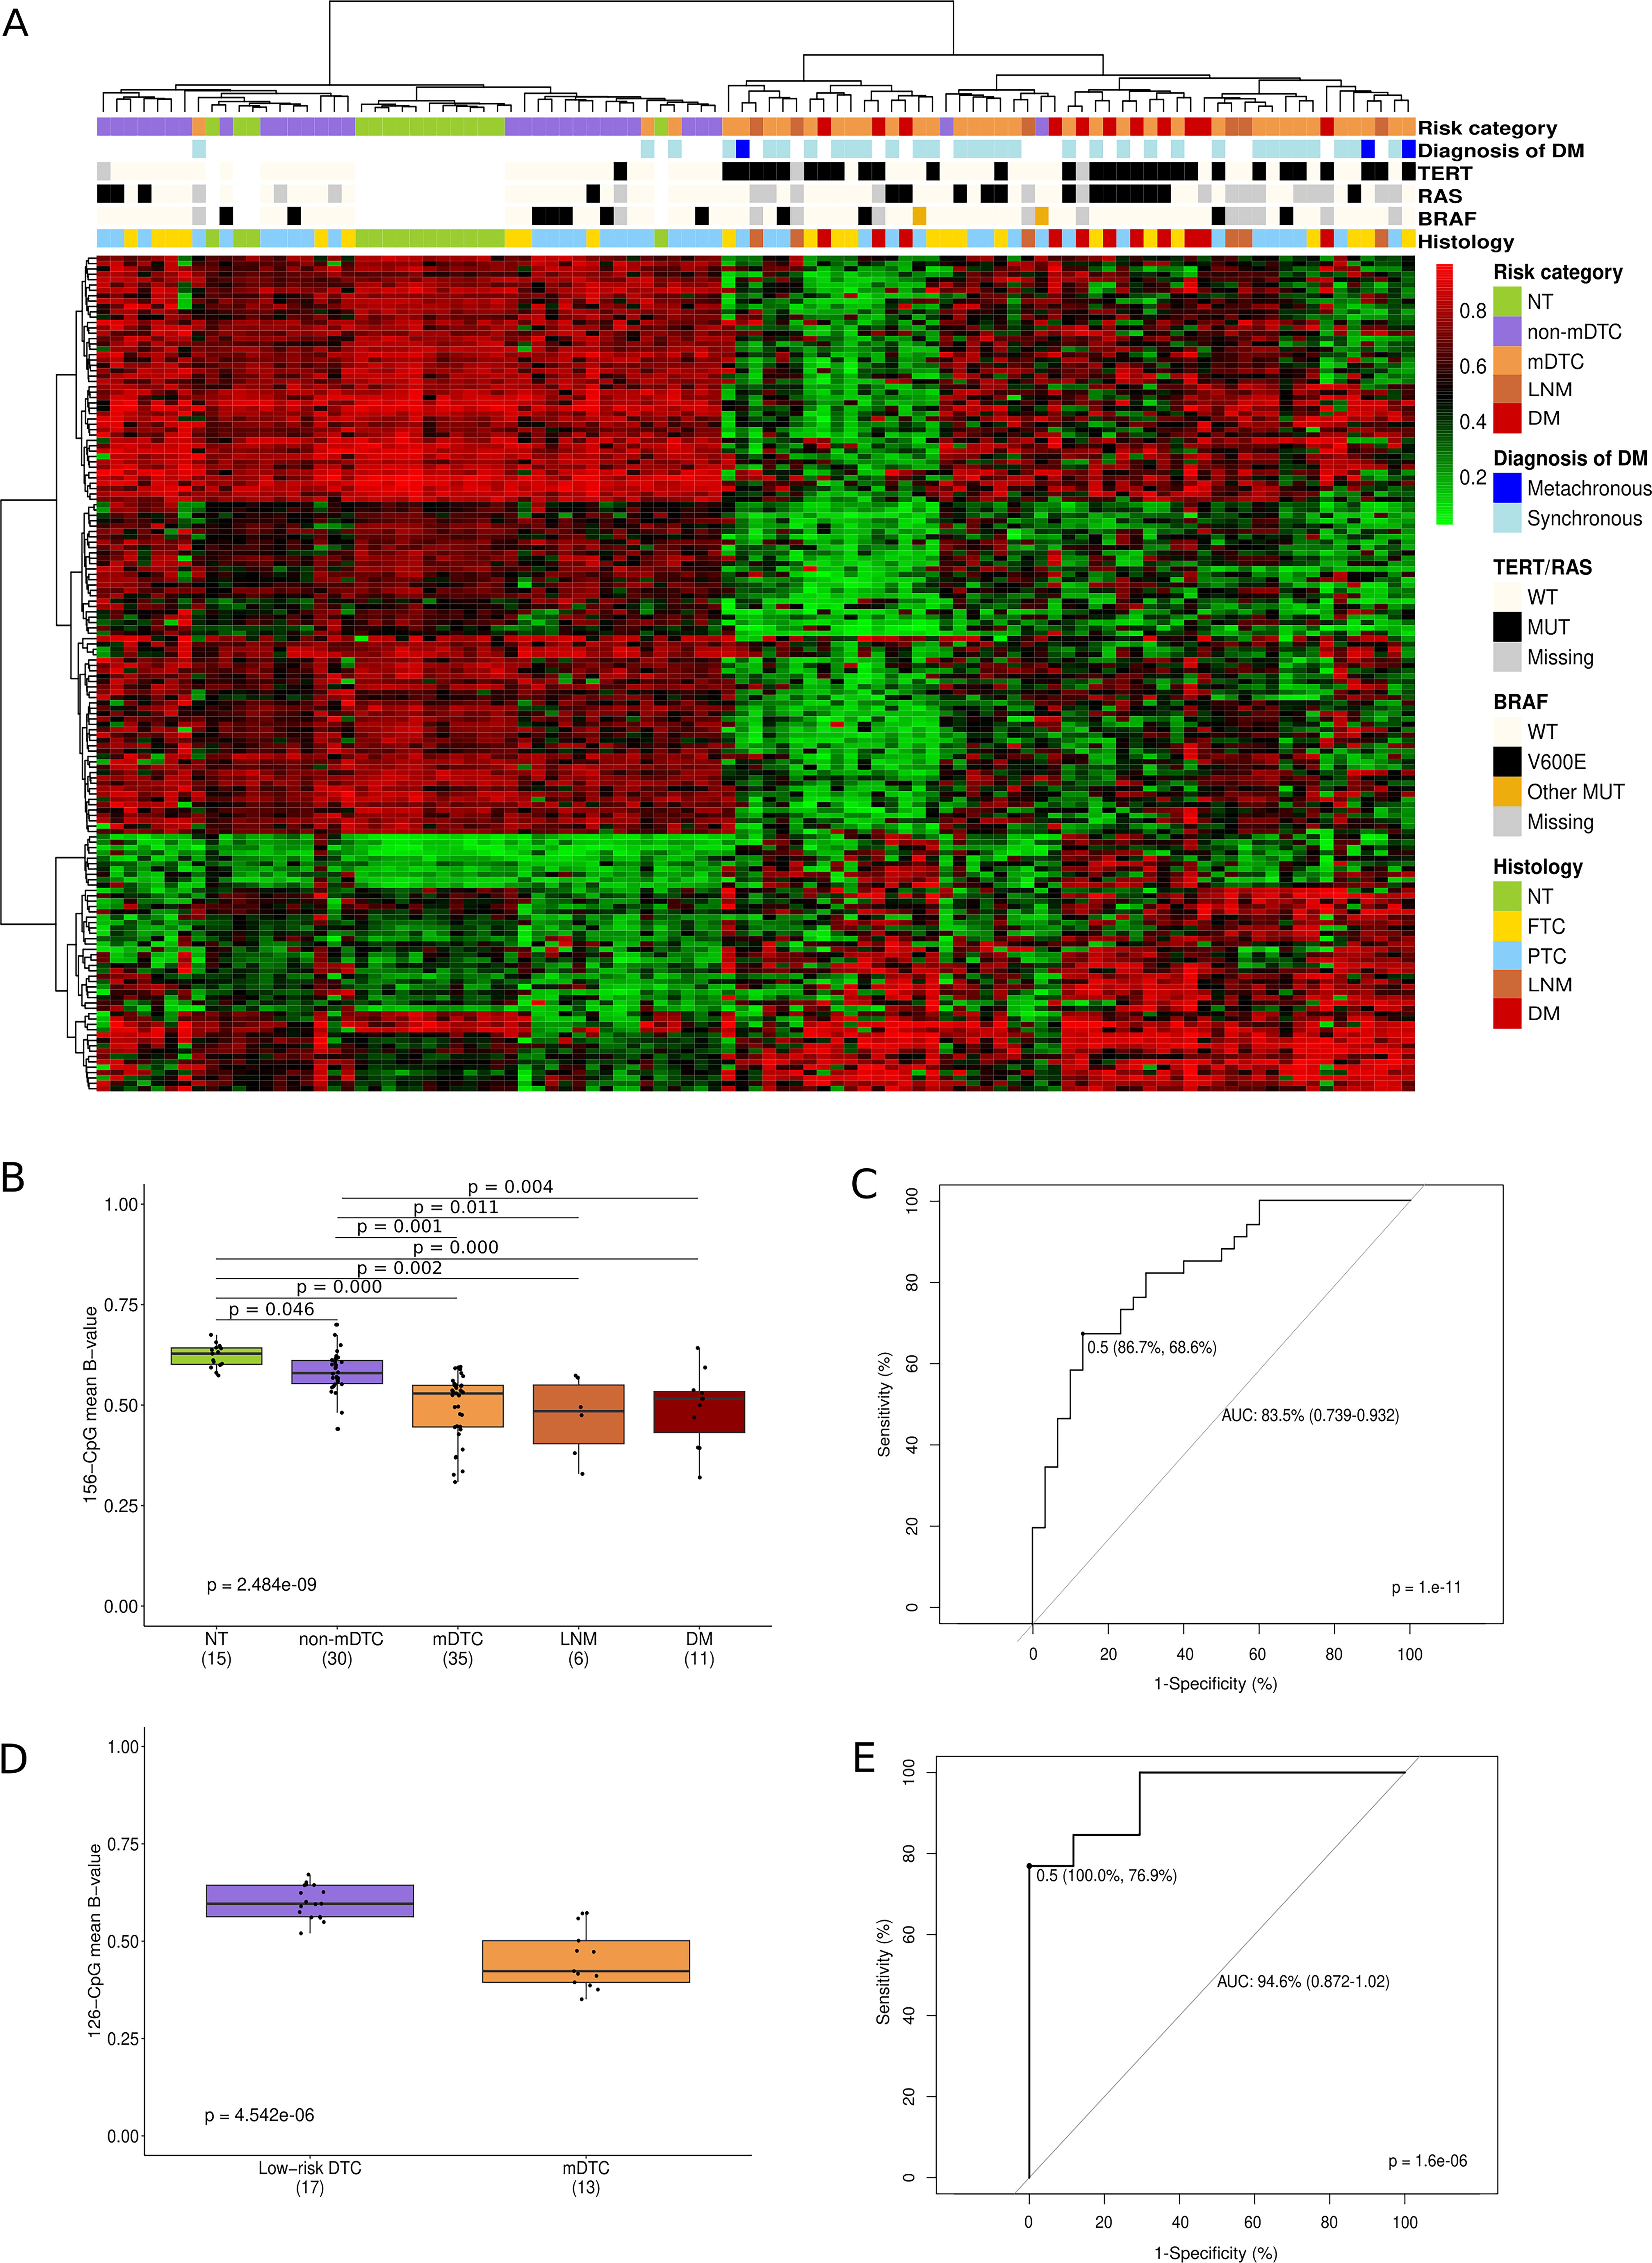
Prognostic value of the 156 CpG-signature.
The average level of methylation of the 156 CpGs was lower in mDTC and DM than in non-mDTC and normal tissue and was able to discriminate between non-mDTC and mDTC with an area under the curve (AUC) of 0.835, sensitivity of 68.6%, and specificity of 86.7% (Fig. 6B, C). Our DNA methylation signature outperformed the discriminatory ability of TERTp mutations (AUC of 0.768, sensitivity of 60%, and specificity of 96%), and was validated with even higher performance in the validation series (AUC of 0.946, sensitivity of 76.9%, and specificity of 100%) (Fig. 6D–E). In the validation series, it correctly classified all non-mDTC and 10 out of 13 mDTC (Supplementary Table S10).
GO analysis of the 156 CpG-associated genes did not show significantly enriched GO terms, probably due to the low number of CpGs and associated genes (Supplementary Table S11). However, some of these genes have been reported to play a role in tumorigenesis and metastasis, such as ADGRL4, CD1C, PRDM16, and FLII, 32 –35 which, notably, were also differentially expressed between low- and high-risk PTC from TCGA (Supplementary Fig. S8).
Discussion
In the present study, we have profiled DNA methylation during DTC metastatic progression and found a progressively increasing number of alterations, mostly hypomethylation, from normal tissue through DTC to DM, both in PTC and FTC, although DNA methylation dynamics differed between the two histological types.
Previous genome-wide DNA methylation studies comparing PTC and FTC with normal thyroid tissue reported a predominance of hypomethylated CpGs in PTC in contrast to FTC. 18,24,25 However, these studies included mostly low- and intermediate-risk DTC. To our knowledge, this is the first study profiling DNA methylation in mDTC and DM. Importantly, our results revealed that the opposite profiles of hypomethylated and hypermethylated CpGs between PTC and FTC were specific to non-metastatic tumors, whereas both mPTC and mFTC displayed more hypomethylated than hypermethylated CpGs. Similarly, global DNA methylation levels showed a global hypomethylation of non-CGI regions in non-mPTC, mPTC, and mFTC although not in non-mFTC. Although it is well known that global DNA hypomethylation can cause chromosomal instability, aberrant gene expression, and derepression of imprinted genes and retrotransposons, 16 the functional implications of hypomethylation in thyroid cancer progression remain unclear. In turn, mPTC and mFTC exhibited a global hypermethylation of CGI, in accordance to the classical CGI methylator phenotype. 36
Another significant finding of this study is that the overlap of methylation alterations between non-mPTC and non-mFTC is low, whereas it is high between mPTC and mFTC and between PTC-DM and FTC-DM. This suggests that many of the epigenetic alterations underlying PTC and FTC initiation are histology-specific, whereas many of those underlying metastatic progression are shared. Since most cases of PTC are BRAF-like tumors, characterized by high MEK-ERK signaling, and most cases of FTC are RAS-like tumors, characterized by low MEK-ERK signaling and concurrent activation of PI3K, 22 we can speculate that these signaling pathways may regulate, at least in part, these epigenetic differences between non-mPTC and non-mFTC. Further research in this line is warranted.
Cancer cells need to acquire certain properties and functions in order to metastasize, including migration and invasiveness capacity. 37 In this vein, our analyses have shown that methylation alterations during metastatic progression in DTC are associated with genes related to cell adhesion, whose disruption is key to metastatic dissemination. Interestingly, we found that both non-mPTC and non-mFTC harbored few differentially methylated cadherin and protocadherin genes, whereas this figure was greatly increased in mPTC and mFTC and even more in DM. Many studies have demonstrated the epigenetic deregulation of these genes in different tumor types, where they are hyper- or hypomethylated and confer pro- or antimetastatic capacities depending on the specific cadherin/protocadherin. 38,39 Further analysis of some of the genes that are differentially methylated during DTC metastatic progression could contribute to a better understanding of the molecular pathways underlying cell dissemination and help identify new therapeutic targets.
Our results show a progressive gain of methylation alterations during the progression of both PTC and FTC. Many of the alterations arising in non-mDTC are maintained in both mDTC and DM, suggesting their importance in tumorigenesis and tumor maintenance. mDTC then acquire de novo alterations, some of which may be involved in the acquisition of the metastatic phenotype. Many of de novo alterations are also present in DM, along with other unique alterations acquired exclusively in DM, which may facilitate the development and outgrowth of DM. Overall, these findings suggest that the progression may be linear (Fig. 7). Notably, if DM were seeded by a minor subclone in the primary tumor, as posited by the classical progression model, 37 these alterations would unlikely be detected by bulk DNA methylation analysis in the primary tumor. However, the epigenetic similarity we have found between the paired primary tumor and DM suggests that DM may derive from a major subclone in the primary tumor. Similarly, and in line with previous reports, 40,41 we have found a high concordance between BRAF, RAS, and TERTp mutations in the paired primary tumor and DM. Furthermore, the molecular similarity of the primary tumor, surgically removed, and the metachronous DM developed years later suggests that certain alterations involved in metastatization occur before the clinical diagnosis. A few metastatic cells from the primary tumor may disseminate prior to surgery and remain “dormant,” which is common in DTC, 42 until later reactivation, at which point they acquire new DNA methylation alterations.

Model of differentiated thyroid cancer (DTC) metastatic progression. Our results suggest a linear progression model of DTC, in which tumors evolve over time acquiring genetic and epigenetic alterations and giving rise to different subclones (represented here by different colors). Once a prometastatic subclone emerges and outgrows, becoming a major subclone (light golden), these cells can disseminate and seed DM. As a result, the paired mDTC and DM present genetic and epigenetic similarities. The dissemination of DM occurs before the initial diagnosis (Dx) of the primary tumor; however, in many patients, the DM can be biologically and clinically dormant for years before progression (metachronous DM). Epigenetically, there is a progressive increase in alterations of DNA methylation from non-mDTC to DM, with a high prevalence of hypomethylation. Hyper, hypermethylated; hypo, hypomethylated.
The methylation alterations common in metastatic primary tumors and DM not present in non-metastatic primary tumors are also clinically relevant as they may have prognostic implications. This is the case for the 156-CpG signature that we have identified and validated in the primary tumor and that can distinguish between non-mDTC and mDTC. Furthermore, the average methylation level of this signature has shown an excellent performance in identifying mDTC, both those that develop synchronous and metachronous DM, and therefore may predict the development of DM. The early identification of patients with DTC at high risk of DM would facilitate personalized and predictive medicine, enabling timely and appropriate interventions. Early detection of disease progression through intensified follow-up would further improve treatment efficacy and ultimately patient outcomes.
To our knowledge, this is the first comprehensive epigenetic analysis in a large series of DTC and paired metastases. Nevertheless, our study has some limitations, including its retrospective nature. Reliance on the data storage and collection methods from each center may have limited the availability of data and biased results. In addition, due to the low prevalence of mDTC, the number of samples was limited, and since metastatic lesions are not routinely biopsied in these patients, the number of paired primary tumors and metastases was low. Despite these limitations, our findings provide a solid rationale for future research on DNA methylation clinical utility in the metastatic progression of DTC.
Conclusions
In conclusion, our comprehensive DNA methylation analysis has unveiled new insights into the dynamics of DNA methylation and its role in thyroid cancer development and metastatic progression as well as into the natural history of DM, proposing a model of the evolution of the disease. Our findings are also valuable from a clinical perspective in that the 156-CpG signature may improve the current clinical risk classification of patients with DTC and help advance personalized medicine in thyroid cancer.
Footnotes
Acknowledgments
The authors thank patients and their families for allowing the collection of biological samples. The authors also thank the Germans Trias i Pujol Research Institute (IGTP) core facilities and their staff for their contribution and technical support: High Content Genomics and Bioinformatics Core Facility (Laia Ramos Masdeu, David Piñeyro) and the Biobank integrated in the Spanish National Biobanks Network of Instituto de Salud Carlos III (PT13/0010/0009) and Tumour Bank Network of Catalonia (Edurne Pedrosa, Laia Pérez). The results published here are in part based upon data generated by TCGA Research Network (![]() ).
).
Authors’ Contributions
C.Z., C.I., E.N.K.H., B.M.v.H., C.C., C.P.-F., J.H.L., R.S., G.R.-E., C.M.-C., M.R., J.H., J.C., J.L.R., M.P.-D., and T.P.L. selected patients and/or samples and/or collected clinical data, coordinated by C.Z. and C.I. A.R.-P., L.G., J.M.-R., R.M., R.P., and J.S. supervised and/or conducted and/or analyzed experiments. H.R.-L., J.F.S.-H., J.G., and L.S. designed and/or supervised and/or performed bioinformatic and statistical analyses. M.J., M.P.-D., and J.H. acquired funding for the project. M.J., H.R.-L., C.Z., and C.I. wrote the original draft of the article and produced the figures. J.G., C.M.-C., M.R., M.P.-D., T.P.L., and G.R.-E. reviewed and edited the article. M.J., C.Z., and C.I. conceived the study. All authors reviewed and approved the final version of the article.
Author Disclosure Statement
J.C. has provided scientific advice and/or received honoraria or funding for continuous medical education from AAA, Advanz Pharma, Amgen, Bayer, Esteve, Hutchmed, Ipsen, Merck, Novartis, Roche, Sanofi, Lilly, Eisai, Bayer, ITM, and has received research support from Pfizer, Novartis, AstraZeneca, Eisai, AAA, Amgen, Bayer, Roche, Gilead and ITM. M.P.-D. has received funding from Eisai, Ipsen, Recordati, and AstraZeneca for continuous medical education and advisory boards. M.J., H.R.-L., M.P.-D., C.Z., and C.I. have filed a patent (EP24383456). The rest of authors have declared that no conflict of interest exists.
Funding Information
This work was supported by Instituto de Salud Carlos III, co-funded by ERDF/ESF, “Investing in your future” (PI14/00308 and PI18/00654 to M.J.) or co-funded by the European Union (PI21/00195 to M.J.); the Catalan Agency for Management of University and Research Grants (AGAUR) of the Government of Catalonia (SGR 2017 1262 and 2021 SGR 00539 to M.P.-D.); the Foundation of the Spanish Society of Endocrinology and Nutrition (2019 FSEEN Research Grant in Thyroid Pathology to M.J.); and the Spanish Group of Neuroendocrine and Endocrine Tumors (2018 GETNE Junior Fellowship Research Project to J.H.). H.R.-L. was supported by a PFIS fellowship from Instituto de Salud Carlos III co-funded by the European Union (FI22/00066). A.R.-P. was supported by a Joan Oró fellowship from the Agency for Management of University and Research Grants (AGAUR) of the Government of Catalonia (2023 FI-1 00508). IGTP is a member of the CERCA network of institutes supported by the Health Department of the Government of Catalonia.
Supplementary Material
Supplementary Data
Supplementary Figure S1
Supplementary Figure S2
Supplementary Figure S3
Supplementary Figure S4
Supplementary Figure S5
Supplementary Figure S6
Supplementary Figure S7
Supplementary Figure S8
Supplementary Figure S9
Supplementary Table S1
Supplementary Table S2
Supplementary Table S3
Supplementary Table S4
Supplementary Table S5
Supplementary Table S6
Supplementary Table S7
Supplementary Table S8
Supplementary Table S9
Supplementary Table S10
Supplementary Table S11
Supplementary Table S12
Supplementary Table S13